Just2Trade is always ready to provide you with some useful information from the finance world! Today, we're going to tell you about an income statement and everything related to it: what an income statement actually is, what its main components are, why it's important for your business, and whether it’s worth paying attention to income statement analysis. So don't waste time: start reading, and don't forget to take some notes!
A company's financial success over a particular accounting period is reported using one of the three major financial statements, the income statement. The cash flow statement and the balance sheet are the other two important statements.
The income statement focuses on the company's earnings for a specific time period, including profits and losses. An income statement, sometimes referred to as a profit and loss statement (P&L) or a summary of sales and expenses, offers crucial information about a company's operations, the effectiveness of its leadership, underperforming industries, and performance in comparison to peers in the same sector.
An essential component of the corporate performance reports that must be reported to the U.S. Securities and Exchange Commission is the income statement (SEC). The income statement reports income over a certain time period, typically a quarter or a year, and its heading specifies the duration, for example, "For the (fiscal) year/quarter ended June 30, 2021," while a balance sheet gives a snapshot of a company's finances as of a specific date.
The four main components of the income statement are revenue, expenses, profits, and losses. It does not distinguish between cash and non-cash receipts (cash sales as opposed to sales on credit) or cash as opposed to non-cash payments or disbursements (purchases in cash vs. purchases on credit). It begins with the specifics of the sales and works its way down to compute the net income and ultimately the earnings per share (EPS). In essence, it explains how net revenue collected by the company is converted into net earnings (profit or loss).
An income statement assists business owners in determining if they can make a profit by increasing sales, cutting expenses, or doing both. Additionally, it demonstrates the success of the plans the company made at the start of a certain fiscal year. This document can be used by business owners to determine whether their strategies are successful. They can identify the best methods to increase earnings based on their analysis.
A few additional elements that an income statement reveals are listed below:
Regular reports: The income statement is produced either weekly or monthly, whilst other financial statements are issued annually. As a result, investors and business owners can keep a close eye on the company's performance and make wise choices. This enables them to identify and address small business issues before they grow and become costly.
Identifying expenses: The statement identifies any upcoming costs, any unforeseen costs incurred by the business, and any areas that are over or under budget. Rent for the facility, employees, and other administrative charges are expenses. A small business may see that its expenses are rising as it starts to expand. These costs might include recruiting staff, purchasing supplies, and advertising the company.
Overview of the company: This section provides investors with general information about the company they wish to invest in. To determine whether the company is creditworthy, banks and other financial institutions can also review this document.
Now, let's have a look at the main components of an income statement – below, you'll see all the key details about each one.
Sales Revenue, which is shown at the very top of the statement, is the company's revenue from sales or services. This amount represents the whole income from selling the items and/or rendering the services. A company's total revenue line may come from a variety of revenue streams.
Cost of Goods Sold (COGS) is a line item that combines the direct expenses related to buying and selling goods to make money. If the company is a service-based enterprise, this line item may also be referred to as the Cost of Sales. Labor, components, materials, and an allocation of additional costs like depreciation are examples of direct costs (see an explanation of depreciation below).
Gross Profit is computed by deducting the Cost of Goods Sold (or Cost of Sales) from Sales Revenue.
Most firms incur some costs as a result of their sales of products and/or services. Because these are similar costs that are all related to selling, marketing, advertising, and promotion expenses are frequently combined.
Selling, general, and administrative expenses are made up of all other indirect expenditures related to operating the company. This includes employees and salary, office rent and costs, insurance, travel costs, and occasionally depreciation and amortization, in addition to other operational costs. However, entities may decide to include depreciation and amortization in distinct sections.
Earnings before Interest, Tax, Depreciation, and Amortization, or EBITDA, is not always shown in income statements. It is computed by subtraction from the gross profit of SG&A costs (excluding amortization and depreciation).
Accounting professionals devise depreciation and amortization as non-cash charges to stretch out the cost of capital assets including property, plant, and equipment (PP&E).
Operating Income is the revenue generated by ongoing business operations. In other words, it's the profit before any non-operating income, non-operating expense, interest, or tax is deducted. Earnings Before Interest and Taxes, or EBIT, is a phrase that is frequently used in the financial industry.
Interest Charge. It's typical for businesses to separate interest revenue and expense as separate lines on the income statement. The purpose of this is to balance the disparity between EBIT and EBT. The debt schedule decides how much interest will be paid.
Other costs that are specific to a business's industry are frequently incurred. Other costs may include those related to fulfillment, technology, research and development (R&D), stock-based compensation (SBC), impairment charges, gains or losses from the sale of investments, foreign exchange effects, and a wide range of costs that are company- or industry-specific.
EBT, sometimes referred to as pre-tax income, is calculated by deducting interest expense from operating income. This is the last subtotal before calculating net income.
Income taxes are the applicable taxes imposed on earnings before taxes. Current taxes and future taxes may both be included in the overall income tax expense.
Income tax is subtracted from pre-tax income to determine net income. After subtracting any dividend payments, this sum is what is included in retained earnings on the balance sheet.
The income statement includes the following information, though the format may change based on the local regulatory requirements, the diverse nature of the enterprise, and the accompanying operating activities:
Operating revenue is a term frequently used to describe revenue generated by core activities. The term "revenue from primary activities" refers to income generated from the sale of a product for a company that manufactures that product, as well as for a wholesaler, distributor, or retailer engaged in the business of selling that product. Similar to this, revenue from principal operations for a corporation (or its franchisees) engaged in the service industry refers to the income or fees received in exchange for providing those services.
Nonoperating, recurring revenue is a term frequently used to describe revenue generated by ancillary, non-core company activity. This income comes from sources other than the buying and selling of goods and services. Examples include interest income on business capital held in a bank, rental income from real estate owned by the business, income from joint ventures like royalty payment receipts, or income from an advertisement displayed on real estate owned by the business.
Gains, often known as other income, refer to the net revenue generated by different operations, such as the sale of long-term assets. Included in this is the net profit from one-time non-business ventures such as the sale of a company's underused land, obsolete transportation van, or subsidiary business.
Receipts and revenue are not the same things. When purchases are made or services are rendered, payment is often recorded at that time. Receipts are the cash amounts that are recorded as soon as they are received.
Expenses are the costs incurred by a business to maintain operations and generate profits. If they adhere to Internal Revenue Service (IRS) regulations, certain of these expenses might be deducted from income on a tax return.
All of these costs are incurred to generate the typical operational revenue associated with the business's main activity. These expenses consist of selling, general, and administrative (SG&A), depreciation and amortization, cost of goods sold (COGS), and research and development (R&D) costs. Employee salaries, sales commissions, and costs for services like energy and transportation typically appear on the list.
These are all costs associated with non-core business operations, such as interest on loans.
These are all costs associated with a loss-making sale of long-term assets, one-time charges, unexpected costs, or expenditures associated with legal actions.
Secondary income and fees reflect the company's involvement and proficiency in managing ad hoc, non-core operations, whereas primary revenue and expenses provide information about how effectively the company's core business is operating.
The following equation is used to determine net income mathematically:
Net Income = (Revenue + Gains) - (Expenses + Losses)
To illustrate the aforementioned formula with some actual data, let's pretend that a hypothetical sporting goods company that also offers training is presenting its income statement for a recent hypothetical quarter.
Sales of sporting products brought in $26,800, and training services brought in $5,000. It spent various sums on the specified actions, which add up to $10,650. It made $2,000 in net gains from the sale of an old van, but $800 in losses were incurred to resolve a customer complaint. For the specified quarter, the net income totals $21,350. The simplest revenue statement that a typical business can produce is the one in the aforementioned example. It is based on a straightforward computation that adds revenue and gains and deducts expenses and losses, hence the name "single-step income statement."
However, real-world businesses routinely engage in mergers, acquisitions, and strategic partnerships, participate in a broad range of business sectors offering a variety of products and services, and frequently operate on a worldwide scale. The income statement contains numerous and intricate accounting entries as a result of the vast variety of operations, varied sets of expenses, different business activities, and requirements for reporting in a standard manner for regulatory compliance.
Listed firms use an income statement that is prepared over numerous steps and separates operational revenue, operating expenses, and gains from non-operating revenue, non-operating expenses, and losses. This method produces an income statement that provides much more information.
In a multiple-step income statement, the various profitability metrics are essentially given at four different operational levels: gross, operating, pretax, and after-tax. This segmentation aids in determining how income and profitability are shifting/changing from one level to another, as we'll see shortly in the example that follows. For instance, a high gross profit but a low operational income suggests increased costs, whereas a high pre-tax profit but a low post-tax profit suggests that gains were lost to taxes and other one-time, exceptional expenses.
Let's examine an illustration based on the yearly income statements for 2021 of two sizable, publicly traded, global businesses from various industries: technology (Microsoft) and retail (Walmart).
The primary objective of this common format is to determine the profit or income at each subhead of revenue and operational expenses, and then to take into account required taxes, interest, and other non-recurring, one-time occurrences to determine the net income that pertains to common stock. Even though these computations just need basic adds and subtraction, the arrangement of the different elements in the statement and their connections are frequently repetitive and convoluted. For a deeper understanding, let's look closely at these figures.
The first section, under Revenue, states that for the fiscal year ending June 30, 2021, Microsoft's gross (annual) profit, or gross margin, was $115.86 billion. The amount was calculated by subtracting the cost of revenue ($52.23 billion) from the total revenue ($168.09 billion) that the IT giant generated in this fiscal year. The cost of generating revenue accounted for just over 30% of Microsoft's total sales, but Walmart's comparable percentage in its fiscal year 2021 was almost 75% ($429 billion/$572.75 billion). It shows that Walmart invested substantially higher costs than Microsoft to produce comparable sales.
The stated values for the Operating Expenses section are calculated by again using Microsoft's cost of revenue ($52.23 billion) and total revenue ($168.09 billion) for the fiscal year. Total operational expenses are calculated by adding these numbers together ($52.23 billion + $20.72 billion + $25.23 billion = $98.18 billion), as Microsoft spent $20.72 billion on R&D and $25.23 billion on SG&A costs.
Operating income (or loss) is calculated as total operating expenses minus total revenue, which results in a total of $69.92 billion ($168.09 billion - $98.18 billion). The net income is later calculated using this figure, which represents the company's earnings before interest and taxes (EBIT) for its main business operations.
The net income from continuing operations for Microsoft ($61.27 billion), which is roughly 60% larger than that of Walmart ($13.67 billion), is calculated by adding net other income or expenses (including one-time earnings), interest-linked charges, and relevant taxes.
The number of weighted average shares outstanding is multiplied by the net income amount to calculate earnings per share. Microsoft's 2021 EPS was $8.12 per share ($61.27 billion, which represents 7.55 billion shares). Walmart's EPS for that fiscal year was $4.90 ($13.67 billion x 2.79 billion), which equates to 2.79 billion shares outstanding.
By the way, if you need to create an income statement, you don't need special software – it's actually enough to build an income statement template in Excel that you can use to evaluate your company's financial health. And that's great news for everyone!
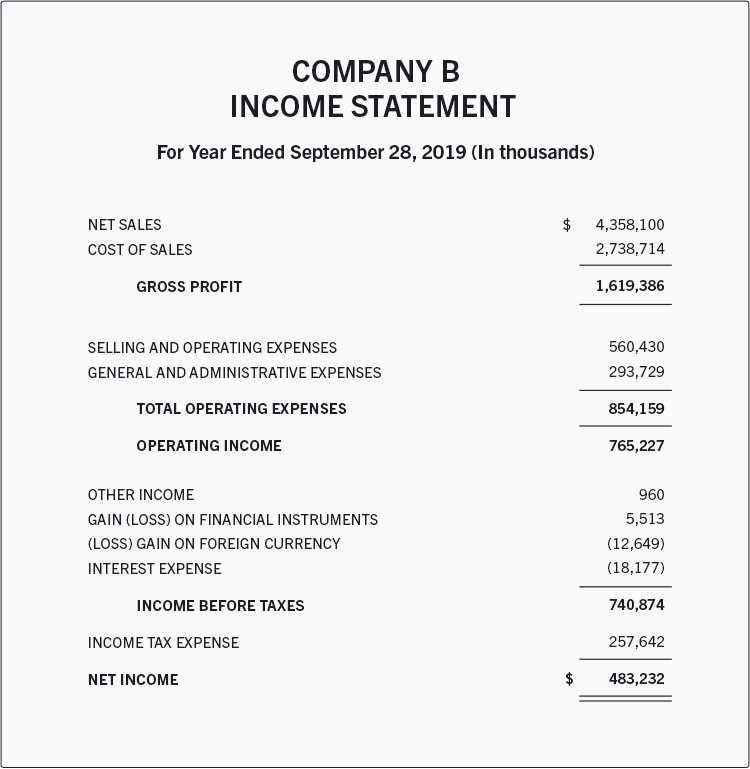
Here is an illustration of a fictional company's income statement for the calendar year that concluded on September 28, 2019.
According to this income statement, the corporation generated $1.619 billion in gross profit from sales of $4.358 billion, which cost about $2.738 billion to achieve.
This profit was reduced by $293 million in general and administrative costs and $560 million in selling and operational costs, leaving an operating income of $765 million. Additional gains were recorded, as well as losses and $257 million in income taxes, among others.
As a result, the business ended the year with a net income of $483 million.
In the real world, businesses that conduct their operations on a global scale offer a variety of goods and services and engage in mergers and alliances. They have a long list of activities and expenses to mention as a result of these activities. Additionally, these businesses must adhere to particular reporting laws. Therefore, larger businesses choose multi-step income statements. Operational revenues, operating costs, and gains are distinguished in this approach from non-operating costs, non-operating revenues, and losses. The four levels of profitability are gross, operating, pre-tax, and post-tax.
Don't forget about common size income statements – they have an extra column of information that summarizes each line item's contribution to overall revenue. It is simpler to compare trends and changes in your firm when your income statements are of a standard size.
Although the major goal of an income statement is to provide stakeholders with information about the firm's profitability and commercial operations, it also offers thorough insights into the internal operations of the organization for comparison across various industries and enterprises. An investor can grasp what makes a company profitable by knowing the income and expense components of the statement.
Based on income statements, management can decide to enter new markets, increase sales, increase manufacturing capacity, use more assets or sell them completely, or close down a department or product line. Competitors may also utilize them to learn more about a company's performance metrics and priority areas, such as increasing R&D spending.
Because they are more concerned with a company's future cash flows than its previous success, creditors can find income statements to be of limited help. The income statement is used by research analysts to compare quarterly and yearly performance. For instance, one might conclude management's capacity to control operating costs without sacrificing profitability or whether a company's attempts to lower its cost of sales helped it enhance profits over time.
An income statement offers useful information about several facets of a firm. It comprises readings on a firm's operations, managerial effectiveness, potential profit leaks, and if the organization is functioning in line with its competitors.
Still have some questions about income statements? If so, we recommend you explore the FAQ list below – there, you'll definitely find the answers to all of your outstanding questions.
An income statement shows a company's income and expenses on a financial statement. It also reveals if a business is profitable or losing money over a specific time frame. You can better grasp your company's financial situation with the aid of the income statement, balance sheet, and cash flow statement.
The main parts of an income statement are Revenues, Expenses, and Profit.
To find an income statement, just use the appropriate formula – you'll see it just below.
Net Income = (Revenue + Gains) - (Expenses + Losses)
© 2024 Lime Trading (CY) Ltd
Lime Trading (CY) Ltd is authorised and regulated by the Cyprus Securities and Exchange Commission in accordance with license No.281/15 issued on 25/09/2015. The "Just2Trade" trademark is owned by LimeTrading (CY) Ltd.
Registration Number: HE 341520
Address: Lime Trading (CY) Ltd
Magnum Business Center, Office 4B, Spyrou Kyprianou Avenue 78
Limassol 3076, Cyprus
Disclaimer:
All promotions, materials and information of this website may have applied conditions. Please contact the Company for further details
Trading on financial markets carries risks. The value of the investments can both increase and decrease and the investors may lose all their investment capital. In case of a leveraged product, the loss may be more than the initial capital invested. Detailed information on risks associated with trading on financial markets can be found in General Terms and Conditions for the Provision of Investment Services..
E-mail: 24_support@just2trade.online