Income Statement Guide: Understanding Business Financial Performance 2026

Just2Trade is always ready to provide you with some useful information from the finance world! Today, we're going to tell you about an income statement and everything related to it: what an income statement actually is, what its main components are, why it's important for your business, and whether it’s worth paying attention to income statement analysis. So don't waste time: start reading, and don't forget to take some notes!
Table of Contents
Income Statement Definition and Purpose
Income Statement Components and Structure
Income Statement Formats: Single-Step vs Multi-Step
Income Statement Calculations and Key Formulas
Real Income Statement Example: Microsoft Analysis
Income Statement vs Balance Sheet: Key Differences
Who Uses Income Statements and Why
Advanced Income Statement Analysis Techniques
Common Income Statement Analysis Mistakes to Avoid
Conclusion: Using Income Statements for Better Business Understanding
Frequently Asked Questions About Income Statements
An income statement (also called a profit and loss statement or P&L) is a financial document that reports a company's revenues, expenses, gains, and losses over a specific accounting period to determine net income. It uses either a single-step format (Revenue - Expenses = Net Income) or multi-step format showing gross profit, operating income, and earnings before taxes as separate calculations. The SEC requires public companies to file standardized income statements quarterly and annually.
Understanding income statements is fundamental to financial literacy. These documents reveal whether a business generated profit or sustained losses during a reporting period, making them essential tools for investors evaluating stock valuations, managers making operational decisions, and creditors assessing lending risk. Unlike a balance sheet that captures a snapshot of financial position at one moment, the income statement tracks performance across time — typically three months for quarterly reports or twelve months for annual statements.
The income statement operates on accrual accounting principles. This means revenue appears when earned (not necessarily when cash arrives) and expenses when incurred (not when paid). A software company selling annual subscriptions might recognize revenue monthly even though customers paid upfront. This timing distinction makes income statements different from cash flow statements, which track actual money movement.
Key Takeaways
- Dual terminology: Income statements are also called profit and loss statements (P&L) or statements of operations, with all terms referring to the same financial document
- Two format options: Single-step format simplifies calculations for small businesses, while multi-step format provides detailed profitability analysis preferred by investors and large corporations
- Regulatory framework: The SEC has required standardized income statement filing from public companies since 1934, ensuring consistent financial reporting across markets
- Core calculation: Net income equals total revenues minus total expenses, though multi-step formats break this into intermediate profitability levels
- Universal application: Every business entity from sole proprietorships to multinational corporations benefits from income statement analysis for performance measurement
Income Statement Definition and Purpose
Income statements serve as the primary financial performance report for any business entity. The document systematically lists all revenue sources, subtracts all expenses incurred, and calculates the resulting profit or loss. This fundamental accounting tool answers one critical question: Did the business make money during the reporting period?
The income statement goes by several names depending on context. Accountants typically use "income statement" in formal settings. Business managers often prefer "profit and loss statement" or simply "P&L" in operational discussions. Some companies call it the "statement of operations" or "statement of earnings." Regardless of terminology, the document serves identical analytical purposes and follows standardized accounting principles.
Financial reporting regulations mandate income statement preparation. The Securities and Exchange Commission requires all publicly traded companies to file quarterly (10-Q) and annual (10-K) reports containing audited income statements. These filings follow Generally Accepted Accounting Principles (GAAP) in the United States or International Financial Reporting Standards (IFRS) globally, ensuring consistency and comparability across companies and industries.
The income statement fits within a three-document financial reporting framework. While the balance sheet shows what a company owns and owes at a specific date, and the cash flow statement tracks money movement, the income statement focuses exclusively on operational performance. Together, these three statements provide a complete picture of business financial health.
P&L and Accounting Period Fundamentals
The term "profit and loss statement" emerged from business practice rather than formal accounting theory. Managers focused on the bottom-line question: Did we make a profit or sustain a loss? This straightforward terminology became standard vocabulary in boardrooms worldwide.
Accounting periods define income statement timeframes:
- Monthly statements — Internal management review and operational tracking
- Quarterly reports — Public companies file 10-Q covering three-month periods (Q1-Q4)
- Annual statements — Comprehensive yearly financial performance via 10-K filings
- Fiscal years — Many companies use non-calendar fiscal years (e.g., retailers ending in January post-holidays)
Period consistency enables meaningful trend analysis. A ski resort comparing Q1 to Q2 revenue would be meaningless, but year-over-year Q1 comparisons reveal growth trends. Investors always compare identical periods to filter out seasonal variations.
Income Statement Components and Structure
Every income statement contains four fundamental components: revenues, expenses, gains, and losses. Revenues come from primary business activities — product sales for manufacturers, service fees for consultants, subscription charges for software companies. Expenses represent the costs incurred to generate those revenues, including materials, labor, rent, utilities, and marketing.
Gains and losses arise from secondary activities outside core operations. A manufacturing company selling old equipment at a price above book value records a gain. Investment portfolio losses from stock market declines appear separately from operating results. This distinction between operating and non-operating items helps stakeholders assess core business performance versus peripheral activities.
The income statement follows a logical sequence from top to bottom. Revenue appears first, often called the "top line" in business discussions. Various expense categories subtract from revenue in successive steps. The final result is net income — the "bottom line" that indicates overall profitability. This top-to-bottom flow creates an intuitive reading experience: start with what came in (revenue), subtract what went out (expenses), see what remains (profit).
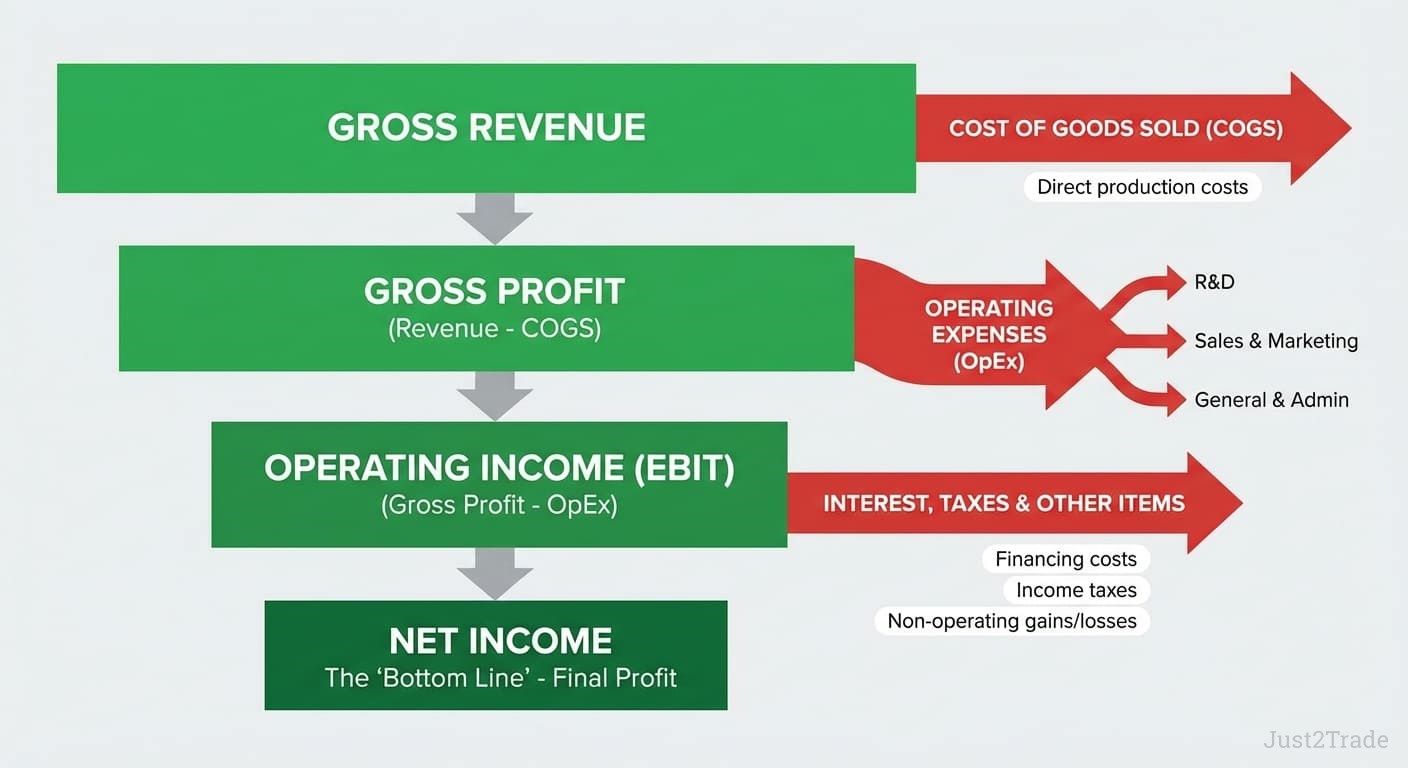
Different industries emphasize different components. Retail companies focus heavily on cost of goods sold (COGS) because inventory expenses dominate their operations. Software companies with minimal production costs emphasize operating expenses like research and development. Banks prioritize interest income and interest expense. Understanding industry-specific patterns helps when comparing companies within the same sector.
Operating Income vs Net Income: Understanding Profitability Levels
Operating income measures profitability from core business activities before financing costs and taxes. The calculation starts with gross profit (revenue minus cost of goods sold), then subtracts operating expenses like salaries, rent, marketing, and depreciation.
Key differences:
- Operating Income (EBIT) — Isolates operational performance, excludes interest and taxes, shows management efficiency
- Net Income — Final bottom line after all deductions including interest, taxes, and non-operating items
- Gap analysis — Difference reveals financing and tax impacts on profitability
A company with $50 million operating income paying $8 million interest and $12 million taxes would report $30 million net income. The $20 million gap signals significant debt obligations that don't reflect core business efficiency.
Investors analyze both metrics for different insights. Strong operating income with weak net income might indicate excessive debt but a solid underlying business. Weak operating income signals fundamental problems that financial engineering cannot fix.
Income Statement Formats: Single-Step vs Multi-Step
Income statements come in two standardized formats, each serving different analytical needs. The single-step format provides straightforward calculation for small businesses. The multi-step format offers detailed profitability analysis for investors and large corporations.
Single-step income statements use one calculation: total revenues and gains minus total expenses and losses equals net income. A small retail store showing $500,000 sales revenue and $380,000 combined expenses calculates $120,000 net income in one step. This format works well for straightforward operations and internal management reports.
Multi-step income statements calculate profitability at successive levels: gross profit, operating income, income before taxes, and net income. Each calculation provides specific insights about business performance. A manufacturer with $1 million revenue and $600,000 COGS reports $400,000 gross profit (40% gross margin). After subtracting $250,000 operating expenses, operating income equals $150,000. Finally, interest and taxes are deducted to reach net income.
| Feature |
Single-Step Format |
Multi-Step Format |
| Calculation Method |
One calculation: (Revenues + Gains) - (Expenses + Losses) |
Multiple stages: Gross Profit → Operating Income → Net Income |
| Profitability Levels |
One level: Net Income only |
Four levels: Gross, Operating, Pre-tax, Net |
| Complexity |
Minimal - simple subtraction |
Detailed - multiple categories and calculations |
| Best Suited For |
Small businesses, simple operations, internal reports |
Large corporations, investor analysis, complex operations |
| Preparation Time |
Quick and straightforward |
More time-intensive and detailed |
| Analysis Capability |
Basic profitability overview |
Comprehensive performance insights |
| Stakeholder Preference |
Management, small business owners |
Investors, analysts, creditors |
Choosing the Right Format for Your Business
Format selection criteria:
- Single-step — Small businesses, simple operations, internal reports, minimal outside investors
- Multi-step — External financing needs, multiple product lines, investor demands, regulatory requirements
- Public companies — Must use multi-step formats in SEC filings for standardized investor information
Banks analyzing loan applications require multi-step formats to assess whether core business generates enough profit to service debt. Investors evaluating stocks demand detailed profitability analysis that single-step formats cannot provide.
Income Statement Calculations and Key Formulas
Core formulas:
- Net Income = Total Revenue - Total Expenses
- Gross Profit = Revenue - Cost of Goods Sold
- Operating Income = Gross Profit - Operating Expenses
- Income Before Taxes = Operating Income + Non-Operating Income - Non-Operating Expenses
- Net Income = Income Before Taxes - Income Taxes
A bakery with $800,000 revenue and $320,000 COGS reports $480,000 gross profit (60% gross margin). After $280,000 operating expenses, operating income equals $200,000. Adding $5,000 interest income and subtracting $15,000 interest expense yields $190,000 pre-tax income. At 25% tax rate, final net income is $142,500.
Key profitability ratios:
- Gross Margin = (Gross Profit ÷ Revenue) × 100
- Operating Margin = (Operating Income ÷ Revenue) × 100
- Net Profit Margin = (Net Income ÷ Revenue) × 100
These percentages enable meaningful comparisons across companies of different sizes.
Earnings Per Share: Per-Share Profitability Measurement
Earnings per share (EPS) transforms total company net income into a per-share metric that enables size-neutral profitability comparisons. The formula divides net income by the number of outstanding common stock shares: EPS = Net Income ÷ Outstanding Shares.
Microsoft's 2024 fiscal year results demonstrate EPS calculation in practice. The company reported $88.1 billion net income with 7.47 billion diluted shares outstanding, yielding $11.80 earnings per share ($88.1 billion ÷ 7.47 billion = $11.80). This per-share figure allows investors to compare Microsoft's profitability to companies of vastly different sizes.
Companies report both basic EPS (actual outstanding shares) and diluted EPS (including potential shares from stock options and convertible securities). Diluted EPS represents a more conservative profitability estimate. EPS growth over time indicates business momentum — 15% annual EPS growth signals faster expansion than 5% growth, even with similar revenue patterns.
Real Income Statement Example: Microsoft Analysis
Examining Microsoft's actual income statement reveals how these concepts apply in practice. The technology giant's fiscal year 2024 results provide a comprehensive example of multi-step format reporting for a complex global corporation.
Microsoft Corporation - Fiscal Year 2024 Income Statement (Simplified)
| Line Item |
Amount (Billions) |
| Total Revenue |
$245.1 |
| Cost of Revenue |
$65.9 |
| Gross Profit |
$179.2 |
| Research & Development |
$27.2 |
| Sales & Marketing |
$24.9 |
| General & Administrative |
$7.6 |
| Operating Income |
$109.4 |
| Interest Income |
$2.7 |
| Interest Expense |
($1.8) |
| Other Income (Expense) |
($0.5) |
| Income Before Taxes |
$109.8 |
| Income Tax Expense |
$21.7 |
| Net Income |
$88.1 |
| Diluted Shares (Billions) |
7.47 |
| Earnings Per Share |
$11.80 |
Microsoft's $245.1 billion revenue came primarily from cloud services (Azure), software licensing (Windows, Office), gaming (Xbox), and hardware (Surface devices). The company's multi-step format separates these revenue streams from distinct expense categories, enabling detailed performance analysis.
The gross profit calculation ($245.1B revenue - $65.9B cost of revenue = $179.2B) yields a 73% gross margin, reflecting Microsoft's software-focused business model with relatively low production costs compared to hardware manufacturers. This high gross margin provides substantial operating leverage — most incremental revenue flows directly to gross profit.
Operating expenses totaling $59.9 billion cover research and development ($27.2B), sales and marketing ($24.9B), and general administration ($7.6B). These operating costs support product development, customer acquisition, and business infrastructure. The resulting $109.4 billion operating income represents a 45% operating margin, demonstrating exceptional core business profitability.
Non-operating items barely impact Microsoft's results. The company earned $2.7 billion interest income from cash investments but paid $1.8 billion interest expense on debt, plus $0.5 billion other expenses. These non-operating items netted to $0.4 billion income, leaving pre-tax income at $109.8 billion.
After subtracting $21.7 billion income tax expense (approximately 20% effective rate), Microsoft reached $88.1 billion net income. Dividing by 7.47 billion diluted shares outstanding yields the $11.80 EPS figure that analysts and investors scrutinize each quarter.
Breaking Down Microsoft's Financial Performance
Microsoft's income statement reveals several performance strengths. The 73% gross margin indicates pricing power and operational efficiency in a software-dominated business model. Physical product manufacturers typically achieve 30-50% gross margins, making Microsoft's figure exceptional.
The $109.4 billion operating income demonstrates that Microsoft's core business operations generate massive profits before financing considerations. Even companies with similar revenue might show far lower operating income due to higher cost structures or operational inefficiencies. This metric confirms Microsoft's competitive advantages in cloud computing, software licensing, and enterprise services.
The minimal gap between operating income ($109.4B) and net income ($88.1B) shows relatively light non-operating impacts. Microsoft carries modest debt relative to its size, keeping interest expense minimal. The company's effective tax rate around 20% reflects global tax planning and deferred tax benefits from prior investments.
Earnings per share of $11.80 enables comparison to other technology companies regardless of total company size. Investors can compare Microsoft's EPS growth rate to Apple, Google, or smaller competitors. Combined with stock price, this metric generates the price-to-earnings ratio that drives valuation analysis.
Analyzing Microsoft's income statement across multiple years reveals growth trends. Comparing current operating margin to prior years shows whether profitability improves or deteriorates. Revenue growth combined with operating leverage (operating income growing faster than revenue) signals business momentum. These trend analyses provide more insight than any single year's snapshot.
Income Statement vs Balance Sheet: Key Differences
Income statements and balance sheets serve complementary but distinct purposes in financial reporting. The income statement reports performance across a time period — quarterly or annually. The balance sheet captures financial position at a specific moment — typically the last day of the accounting period.
Think of the income statement as a video showing what happened during the reporting period. The balance sheet functions as a photograph taken on the final day. One tracks flows and activities; the other documents status and position. Both documents are essential for comprehensive business analysis but answer fundamentally different questions.
The income statement asks "How did we perform?" by tracking revenues earned and expenses incurred during the period. The balance sheet asks "What do we own and owe?" by listing assets (resources controlled) and liabilities (obligations owed) on a specific date. Net income from the income statement becomes a component of retained earnings on the balance sheet, connecting the two documents.
Balance sheets follow the accounting equation: Assets = Liabilities + Equity. Assets include cash, inventory, equipment, and accounts receivable. Liabilities encompass loans, accounts payable, and accrued expenses. Equity represents owner investment plus accumulated retained earnings. This equation always balances — hence the document name.
| Aspect |
Income Statement |
Balance Sheet |
| Time Frame |
Period of time (quarter, year) |
Specific point in time (date) |
| Purpose |
Shows financial performance |
Shows financial position |
| Question Answered |
"How profitable were we?" |
"What do we own and owe?" |
| Key Components |
Revenue, expenses, net income |
Assets, liabilities, equity |
| Focus |
Operating results and profitability |
Resources and obligations |
| Metaphor |
Video of performance |
Snapshot of position |
| Primary Users |
Investors evaluating profitability |
Creditors assessing solvency |
Companies with strong income statements showing consistent profits might still face balance sheet problems. A profitable business with excessive debt and minimal cash could struggle paying obligations despite positive net income. Conversely, asset-rich companies with weak income statements might survive temporarily but need operational improvements for long-term viability.
Investors analyze both documents together. Income statement profitability combined with balance sheet leverage ratios (debt divided by equity) reveals complete financial health. Strong profitability enables debt service; reasonable leverage magnifies returns without excessive risk. Both documents working together provide insights neither offers alone.
Who Uses Income Statements and Why
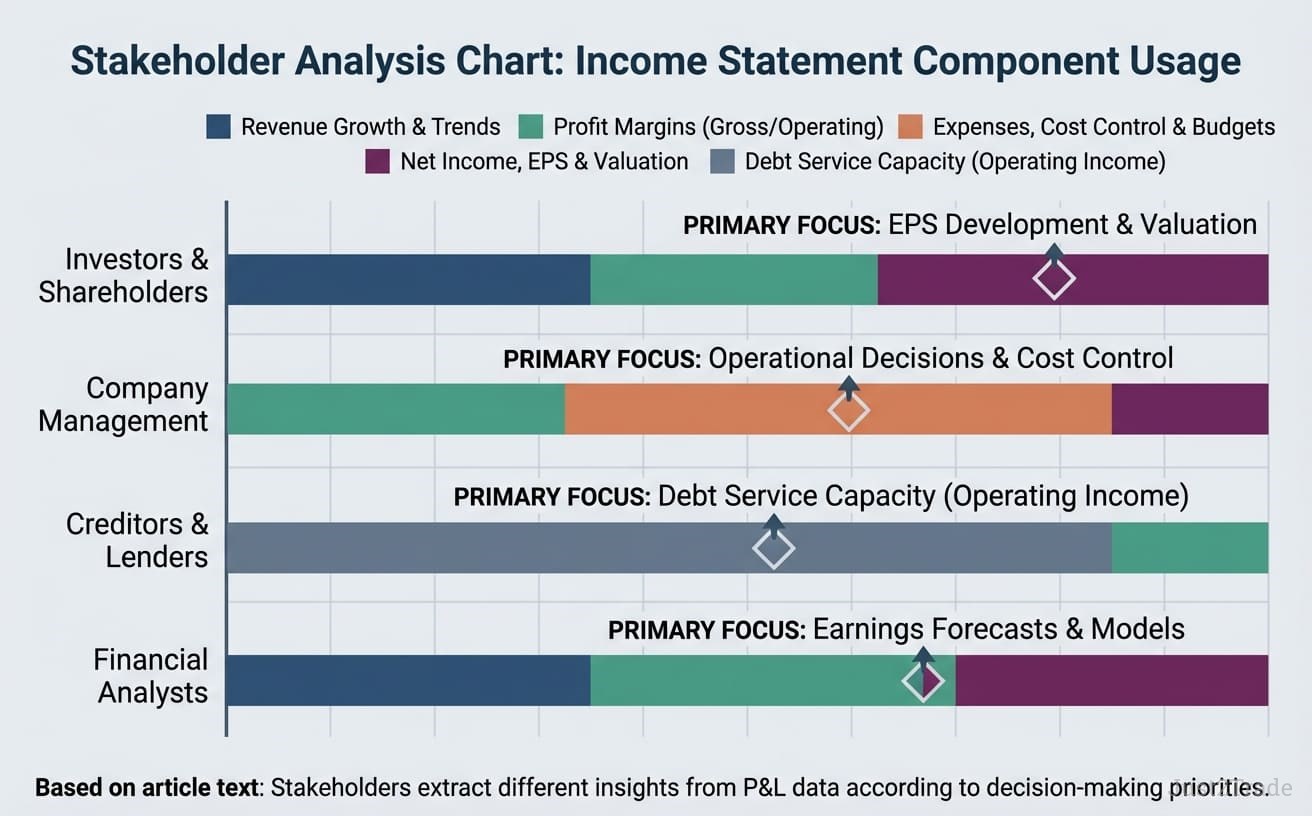
Key stakeholder groups and their analytical focus:
- Investors and shareholders — Company valuation, revenue growth trends, profit margin expansion, EPS development, stock price reactions to earnings announcements
- Company management — Operational decisions, product/service profitability, cost control, budget variance analysis, strategic planning
- Creditors and lenders — Operating income assessment for debt service capacity, credit rating analysis, loan approval decisions
- Financial analysts — Earnings forecasts, stock valuation models, buy/sell recommendations, industry competitive positioning
- Tax authorities — Tax return preparation starting point, income verification, expense deduction support
- Competitors — Performance benchmarking, supplier relationship analysis, innovation investment levels, competitive intelligence
Each group extracts different insights from the same data based on their specific decision-making priorities.
Management Decision-Making Applications
Key management uses:
- Product line analysis — Identifying which offerings generate highest margins, reallocating resources accordingly
- Cost control — Investigating rising expense ratios, evaluating marketing campaign effectiveness, reviewing departmental budgets
- Pricing strategy — Adjusting prices based on margin trends, renegotiating supplier contracts
- Strategic planning — Multi-year revenue projections, capital allocation decisions, acquisition targets
- Performance incentives — Sales bonuses tied to revenue, operations bonuses for profit targets, executive compensation linked to EPS growth
Advanced Income Statement Analysis Techniques
Professional analysis methods:
- Trend analysis — Year-over-year growth rates for revenue, gross profit, operating income, and net income; five-year patterns revealing momentum or deceleration
- Common-size analysis — Converting dollar amounts to percentages of revenue for size-neutral comparisons; highlighting expense structure changes
- Ratio analysis — Gross margin, operating margin, net profit margin, return on sales (ROS), EBITDA margins
- Comparative analysis — Benchmarking against industry peers and competitors; applying industry-specific metrics
- Segment analysis — Multi-divisional performance by business unit, geographic region, or product category
These techniques may provide additional context for assessing business performance and competitive positioning beyond basic income statement reading.
Statement of Comprehensive Income: Extended Reporting
The statement of comprehensive income extends traditional income statement reporting by including items that bypass net income calculation. GAAP standards require this expanded statement format to capture complete performance measurement beyond conventional profit and loss.
Comprehensive income equals net income plus "other comprehensive income" (OCI) — gains and losses excluded from the traditional income statement. These OCI items include foreign currency translation adjustments, unrealized gains/losses on certain investments, pension plan adjustments, and derivatives used for hedging. Companies report these in a separate statement or combined single statement of comprehensive income.
Foreign currency translation adjustments arise when multinational corporations consolidate international subsidiaries. A U.S. parent company with European operations must convert euro-denominated results to dollars. Exchange rate fluctuations create translation gains or losses that don't reflect operating performance but impact total comprehensive income.
Unrealized investment gains and losses affect comprehensive income when companies hold securities classified as "available for sale." Stock portfolio value increases before actual sale generate unrealized gains that appear in OCI but not net income. Upon eventual sale, these gains "recycle" from OCI into net income. This accounting treatment prevents volatility from marketable securities fluctuations from distorting operational results.
The comprehensive income statement provides a complete picture of all changes in equity except owner transactions (investments or distributions). Some analysts argue comprehensive income better represents true economic performance than traditional net income. Others contend that including unrealized gains and losses creates misleading volatility. Both perspectives have merit depending on analysis objectives.
Common Income Statement Analysis Mistakes to Avoid
Critical errors to prevent:
- Confusing revenue with cash flow — Accrual accounting records revenue when earned, not when cash arrives; always analyze cash flow statements alongside income statements
- Ignoring one-time items — Asset sales, litigation settlements, restructuring charges distort performance; "normalize" earnings by removing non-recurring items
- Overlooking accounting policy changes — Depreciation method changes or revenue recognition timing shifts impact reported earnings without changing economics
- Missing expense reclassifications — Costs shifted between categories can artificially improve margins; verify consistent classification across periods
- Overemphasizing single quarters — Seasonal businesses show normal quarterly fluctuations; always compare identical periods year-over-year
- Neglecting industry context — 5% net margin indicates excellent performance for grocers (typical 1-3%) but poor performance for software companies (typical 15-30%)
Conclusion: Using Income Statements for Better Business Understanding
Income statements systematically track revenues earned and expenses incurred during reporting periods, answering the fundamental question: Did the business make money? Whether using single-step formats for simplicity or multi-step formats for detailed analysis, these documents provide essential performance measurement.
Effective analysis requires understanding core components (revenue, expenses, profitability levels), format differences, and regulatory requirements. Multiple stakeholder groups—investors, management, creditors, analysts—extract different insights based on their decision-making priorities.
Advanced techniques like trend analysis, ratio calculations, and peer comparisons generate deeper insights. Understanding relationships between income statements and other financial documents (balance sheets, cash flow statements) creates complete financial pictures.
Developing income statement literacy can support more informed financial decision-making across a range of business contexts. Whether tracking monthly performance, evaluating investments, or making operational decisions, income statement comprehension can contribute to better-informed choices across various business contexts.
FAQ
-
Can income statements show losses instead of profits?
Yes, income statements show losses when total expenses exceed total revenues, appearing as negative numbers or in parentheses. Startup companies and businesses undergoing restructuring commonly report losses for extended periods while building operations or transforming business models.
-
How do seasonal businesses handle income statement reporting?
Seasonal businesses prepare quarterly statements but emphasize year-over-year comparisons of matching quarters rather than sequential quarters to account for natural fluctuations. A beach resort, for example, always compares Q2 performance to the prior year's Q2, not to the previous Q1 or Q3.
-
What's the difference between gross profit and operating profit?
Gross profit equals revenue minus cost of goods sold, showing product-level profitability. Operating profit subtracts additional operating expenses (salaries, rent, marketing) from gross profit, revealing overall operational efficiency including administrative costs.
-
Do private companies need to prepare income statements?
Private companies aren't required to file with the SEC but typically prepare income statements for banks (loan applications), investors, tax preparation, and internal management decisions. The fundamental value of income statement analysis applies equally to businesses of all sizes and ownership structures.
-
How do you handle one-time items in income statement analysis?
Analysts "normalize" earnings by removing non-recurring items like asset sales, litigation settlements, or restructuring charges to assess sustainable profitability. Investors should examine both GAAP earnings (including everything) and adjusted earnings (excluding special items) for complete understanding.
-
How do income statements relate to tax returns?
Income statements provide starting points for tax return preparation, but GAAP financial accounting differs from tax accounting in depreciation methods, timing rules, and allowed deductions. Companies maintain separate books for financial reporting versus tax reporting, reconciling differences on Schedule M-1.
-
What are the most important ratios to calculate from income statements?
Five key ratios provide comprehensive analysis: Gross Margin (product profitability), Operating Margin (operational efficiency), Net Profit Margin (overall profitability), Return on Sales (core business returns), and EBITDA Margin (cash generation). Compare these ratios to prior periods and industry averages for meaningful insights.