Copper Price Forecast 2026 to 2030
)
Table of Contents
Where Copper Prices Stand Today: Setting the Scene for the Forecast
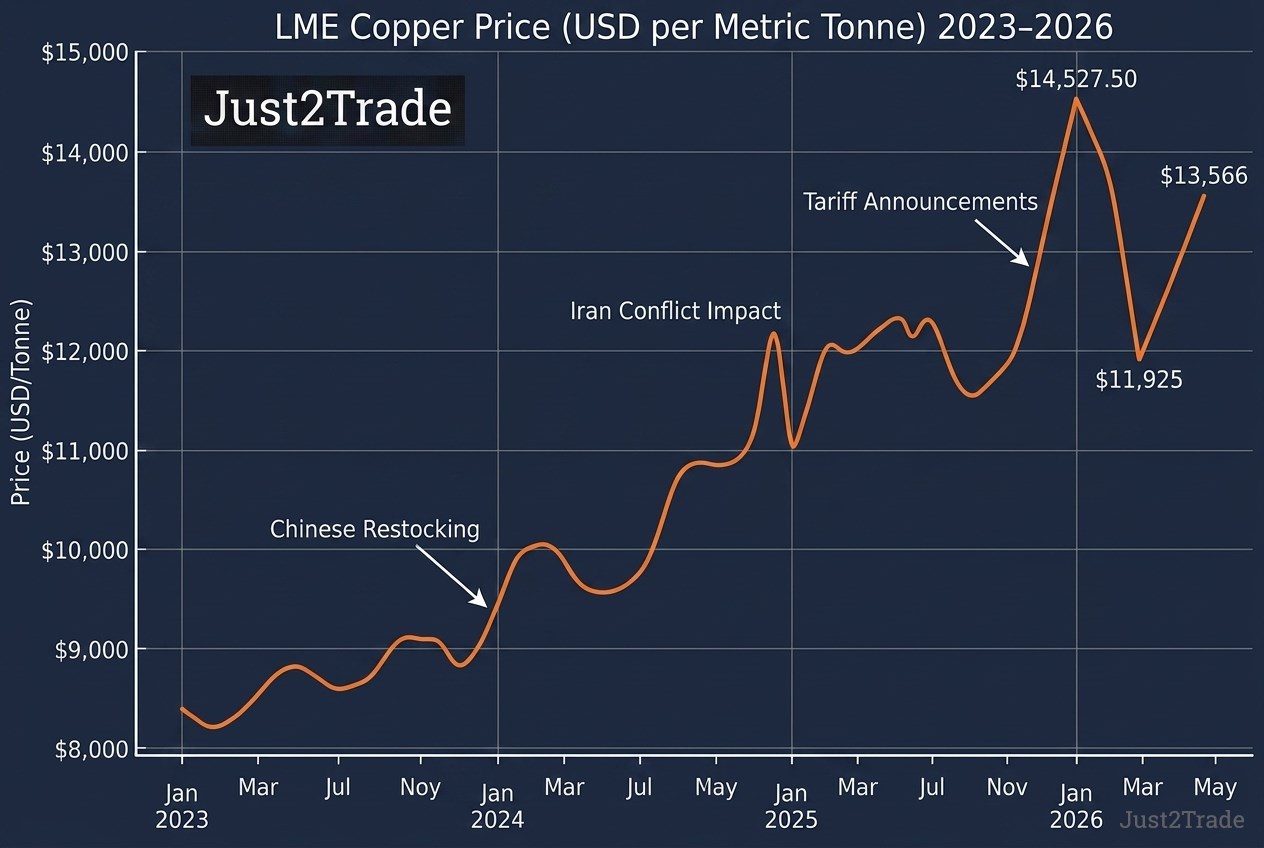
Copper traded at approximately $13,566 per metric tonne ($6.15 per pound) on the London Metal Exchange on May 26, 2026, according to MacroMicro LME data. Trading Economics reported copper at 6.29 USD per pound on May 27, 2026, reflecting a 35.04% year-over-year increase.
Copper is an industrial base metal used in electrical wiring, construction, and power infrastructure. Financial analysts call copper "Dr. Copper" because copper price movements reflect economic growth across multiple industrial sectors simultaneously. J.P. Morgan's commodities research division uses copper as a leading indicator of construction, white goods, and electric vehicle manufacturing activity.
LME copper three-month forwards hit a record high of $14,527.50 per metric tonne in January 2026, according to Barchart market analysis. COMEX copper futures peaked at $6.58 per pound that month. Copper pulled back to approximately $11,925 per metric tonne on March 20 before recovering above $13,000.
Supply and demand fundamentals drive copper pricing more than any other single factor. Codelco, the world's largest copper producer, carries approximately $24 billion in debt while managing stagnant output. Oil price volatility, tracked through Brent Crude benchmarks, influences copper extraction costs. Investors tracking oil price movements and their macro effects will recognise the energy-copper correlation. Global refined copper demand reached approximately 27 million tonnes in 2024, according to the International Energy Agency.
)
Copper Price Forecast 2026: What Top Analysts Expect
Based on current supply-demand fundamentals, copper is expected to trade in the range of $9,800 to $12,500 per metric tonne through 2026. J.P. Morgan forecasts copper at $12,500 per metric tonne for Q2 2026, averaging $12,075 per metric tonne for the full year. Trading Economics projects copper at 6.35 USD per pound by the end of the current quarter and 7.04 USD per pound (approximately $15,500 per metric tonne) within 12 months.
S&P Global Market Intelligence published a 2026 average at $12,100 per tonne in April 2026. The World Bank projects approximately $9,800 per tonne. Institutional analysts project a refined copper deficit of approximately 330,000 metric tonnes in 2026. Codelco's stagnant production trajectory (2023 output reached only 72% of 2004 levels) directly contributes to the deficit thesis.
- Institutional forecasts project a refined copper deficit of 330,000 metric tonnes for 2026
- Supply outages of approximately 800,000 tonnes per year in 2025 and 2026 shifted the market from surplus into deficit
- Chinese buyers represent approximately 60% of global copper demand and actively dip-buy at lower price levels
- Codelco's $24 billion debt load and declining ore grades constrain the supply-side response
Copper Price Forecast 2026: Bullish vs. Bearish Scenarios
The Bullish Case
- Chinese fiscal stimulus success accelerates industrial copper consumption beyond baseline forecasts
- Continued mine supply disruptions at Grasberg (Indonesia) and Codelco (Chile) tighten available inventories
- Accelerated electric vehicle adoption increases per-unit copper demand globally
- A weakening U.S. dollar supports commodity prices denominated in USD
- Geopolitical de-escalation (Strait of Hormuz reopening) removes energy-cost headwinds
The Bearish Case
- Global recession risk triggers demand destruction across construction sectors
- Energy price spikes from the Iran conflict reduce economic growth by up to 1.4 percentage points if Brent Crude hovers near $110 per barrel
- Section 232 tariff escalation disrupts COMEX-LME pricing and trade flows
- Chinese property sector contraction reduces the approximately 30% of copper demand tied to construction
- Copper has historically troughed approximately 25% below peak during major macroeconomic shocks
Copper Price Forecast End of 2026: Best Estimate
The base case estimate for LME copper at end-2026 falls between $12,000 and $13,500 per metric tonne. J.P. Morgan's commodities research identifies a medium-term support zone at $11,100 to $11,200 per metric tonne as the downside anchor. Trading Economics' 12-month model projection of 7.04 USD per pound (approximately $15,500 per metric tonne) provides the upside reference.
Three assumptions underpin the estimate: Chinese demand stays near 60% of global consumption, no global recession materialises, and the supply deficit persists above 200,000 metric tonnes. A sustained Chinese PMI below 48.0 would trigger a downward revision of the copper rate prediction.
What Drives Copper Prices? The Forces Every Investor Must Understand
Copper price forecasting requires understanding four structural forces: green energy demand, supply constraints, China's consumption dominance, and geopolitical wildcards. Supply and demand dynamics determine copper pricing more reliably than short-term market trend signals. Economic growth acts as the macro connective tissue linking all four forces to copper demand. Demand acceleration from the energy transition is the single largest structural shift in the copper market since the 2000s China super-cycle.
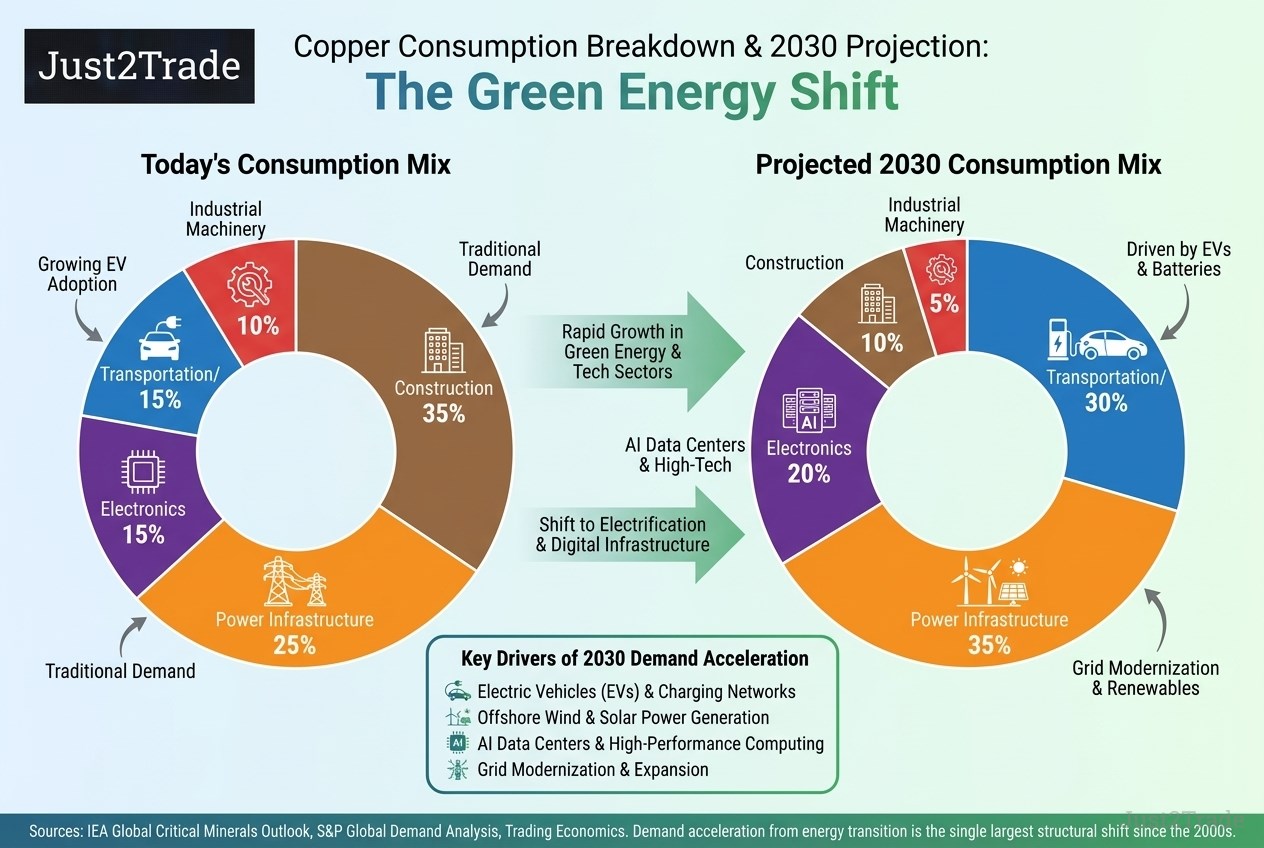
Global Copper Demand Forecast: The Green Energy Revolution
Electric vehicles require approximately 83 kg of copper per unit, compared to 23 kg in a conventional car, according to S&P Global's demand analysis. Offshore wind turbines consume 4 to 15 metric tonnes of copper each. AI data centres require 20 to 40 tonnes of copper per megawatt of capacity.
The International Energy Agency projects copper demand growing from 27 million tonnes (2024) to 37 million tonnes by 2050, according to its Global Critical Minerals Outlook. AI data centres alone could consume 250,000 to 550,000 tonnes annually by 2030. Trading Economics noted that AI tech stock gains in 2026 reinforced electrification demand expectations. The simultaneity of multiple demand drivers (EVs, wind, solar, AI, grid modernisation) distinguishes the current market trend from prior commodity cycles. Economic growth in emerging markets compounds the structural demand pressure.
)
Supply-Side Constraints: Why New Copper Is So Hard to Find
Copper extraction requires 10 to 17 years from discovery to production, according to IEA research. Copper ore grades have declined 40% since 1991. Only 14 new deposits were discovered in the past decade, compared to 225 in the preceding 23 years.
Codelco carries approximately $24 billion in debt with $5 billion in annual capital expenditure, according to MINING.COM. Codelco's El Teniente mine output dropped 13% to 310,100 tonnes. Quebrada Blanca (Chile) faces Phase 2 ramp-up challenges. Mining development cost reached approximately $27,000 per tonne of annual capacity, a 30% increase from 2020. Chile and Peru produce approximately 40% of global copper supply. China's sulfuric acid export suspension impacts heap-leach copper extraction globally.
China's Role: Understanding the World's Dominant Copper Consumer
Chinese buyers represent approximately 60% of global copper demand, according to institutional commodities research. Chinese industrial activity accelerated after Lunar New Year 2026. Strong Chinese dip-buying behaviour kept copper prices stable despite Iran conflict tensions.
Chinese PMI data releases function as a leading copper demand indicator. A PMI reading above 50 signals manufacturing expansion. The property sector accounts for approximately 30% of Chinese copper use, creating vulnerability if construction investment contracts. Post-Lunar New Year 2026 data showed accelerating industrial activity and inventory replenishment. Economic growth in China remains the single most important variable for copper rate prediction, as other commodity markets like coal also demonstrate heavy dependence on Chinese industrial cycles.
Geopolitical and Macroeconomic Wildcards: The Variables That Override Fundamentals
U.S. Section 232 tariffs on semi-finished copper products took effect from August 2025, according to Codelco's corporate presentation. J.P. Morgan's quantitative framework estimates that a 10% Brent Crude oil price rise produces a 0.16% GDP reduction and a corresponding copper demand growth decrease.
| Oil Price Rise (Brent Crude) |
Estimated GDP Impact |
Copper Demand Growth Reduction |
| +5% |
-0.08% |
-0.10% |
| +10% |
-0.16% |
-0.19% |
| +15% |
-0.24% |
-0.29% |
| +20% |
-0.32% |
-0.38% |
Source: J.P. Morgan commodities research, based on a baseline of approximately $60/bbl for Brent Crude. Adapted from S&P Global, April 2026.
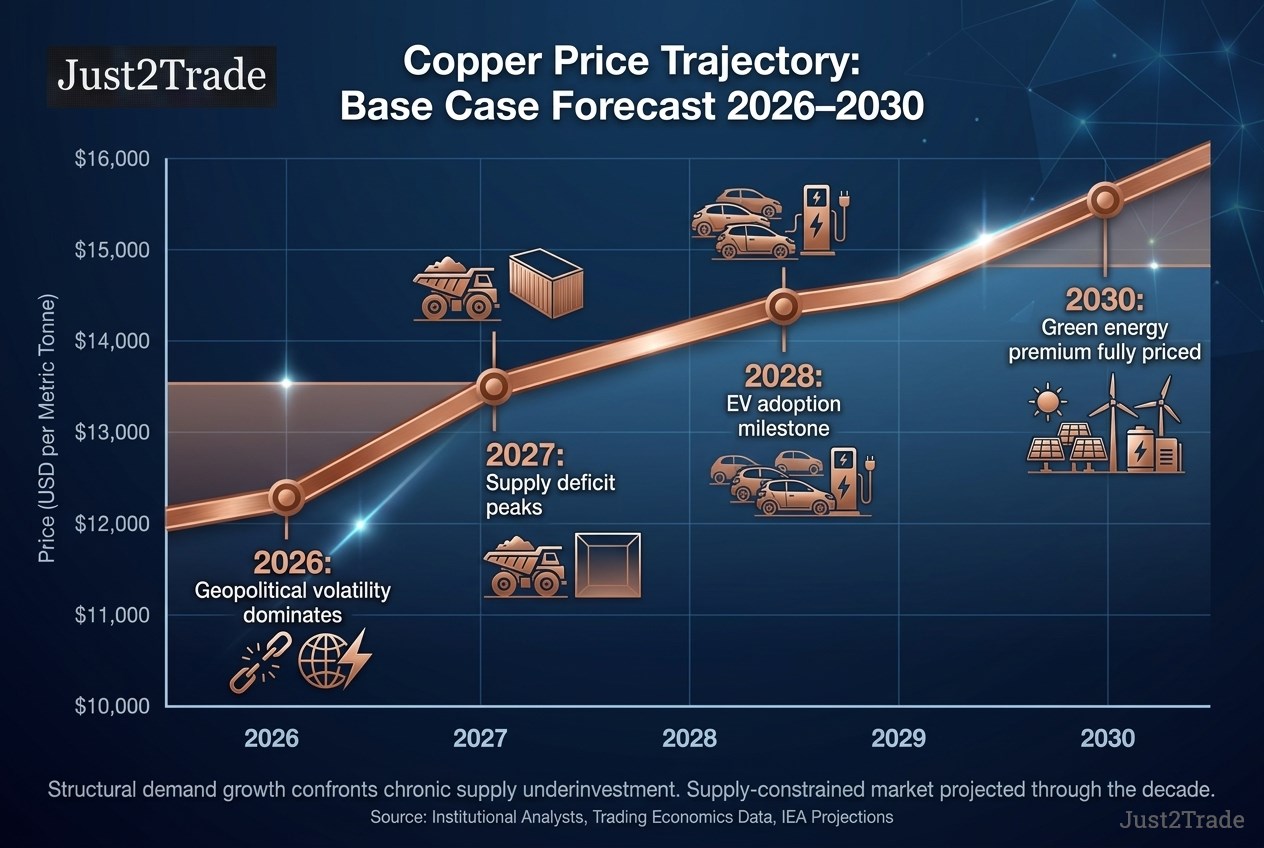
Copper Price Forecast 2026 to 2030: Year-by-Year Summary
The copper price forecast unfolds as a three-act narrative. Act 1 (2026): macro volatility, tariff uncertainty, Chinese demand. Act 2 (2027 to 2028): supply deficit becomes structural. Act 3 (2029 to 2030): green energy premium fully priced in.
J.P. Morgan raised the long-term copper forecast to $12,000 per tonne over the next decade, with a medium-term support zone at $11,100 to $11,200 per metric tonne, according to The Northern Miner, February 2026.
Trading Economics' 12-month model of 7.04 USD per pound anchors the near-term upside. Codelco's stagnant production and thin new mine pipelines compound the 2027 to 2028 deficit. Economic growth determines which scenario materialises.
| Year |
Bear Case ($/mt) |
Base Case ($/mt) |
Bull Case ($/mt) |
Key Driver |
| 2026 |
9,800 |
12,075 |
14,500 |
Tariff and geopolitical volatility |
| 2027 |
11,000 |
13,500 |
16,000 |
Supply deficit intensifies |
| 2028 |
12,000 |
14,500 |
17,500 |
Mine pipeline depletion |
| 2029 |
12,500 |
15,000 |
18,000 |
EV adoption milestone |
| 2030 |
13,000 |
15,500 |
19,000 |
Green energy premium priced |
Sources: S&P Global, Trading Economics, The Northern Miner
Copper Price Forecast 2027 and 2028: The Critical Medium-Term Window
The 2027 to 2028 window represents a distinct structural phase where the supply deficit becomes acute. Copper extraction and mining development require 10 to 17 years, preventing rapid supply response. The ICSG projects a copper deficit of 150,000 metric tonnes for 2026, widening through 2028, according to Investing News Network.
S&P Global projects mine output peaking in 2030 at 27 million metric tonnes, declining to 22 million by 2040. J.P. Morgan calculates that new projects need copper above $12,000 per tonne to achieve a 15% internal rate of return. Codelco's stagnant output compounds the supply gap. The market trend favours structurally higher copper prices absent a major Chinese economic growth slowdown.
Copper Price Prediction 2030: The Long-Term Structural Case
The IEA projects a 30% primary copper supply shortfall by 2035, according to its Global Critical Minerals Outlook. J.P. Morgan forecasts a long-term copper average of $12,000 per tonne. Trading Economics' 12-month model of 7.04 USD per pound serves as a near-term stepping stone.
- Aluminium substitution in wiring could reduce per-unit copper extraction requirements by 5 to 15%
- Copper recycling may reduce primary mining needs by approximately 10% by 2040 (IEA estimate)
- Structural Chinese demand disappointment would undermine the long-term market trend bull case
The base case 2030 target: $14,500 to $16,000 per metric tonne.
Copper Price Prediction 2040: The Ultra-Long-Term Outlook
Copper price prediction for 2040 remains speculative. Two scenarios frame the long-term supply and demand outlook and market trend.
Scenario 1: "Peak demand." Electrification efficiency reduces per-unit copper intensity. Battery improvements and aluminium adoption cap prices as demand growth slows and copper extraction matures.
Scenario 2: "Super-cycle continuation." Cumulative underinvestment in mining creates a decade-long structural deficit. Previous commodity super-cycles (oil in the 1970s, metals in the 2000s) self-corrected through demand destruction and supply innovation.
Copper Futures Price Prediction: What the Forward Market Tells Us
Copper futures are financial contracts for future delivery of copper at a specified price, traded as a contract for difference (CFD) on platforms like Trading Economics or through direct exchange access via futures trading platforms. The forward market operates as both a price discovery mechanism and a market trend sentiment indicator.
Contango (futures above spot) signals adequate near-term supply. Backwardation (spot above futures) signals physical tightness. The COMEX premium over LME widened during Q1 2026 from Section 232 tariff uncertainty. Currency strength (particularly the U.S. dollar) amplifies COMEX-LME dislocations. The futures curve functions better as a sentiment gauge than a precise copper price future forecast tool.
Copper Price Forecast for Next Week: Short-Term Technical Signals
Short-term copper prediction carries inherent uncertainty. Technical analysis provides a framework, not a guarantee.
| Technical Level |
Reference Value |
Signal |
| 50-Day SMA |
~$6.15/lb (COMEX) |
Bullish (price above) |
| 200-Day SMA |
~$5.80/lb (COMEX) |
Bullish (price above) |
| 14-Day RSI |
~68 to 70 |
Near overbought, no divergence |
| Key Support |
$11,100 to $11,200/mt (LME) |
Medium-term floor |
| Key Resistance |
$14,527/mt (LME Jan 2026 high) |
All-time high resistance |
Sources: Trading Economics
Three macro catalysts: Chinese PMI releases, U.S. Federal Reserve policy communications, LME weekly inventory reports.
Copper Shortage Forecast 2026: Are We Approaching a Supply Crisis?
A commodity shortage means sustained inventory below threshold levels, consistent backwardation, and physical rationing. The 2026 copper market does not meet all three criteria simultaneously.
Institutional analysis reveals the U.S. holds ample reserves from tariff front-running. Visible global inventories exceeded 1.3 million tonnes in March 2026, adding near-term pressure without resolving structural tightness. Grasberg (Indonesia) force majeure, Quebrada Blanca (Chile) operational challenges, Codelco's rising production cost and $24 billion debt, and China's sulfuric acid export suspension intensify the medium-term shortage risk. Demand growth from EVs and grid modernisation compounds the supply-side constraint, pushing the copper price outlook for 2026 higher.
Investment Implications: Is Copper a Buy Right Now?
Copper investment decisions depend on time horizon. Technical analysis of support and resistance levels frames the short-term picture. Economic growth trajectory determines medium and long-term outcomes.
| Investor Type |
Time Horizon |
Positioning |
Key Risk |
Suggested Vehicles |
| Short-term trader |
1 to 3 months |
Support at $11,100/mt; resistance at $14,527/mt |
Tariff volatility |
LME/COMEX futures |
| Medium-term investor |
1 to 3 years |
Supply deficit thesis strengthens |
Chinese slowdown |
Copper-focused ETFs |
| Long-term strategic |
5+ years |
Energy transition demand |
Aluminium substitution |
Diversified base metals producers |
Source: S&P Global, Trading Economics
Disclaimer: The information above does not constitute investment advice. Consult a qualified financial advisor before making investment decisions.
Final Verdict: Expert Copper Price Outlook
The copper price forecast for 2026 through 2030 reflects a market where structural demand growth confronts chronic supply underinvestment. J.P. Morgan and Trading Economics both project a supply-constrained market through the decade.
The single most mispriced factor: downside macroeconomic risk from the Iran conflict's cascading effects on energy costs and copper demand. Codelco's operational challenges limit the supply-side response.
Base case copper price ranges: end-2026 at $12,000 to $13,500 per metric tonne; end-2030 at $14,500 to $16,000 per metric tonne. The IEA's projected 30% supply shortfall by 2035 reinforces the structural bull case. Trading Economics' 12-month model of 7.04 USD per pound provides a near-term marker for the copper future prediction trajectory. A sustained Chinese PMI below 48.0 for three consecutive months would trigger a fundamental revision. This article will be updated as new analyst forecasts and market data become available.
)
FAQ
-
What is the forecast for copper prices?
J.P. Morgan forecasts a 2026 full-year copper average near $12,075 per metric tonne. Trading Economics projects copper at 6.35 USD per pound by the end of the quarter and 7.04 USD per pound within 12 months. The structural supply deficit of approximately 330,000 tonnes supports elevated pricing through 2030.
-
Is copper predicted to go up or down?
Copper is predicted to trend higher through 2030 based on supply and demand analysis. Supply constraints (declining ore grades, 17-year mine development timelines, Codelco's stagnant output) outpace new mining capacity. Demand acceleration from EVs and grid modernisation reinforces the upward trajectory. A global recession remains the primary downside risk.
-
Are copper prices going to go up in 2026?
Institutional analysts project copper reaching $12,500 per metric tonne in Q2 2026. The January 2026 record high of $14,527 per metric tonne demonstrates strong upside potential. Tariff uncertainty and Iran conflict fallout create near-term volatility. Trading Economics forecasts copper at 6.35 USD per pound by the end of the current quarter.
-
What factors influence the short-term copper price forecast?
Chinese PMI data releases, U.S. Federal Reserve policy signals, LME weekly inventory reports, and Brent Crude oil price movements drive short-term copper volatility. Section 232 tariff developments create additional COMEX-LME price dislocations. A 10% Brent Crude oil price rise strips copper demand growth by approximately 0.19 percentage points.
-
How do supply and demand dynamics impact copper price predictions?
The International Energy Agency projects a 30% copper supply shortfall by 2035. Demand rises from 27 million tonnes in 2024 to 37 million tonnes by 2050. Codelco's stagnant copper extraction output and declining ore grades limit the supply response. New mine development requires 10 to 17 years, preventing rapid supply adjustments to demand growth.
-
How to predict copper prices?
Copper price prediction combines three complementary methods. Fundamental analysis evaluates supply-demand balances, inventory data, and Codelco production reports. Technical analysis tracks support and resistance levels through moving averages and RSI indicators. Macroeconomic modelling links GDP growth, Chinese PMI, and Brent Crude oil prices to copper demand trajectories.
-
How do analysts develop their copper price forecasts?
Major institutional research divisions use econometric models linking copper demand to GDP growth, industrial production, and energy transition investment data. Analysts model mine supply disruptions, capacity pipelines, and treatment charge trends. Trading Economics applies quantitative model projections to generate forward estimates such as 6.35 and 7.04 USD per pound for copper.
-
Which global economic trends are essential for predicting copper prices?
Chinese GDP growth (approximately 55 to 60% of global copper demand), U.S. dollar strength (copper trades inversely to the dollar), global manufacturing PMI, and energy transition investment rates are the four most important macro variables for copper price forecasting. Copper's role as an economic bellwether means price movements often lead broader industrial indicators.
-
What are the long-term predictions for copper prices beyond 2030?
Institutional analysts forecast a long-term copper average of $12,000 per tonne over the next decade. The IEA's net-zero pathway implies demand reaching 37 million tonnes by 2050, far outstripping current mine capacity. Aluminium substitution and improved copper recycling rates are the primary counterarguments to the structural bull case for copper prices.
-
What role do geopolitical events play in copper price forecasts?
Geopolitical events override supply-demand fundamentals in the short term. Section 232 tariffs created COMEX-LME pricing dislocations. The Iran conflict disrupted sulfur supply chains critical to copper smelting operations globally. Institutional analysis shows copper prices historically trough approximately 25% below peak during major macroeconomic shocks, establishing a risk-adjusted forecast band.
Trading on financial markets carries risks. The value of the investments can both increase and decrease and the investors may lose all their investment capital. In case of a leveraged product, the loss may be more than the initial capital invested. Detailed information on risks associated with trading on financial markets can be found in General Terms and Conditions for the Provision of Investment Services.