如何购买波兰和美国的政府债券
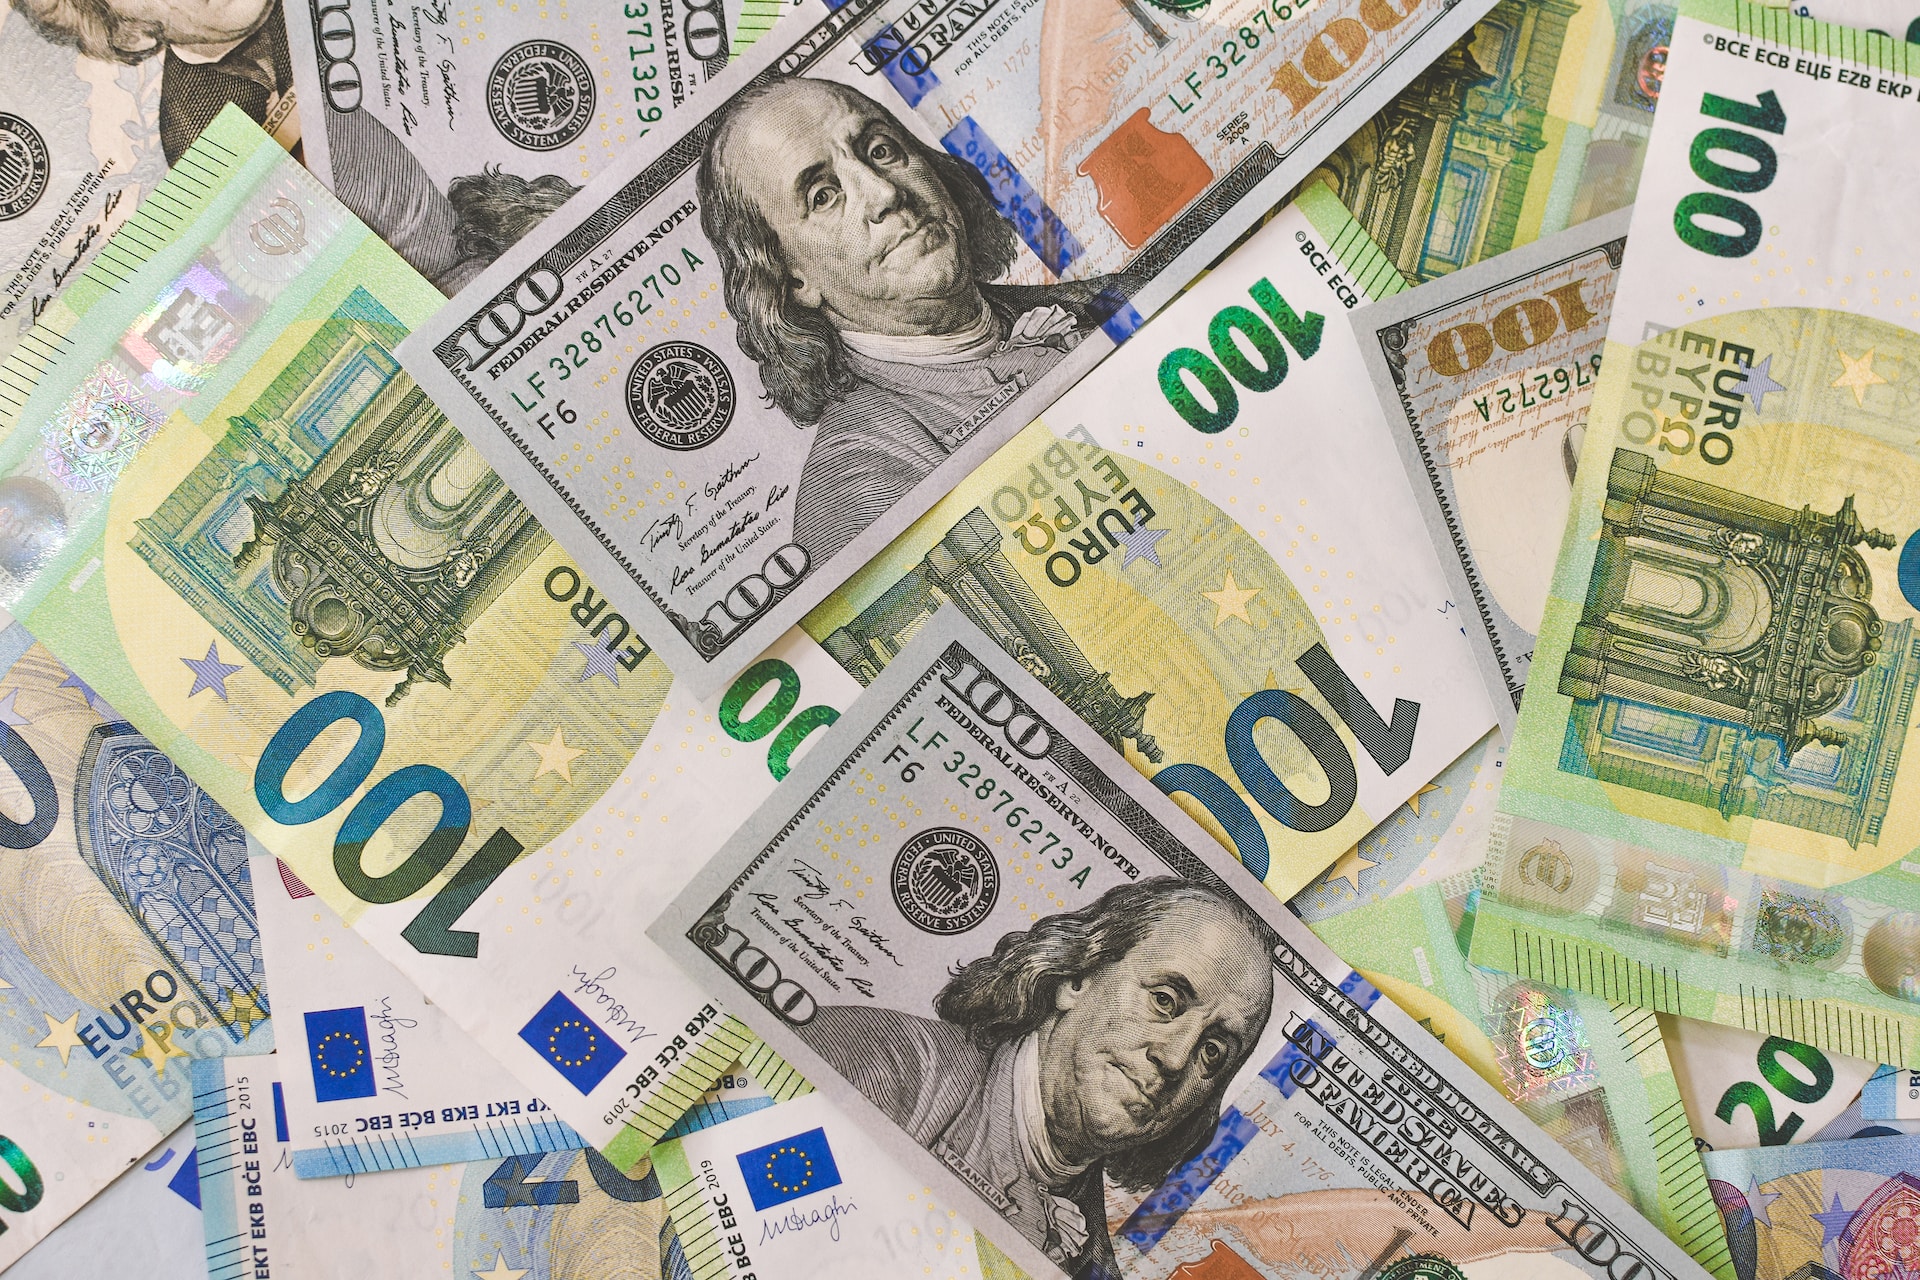
如何购买国债? 投资教育的基石应当是学会如何购买债券。一个多元化的投资组合应始终保持股票与债券之间的平衡,帮助您在市场波动中稳健前行,同时仍能从长期增长中获益。 Just2Trade 已为您准备好所有关键信息,包括2022年国债的购买渠道与方式、购买国债的优势、可能面临的挑战,以及...
30.01.2026 04:29
)
什么是外汇?新手指南
什么是外汇?初学者指南 外汇市场(Forex)是全球贸易和投资的基础。它是一个去中心化的货币交易市场,日均交易量常超过6万亿美元。如此庞大的规模使其成为全球规模最大、最具活力的金融市场。本文将化繁为简,为新手和经验丰富的投资者解析外汇市场的复杂机制。我们将引导您了解外汇交...
27.01.2026 03:06
什么是现金流?
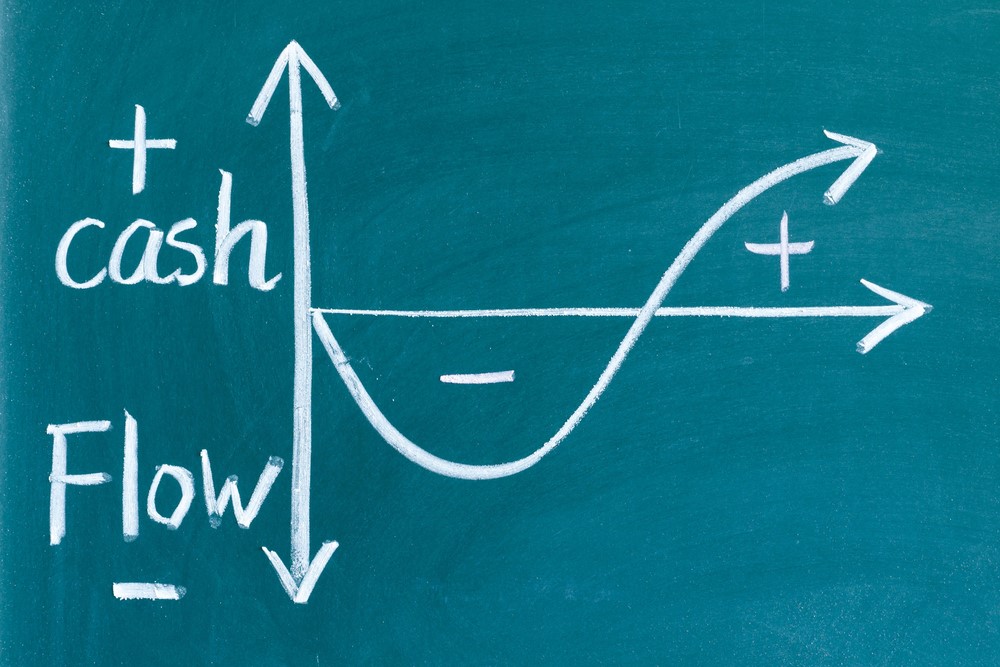
“什么是现金流?” Just2Trade再次为您带来有关现金流的重要知识,包括其分类、计算方法、优化技巧及其重要性等全面解析。让我们一起深入探讨所有关键细节!目录 现金流定义 理解现金流 现金流类型 现金流与利润的区别 如何计算现金流 如何分析现金流 如何预测现金流并编制现...
16.01.2026 02:22
斐波那契回撤位交易
什么是斐波那契回撤水平? 目录: 什么是斐波那契回调水平? 通俗解读斐波那契数列与比率 如何计算斐波那契回撤线 常见的回调水平有哪些? 中度回调 黄金回调 斐波那契回撤水平的应用局限 结论 常见问题解答 如果您涉足股票交易或相关领域,想必听说过斐波那契数列。斐波那契数...
16.01.2026 01:54
艾略特波浪理论——它的定义和运作方式
艾略特波浪理论 目录 什么是艾略特波浪理论? 核心要点 艾略特波浪原理是什么? 艾略特波浪理论的历史背景是什么? 基本序列 如何应用艾略特波浪原理? 如何在技术分析中使用艾略特波浪理论 艾略特波浪理论的优点是什么? 艾略特波浪理论的局限性是什么? 结论 常见问题解答...
16.01.2026 01:29
外汇市场交易时间——什么是交易开盘时间?
外汇市场交易时间 无论您是经验丰富的外汇交易者,还是刚刚计划进入这个金融市场,都必须了解外汇市场的开市与闭市时间。掌握外汇交易时段的运作规律,将有助于您规划交易策略,并充分利用这一高度流动且动态变化的市场。在本文中,我们将概述所有细节,以确保您掌握充分的信息。目录 核心要点 什么...
22.12.2025 02:48
交易中的杠杆是什么?它是如何运作的?
什么是交易中的杠杆?它是如何运作的? 对许多人来说,杠杆交易既充满诱惑又令人望而生畏。该工具有望提高收益,但如果不小心处理,也会带来潜在的灾难。在交易世界中,杠杆不仅仅是一种金融工具,它更关乎心理。你如何运用杠杆,将决定你是走向潜在的利润,还是重大的亏损。 在本文中,我们将探讨杠杆...
22.12.2025 01:40
十字星蜡烛的含义和类型:蜻蜓、墓碑、星星等。
十字星线 在交易者分析市场时,他们依赖于价格图表上形成的模式,而十字星线正是应用最广泛的分析工具之一。反映日内和中期价格变化,它们显示市场犹豫不决或现有趋势可能即将转变。本文将全面解析日本蜡烛图与图表分析:解释蜡烛线的形成原理,演示解读技巧与定价策略制定方法,并通过实例展示各类十字星...
02.10.2025 04:00
通货膨胀是如何运作的?定义、影响、示例
什么是通货膨胀? 通货膨胀是指商品和服务价格总体水平持续上升的经济现象,是衡量经济健康程度的核心指标。尽管这是全球讨论最热议的话题之一,但媒体往往更关注其成因与危害,而非阐释其本质内涵。 本文将深入解析通货膨胀的定义,解释高通胀率和低通胀率是什么,探讨通胀的测量方法,探索其正反两面...
15.08.2025 11:04
欧元兑兹罗提 2025、2026、2027、2028 - 2030 年预测:欧元兑 PLN 预测
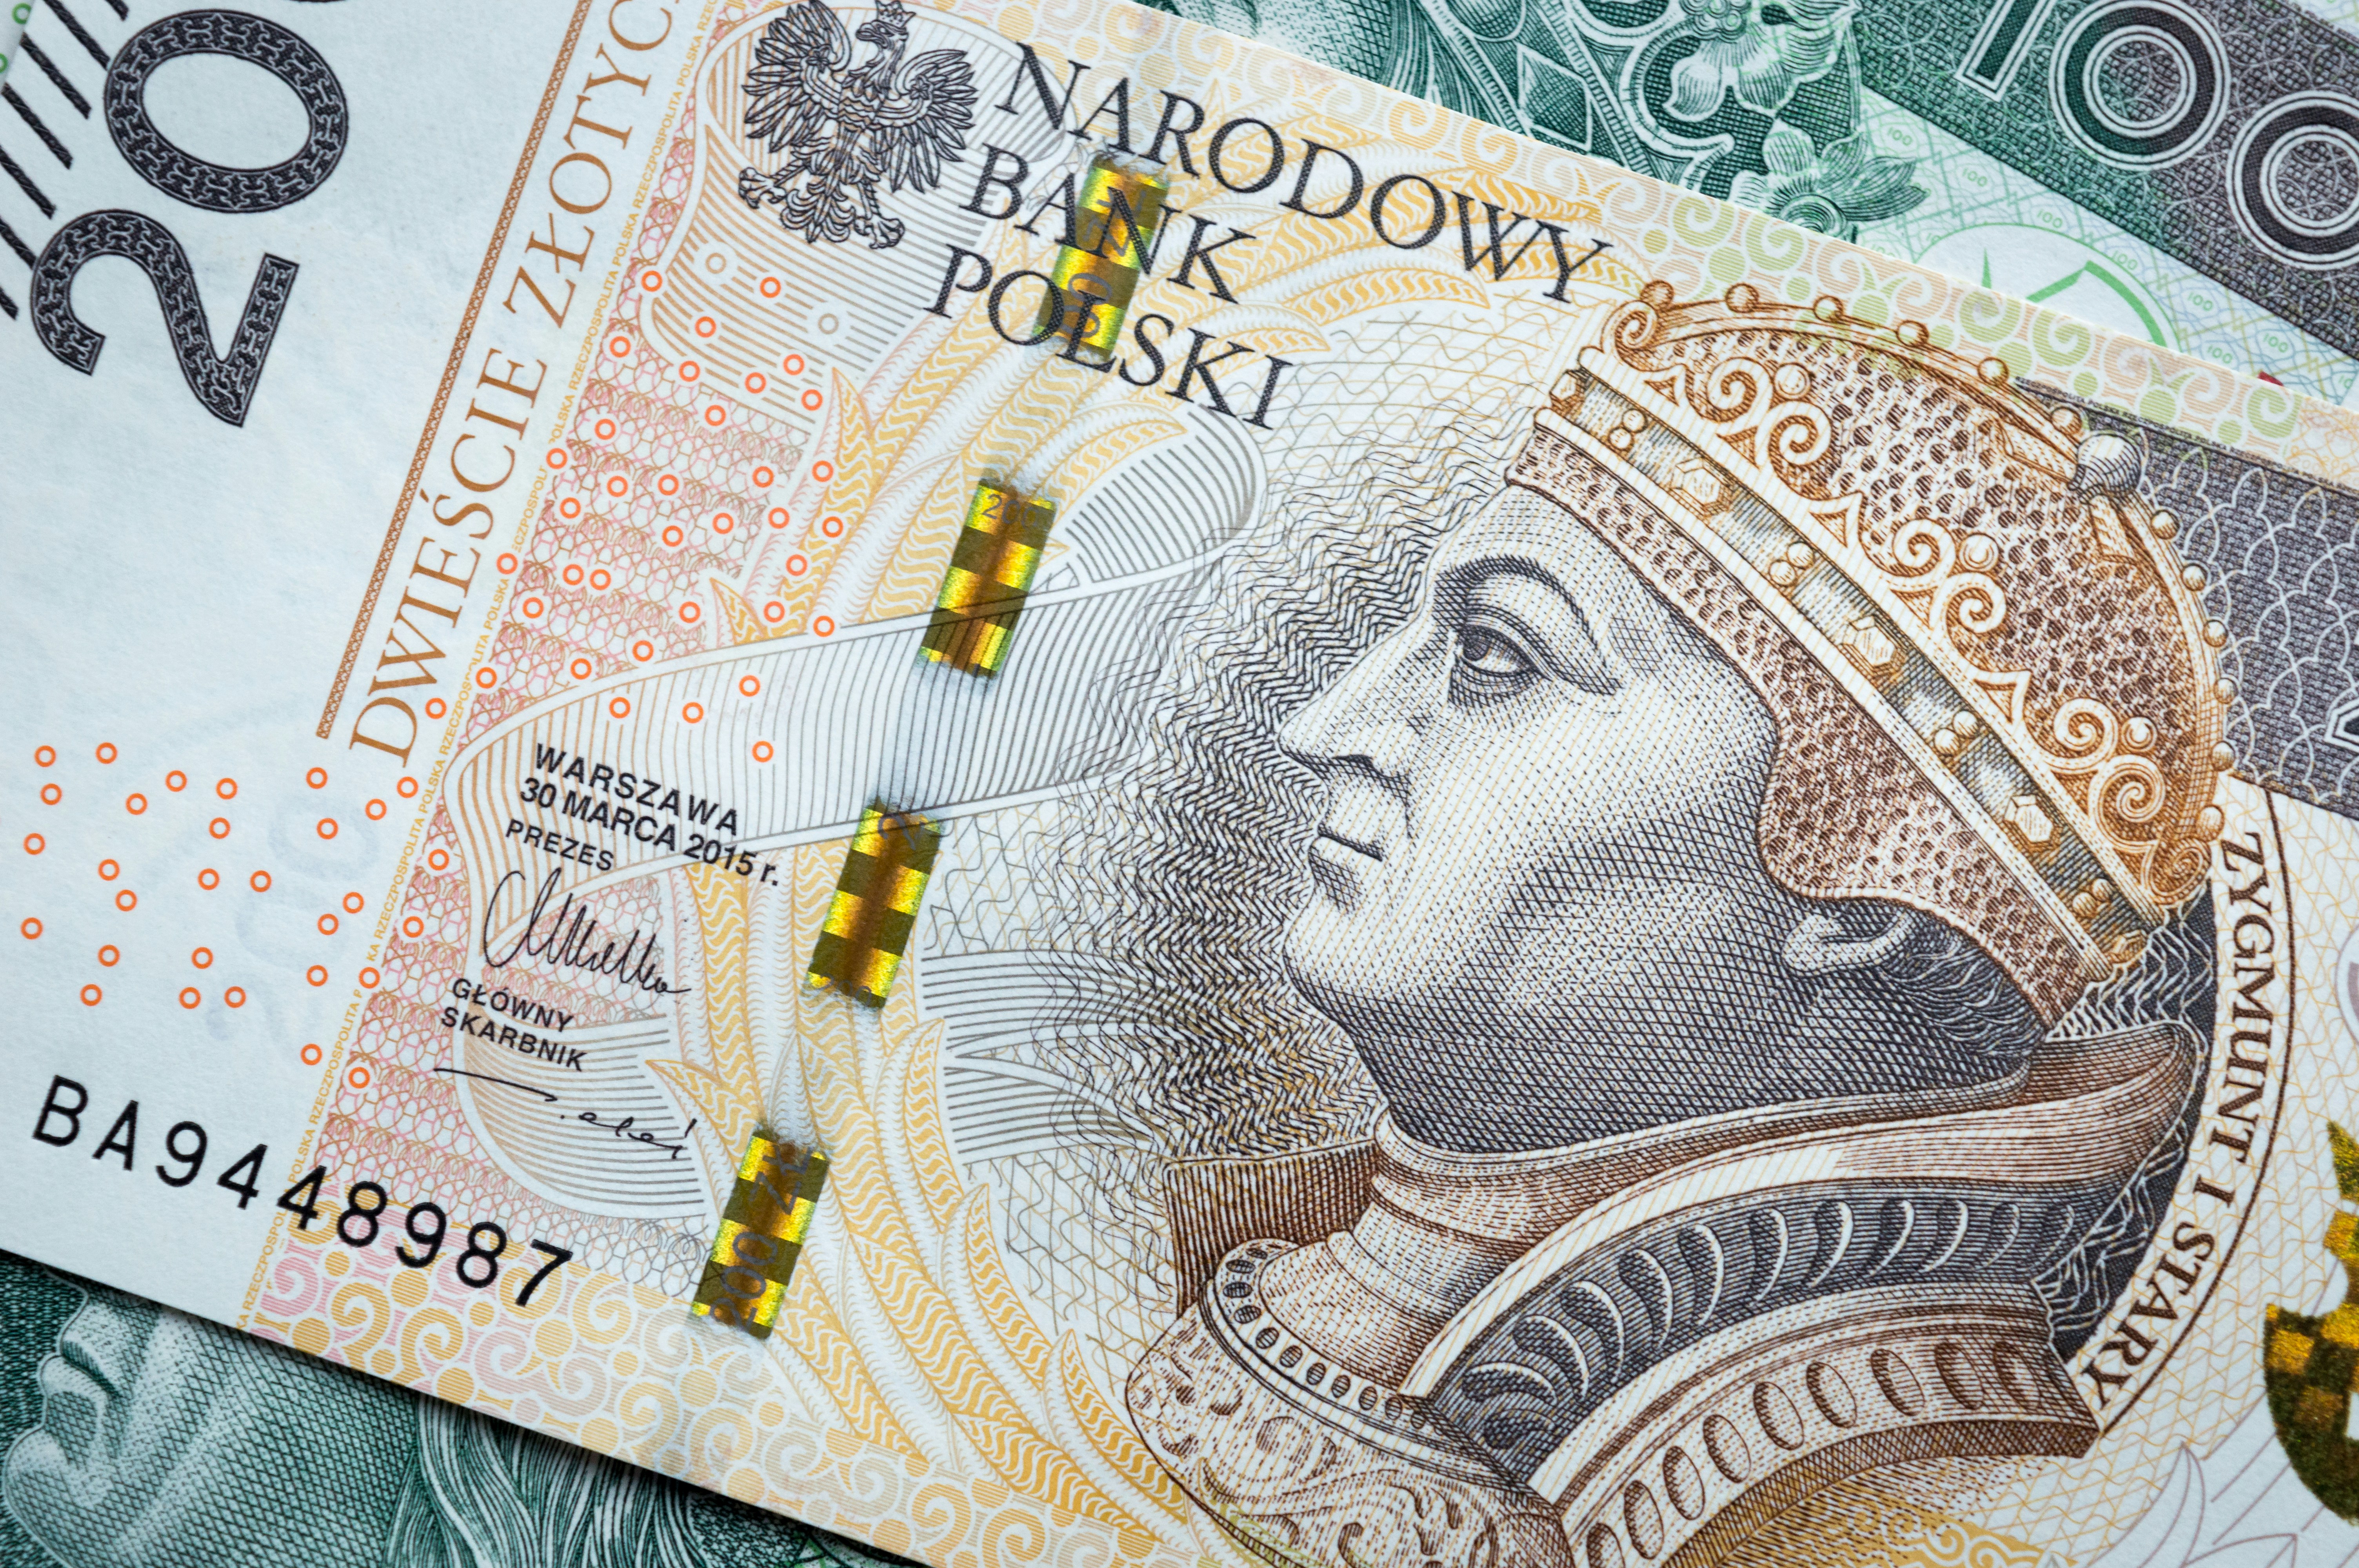
欧元兑兹罗提汇率预测报告(2025-2028年) 准确把握波动剧烈的外汇市场对欧元与兹罗提交易者至关重要,这使得EUR/PLN汇率预测成为不可或缺的分析工具。无论您是交易新手还是经验丰富的投资者,了解兹罗提走势预测都能帮助您洞察欧元兑兹罗提汇率在短期和长期内的可能变动方向。本文将分析...
27.05.2025 03:07
2025、2026、2027-2030 年白银价格预测:5 年、10 年和 20 年预测
白银价格预测 Forecasting the future price of silver is a to 预测白银未来价格是投资者、交易员及爱好者们极为关注的话题。白银在全球经济中占据重要地位,并广泛应用于各行各业,理解其潜在价格走势能为明智决策提供重要见解。本文将深入探讨2...
22.05.2025 01:33
如何在 MT4 和 MT5 中创建外汇机器人
如何在MT4和MT5平台创建外汇交易机器人 目录 引言 核心要点 了解外汇机器人与专家顾问 创建专属外汇机器人 在MetaTrader平台安装外汇机器人 故障排除与维护 打造成功外汇机器人的要诀 现成外汇机器人与交易市场 结语 常见问答引言 在MT4和MT5等Met...
04.05.2025 04:00
)
EBIT 与 EBITDA:定义、公式及计算方法
EBIT与EBITDA:定义与计算公式 EBITDA和EBIT是评估企业盈利能力的两个常用指标,二者全称分别为"息税折旧摊销前利润"和"息税前利润"。顾名思义,这两项指标具有高度关联性。EBIT主要衡量企业通过经营活动获取利润的能力。 折旧和摊销同样会从EBITDA中扣除,EBITD...
14.08.2023 16:19
什么是股票交易中的MACD指标?如何解读它?
什么是MACD:解读与运用指南 成功的趋势跟踪策略不仅 需要观察价格波动,更要求精准的时机把握和明确的方向确认。每位股票交易者终将面临如何甄别真实趋势与短暂波动的挑战,尤其在市场剧烈震荡产生虚假信号时。这种不确定性往往导致交易时机误判、机会错失和不必要的亏损。交易者需要可靠的工具来显...
08.08.2023 18:13
哪些产品被认为是高风险的,交易者为什么选择它们?
现代投资者有着广泛的交易产品可供选择:从传统的股票和债券到数字货币和IPO。然而,在选择它们时,仍然存在两个相互依赖的主要标准:风险和盈利能力。 根据风险程度,所有投资产品可分为高风险、中风险和低风险三类。在这种情况下,风险意味着很可能无法返还投资资金,或者与预计或承诺的利润相比,实际利...
02.07.2020 14:52
在证券交易所交易的总费用
通过经纪商在证券交易所进行交易不可避免地意味着要支付额外的服务和费用,而且这种服务的收费不是固定不变的,取决于几个因素: •经纪商费, •证券交易所费, •交易平台的选择, •账户类型, •交易资产类型, 请注意:Just2Trade这名经纪商也是按照如上数据收费,并需要您提供...
02.07.2020 14:52
风险最小的投资。是否存在无风险投资?
在交易所交易与风险直接相关。然而,并不是每一个投资者,尤其是新手投资者,都准备好不断跟上并监控完成交易的最佳时机。有些保守的交易所参与者只在损失投资基金的风险最小的情况下才准备进行交易。这种投资被称为风险最小的投资,今天我们就来谈谈这个问题。 无风险投资并不存在 虽然在证券交易所的词汇...
02.07.2020 14:51
如何投资IPO?第一步和投资组合选择
很多人对被动收入感兴趣,因为这样他们可以获得“额外”的钱。有些人喜欢把钱存入银行,但这样获利不是很多,因为大多数银行提供相当低的利息。另一种让资金产生利润的的方式是通过证券交易所对股票进行长期投资。例如,人们购买大公司的资产,并期望随着时间的推移它们的价格会上涨。另一种选择是投资IPO。 ...
02.07.2020 14:50
如何进入全球股市
世界上有许多股票市场。阅读我们的材料,了解为什么以及如何进入股市。 为什么要进入全球股市? 这个问题的答案是合乎逻辑且相当简单的:从交易资产中获利。世界市场,特别是美国交易所,同时为交易者提供了几个重要的优势: · 提供广泛的投资产品可供交易; · 外国股市稳定增长; ·...
02.07.2020 14:49
外汇交易-从哪里开始?
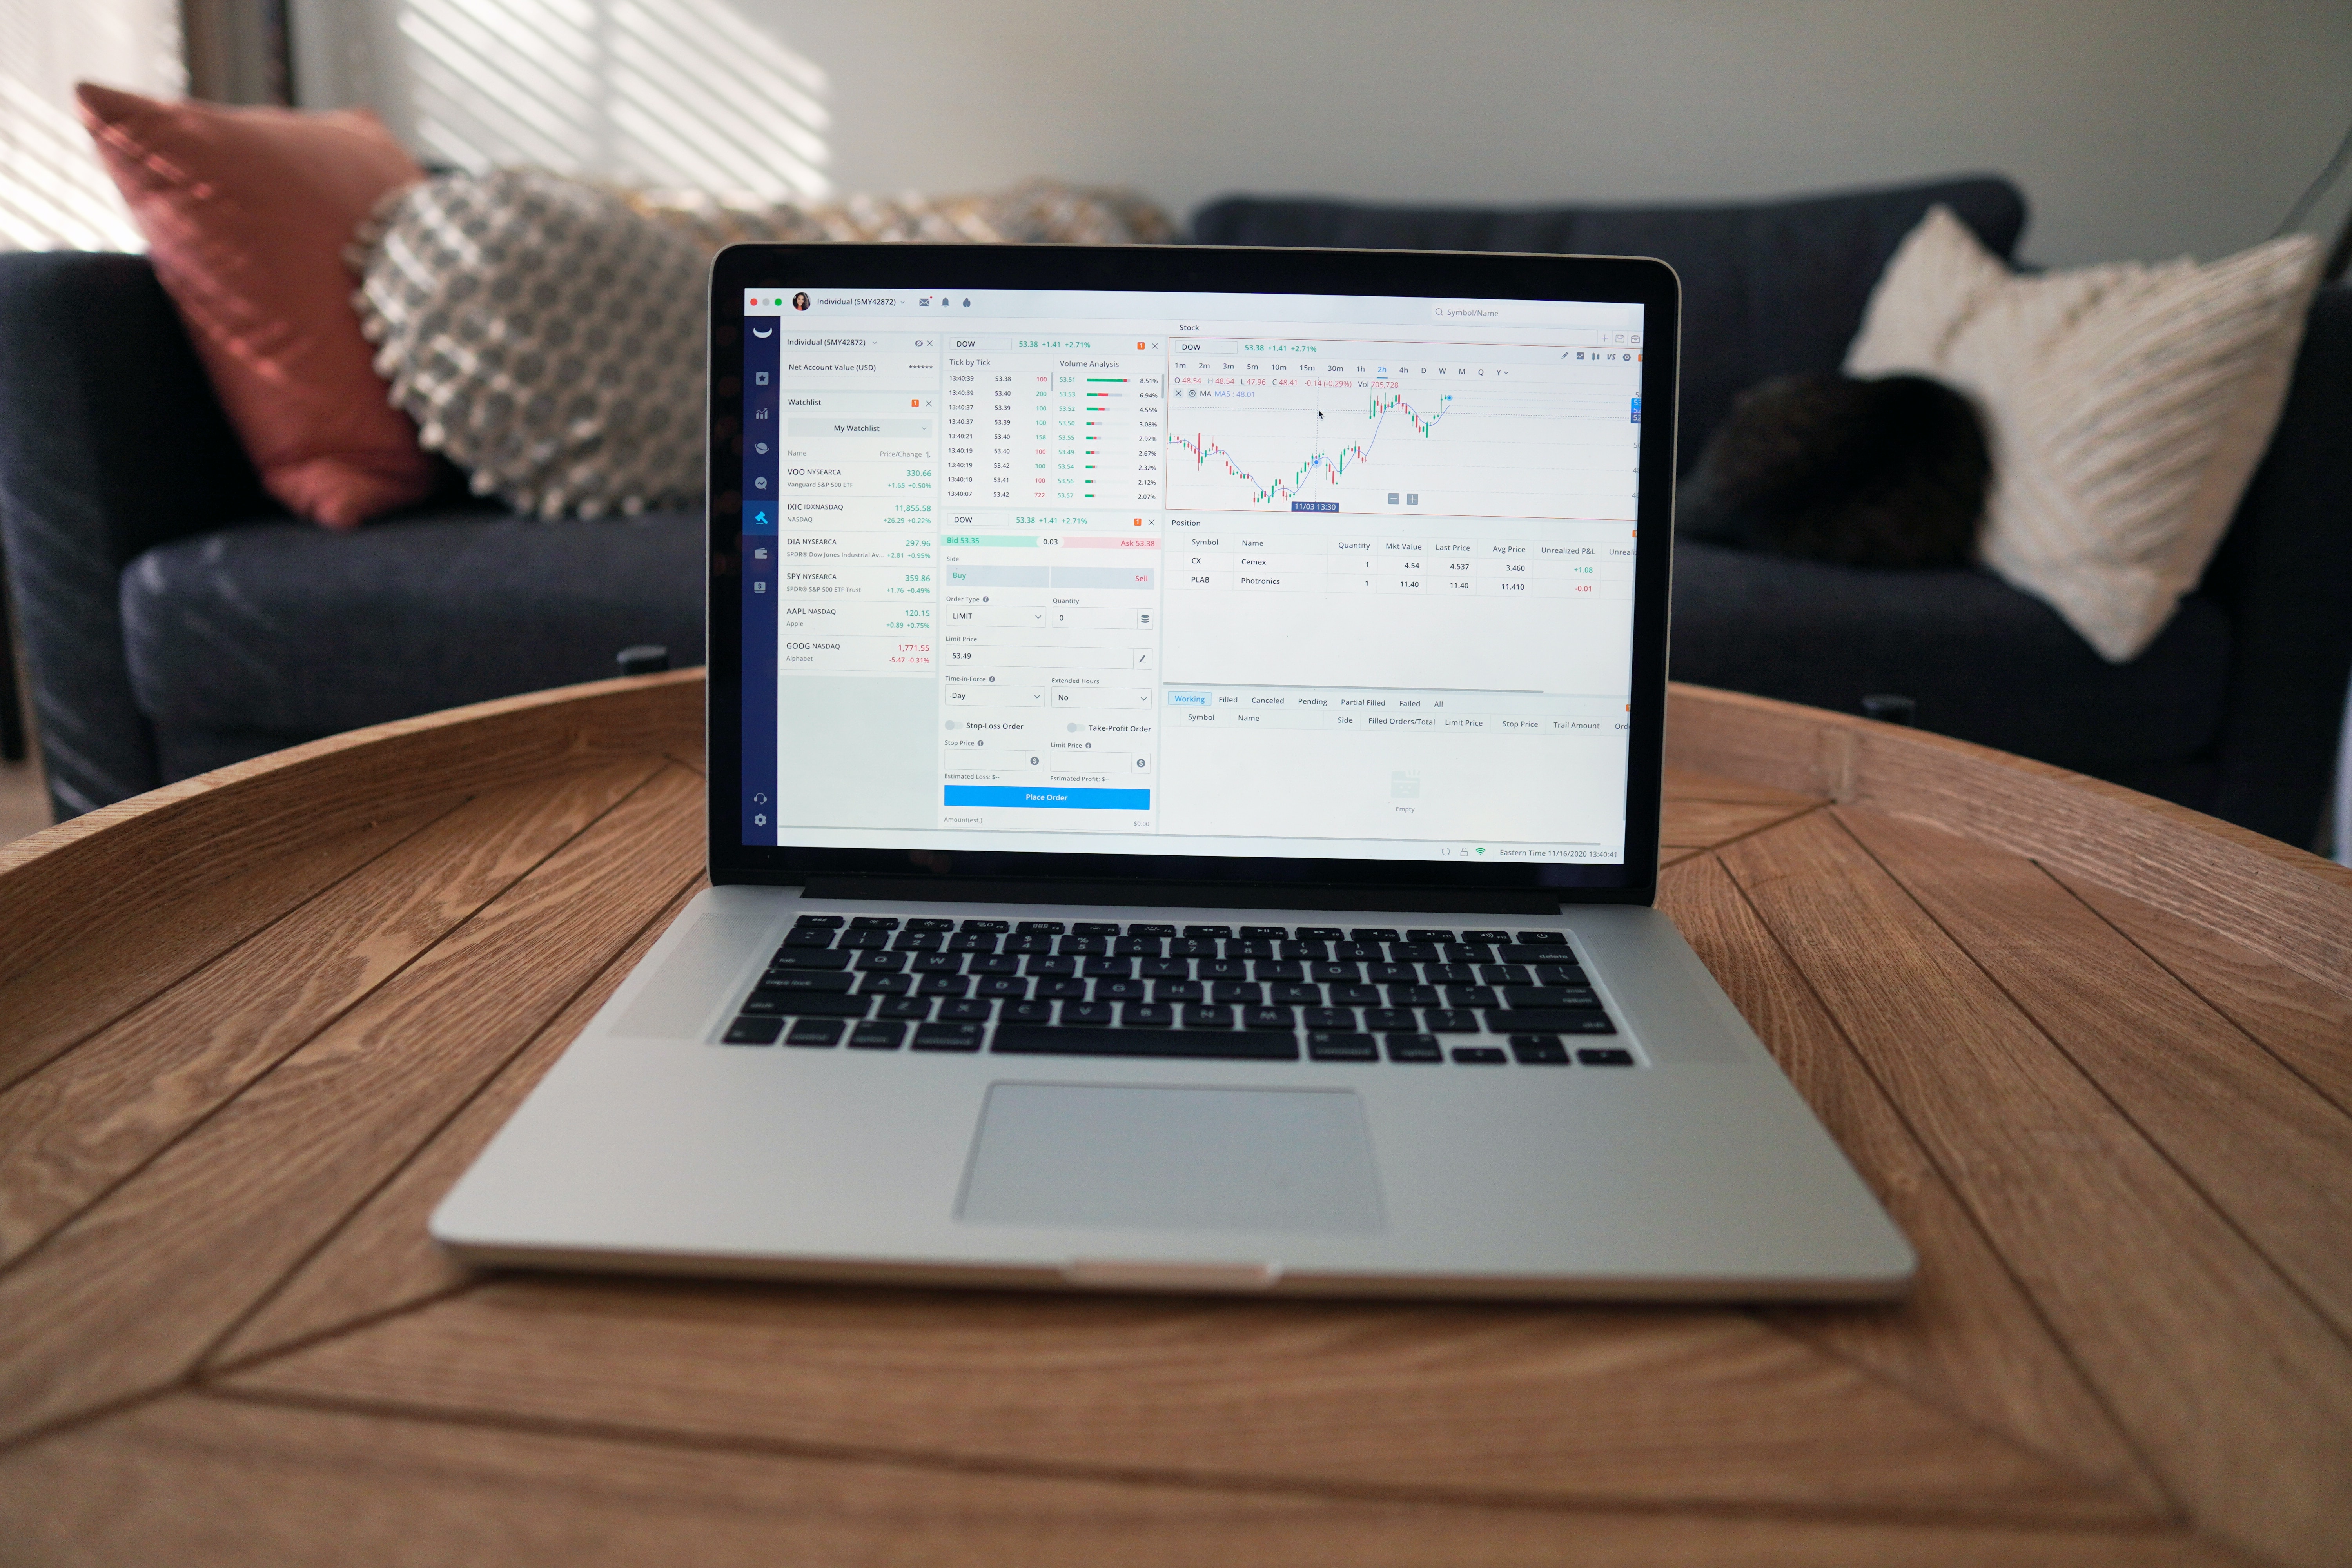
外汇市场是一个全球分散的货币交易市场,是世界上最大的流动性市场,也是最受欢迎的交易所市场之一。我们希望让您的初始交易步骤变得简单,并分享如何在外汇交易所交易:对于那些新手来说从何开始,以及什么初学者能做什么。 市场如何运作 这里的主要货币是美元,交易以货币对为基础,例如欧元对美元、...
20.03.2020 13:35
如何安装和操作MetaTrader 4、MetaTrader 5
MetaTader 4/5是全球交易所最强大、最受欢迎和最方便的交易平台之一。它们的版本适用于所有主要操作系统:Windows、MacOS、Android、iOS。此外,它们还提供网页版服务。 这两个平台版本有一些不同的特性,但安装过程几乎相同。让我们在Windows上安装MetaT...
20.03.2020 13:34