Media Móvil Exponencial (EMA): Qué Es y Cómo Usarla en el Trading
)
La media móvil exponencial (EMA) es una de las herramientas más utilizadas por los traders para identificar tendencias y puntos de entrada o salida con mayor rapidez que otros indicadores. Gracias a su capacidad de reaccionar con agilidad ante los movimientos recientes del precio, la EMA se ha convertido en un pilar fundamental de cualquier estrategia de trading, desde scalping hasta swing trading.
¿Quieres saber cómo funciona exactamente y cómo puedes usarla en plataformas como MetaTrader o TradingView? En esta guía te explicamos paso a paso cómo incorporar la EMA a tu análisis técnico, con ejemplos, ventajas clave y recomendaciones prácticas para traders en España.
Índice
¿Qué es la Media Móvil Exponencial EMA?
¿Cómo se Calcula la Media Móvil Exponencial?
¿Cómo Interpretar la Media Móvil Exponencial en Trading?
Estrategias de Trading con la EMA
Ventajas y Limitaciones de la EMA
Cómo Configurar la EMA en Plataformas Populares
Conclusión: ¿Por Qué Usar la EMA en tu Estrategia de Trading?
FAQ
¿Qué es la Media Móvil Exponencial EMA?
)
La EMA es un tipo de media móvil que asigna más peso a los precios recientes, lo que la convierte en una herramienta más sensible a los cambios de tendencia que la clásica media móvil simple (SMA).
¿En qué se diferencia de la SMA?
- La SMA da el mismo peso a todos los precios del período.
- La EMA, en cambio, se enfoca más en los datos más recientes, lo que permite detectar antes los giros del mercado.
Esta capacidad de reacción es especialmente útil en mercados volátiles, como los CFDs, el mercado de divisas o las acciones con alta rotación.
¿Cómo se Calcula la Media Móvil Exponencial?
El cálculo de la EMA incluye un multiplicador que determina qué peso se da al precio más reciente. La fórmula básica es:
EMA = (Precio actual - EMA previa) × Multiplicador + EMA previa
Donde el multiplicador se calcula así:
Multiplicador = 2 / (Período + 1)
Ejemplo práctico:
Supongamos que queremos una EMA de 10 periodos con precios diarios. El multiplicador sería:
2 / (10 + 1) = 0,1818
Luego, aplicamos esta fórmula a una serie de precios para obtener el valor suavizado de la EMA.
¿Cómo Interpretar la Media Móvil Exponencial en Trading?
La EMA se interpreta como una línea de tendencia dinámica. Su lectura es muy intuitiva:
- Precio encima de la EMA: indica una posible tendencia alcista.
- Precio debajo de la EMA: sugiere una tendencia bajista.
También puede actuar como una especie de soporte o resistencia móvil. Muchos traders colocan sus órdenes de compra o venta cuando el precio rebota sobre la EMA, o la rompe con fuerza.
Consejo pro: utiliza dos EMAs de distinto período para buscar cruces (crossovers), que pueden dar señales de entrada o salida.
Estrategias de Trading con la EMA
1. Cruce de EMAs
Una de las estrategias más populares en EMA trading consiste en usar dos medias móviles:
- EMA rápida: 9 o 12 periodos
- EMA lenta: 21 o 26 periodos
Señal de compra: cuando la EMA rápida cruza encima de la lenta.
Señal de venta: cuando cruza por debajo.
2. EMA + RSI
Otra combinación habitual es usar la EMA con el índice RSI. Por ejemplo:
- Si el precio está encima de la EMA y el RSI confirma impulso, puede ser señal de compra.
- Si está debajo de la EMA y el RSI cae por debajo de 50, es una señal de venta más sólida.
3. EMA para diferentes estilos de trading
| Tipo de trading |
EMA recomendadas |
Temporalidad sugerida |
| Scalping |
EMA 9 y 21 |
Gráficos de 1–5 min |
| Swing Trading |
EMA 20 y 50 |
4H o Diario |
| Largo plazo |
EMA 100 y 200 |
Diario / Semanal |
Ventajas y Limitaciones de la EMA
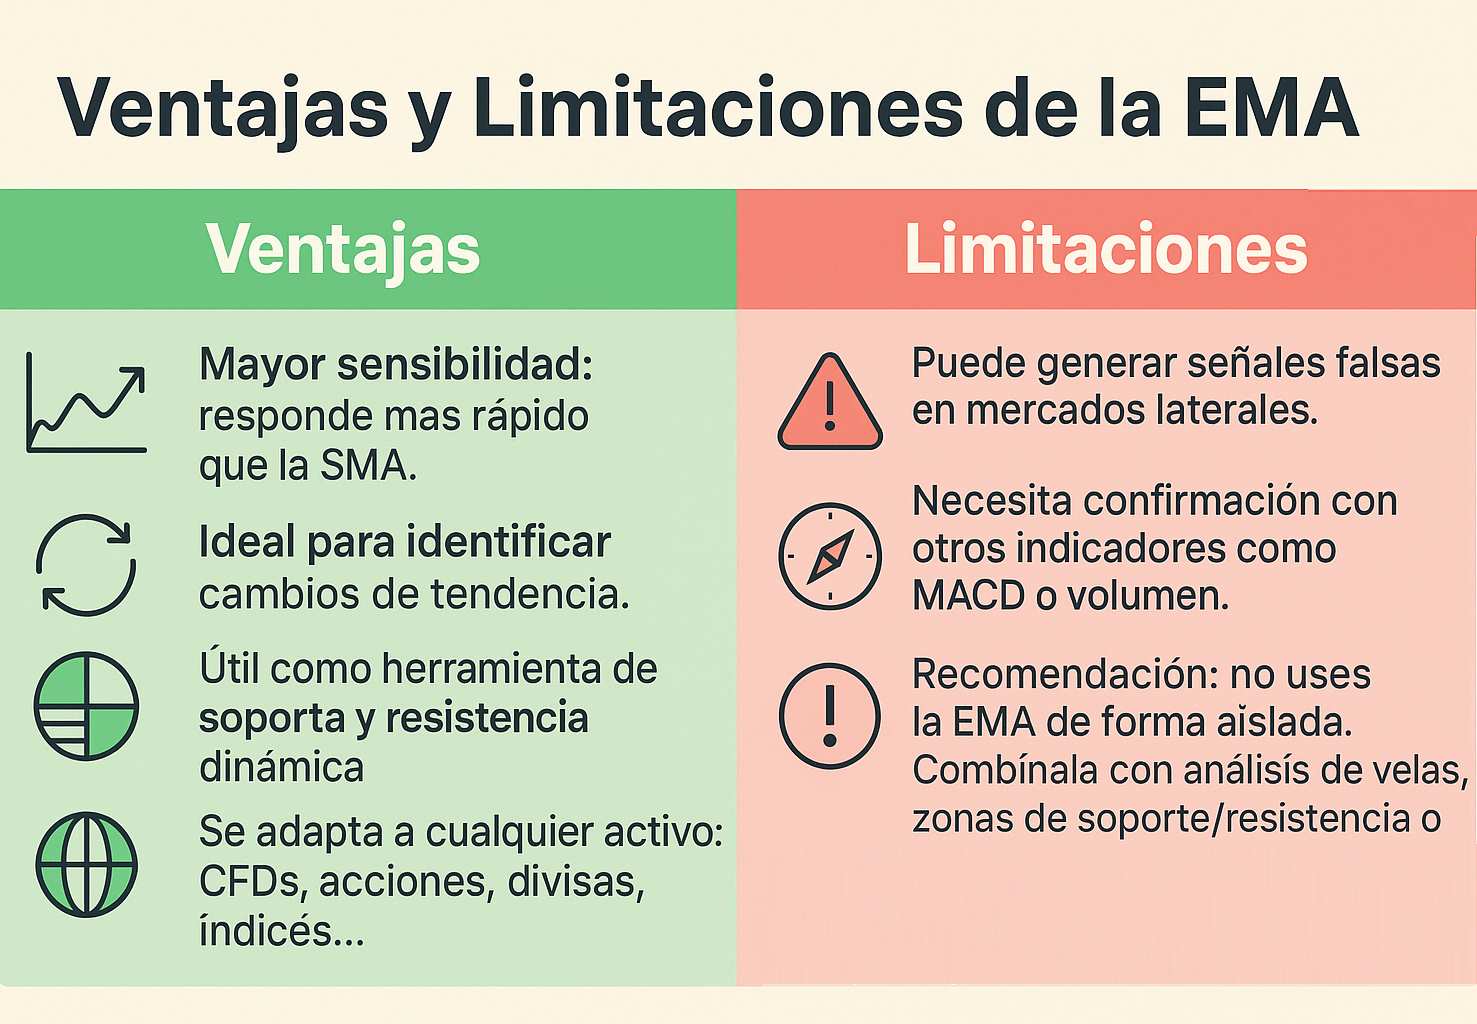)
Ventajas
- Mayor sensibilidad: responde más rápido que la SMA.
- Ideal para identificar cambios de tendencia.
- Útil como herramienta de soporte y resistencia dinámica.
- Se adapta a cualquier activo: CFDs, acciones, divisas, índices…
Limitaciones
- Puede generar señales falsas en mercados laterales.
- Necesita confirmación con otros indicadores como MACD o volumen.
Recomendación: no uses la EMA de forma aislada. Combínala con análisis de velas, zonas de soporte/resistencia o indicadores como el RSI para afinar tus entradas.
Cómo Configurar la EMA en Plataformas Populares
La EMA está disponible en todas las plataformas de trading modernas:
MetaTrader 4 y MetaTrader 5
- Ve a Insertar → Indicadores → Tendencia → Media Móvil.
- Cambia el tipo a Exponencial.
- Ajusta el período y selecciona “aplicado al precio de cierre”.
TradingView
- Usa el buscador de indicadores y escribe “EMA”.
- Puedes agregar múltiples EMAs con diferentes colores y períodos.
- Ideal para visualizar cruces y tendencias rápidas.
Recomendaciones por tipo de trading
- Intradía: EMA 9, EMA 21
- Swing: EMA 20, EMA 50
- Largo plazo: EMA 100, EMA 200
Conclusión: ¿Por Qué Usar la EMA en tu Estrategia de Trading?
La media móvil exponencial (EMA) es una herramienta versátil, sensible y muy útil para cualquier trader que quiera identificar tendencias con mayor agilidad.
Resumen práctico:
- ¿Cuándo usarla? En cualquier marco temporal, especialmente en mercados con dirección clara.
- ¿Cómo interpretarla? Precio encima de la EMA = fuerza. Precio debajo = debilidad.
- ¿Con qué combinarla? RSI, MACD, volumen, patrones de velas.
¿Aún no lo has probado?
Abre una cuenta demo gratuita en Just2Trade y entrena tu estrategia con EMAs sin arriesgar tu capital.
FAQ
¿Qué es la media móvil exponencial (EMA) y para qué sirve en trading?
La media móvil exponencial (EMA) es un indicador técnico que suaviza el precio dando más peso a los datos más recientes. Se usa para detectar tendencias en el mercado y generar señales de compra o venta cuando el precio está encima de la EMA o cruza por debajo de ella.
¿Cuál es la diferencia entre la media móvil exponencial y la simple (SMA)?
La media móvil exponencial responde más rápido a los cambios de precio que la media móvil simple (SMA), ya que asigna mayor peso a los últimos precios. Por eso, la EMA es preferida por muchos traders para tomar decisiones más ágiles en entornos volátiles.
¿Qué estrategia de trading se puede aplicar con EMAs?
Una estrategia de trading muy utilizada es el cruce de EMAs, donde se usan dos medias móviles exponenciales (por ejemplo, EMA 12 y EMA 26). Cuando la EMA más corta cruza encima de la EMA más larga, se genera una señal de compra. Si cruza por debajo, es una posible señal de venta.