Gráfico de barras: o que é, análise técnica, exemplos e tipos

Se gosta de negociação, certamente já ouviu falar de vários gráficos de preços: barras, velas, colunas e outros. Neste artigo, vamos analisar mais de perto um dos mais populares e versáteis deles: o gráfico de barras, que é comumente usado por negociadores para analisar tendências e períodos nos mercados financeiros. Seja você um novato em negociação ou alguém que deseja aprimorar as suas habilidades, uma compreensão clara dos gráficos de barras pode melhorar a sua análise de mercado, então fique atento.
Índice
PONTOS PRINCIPAIS
O QUE É UM GRÁFICO DE BARRAS?
PADRÕES DE BARRAS
TIPOS
BENEFÍCIOS
GRÁFICO DE BARRAS VS. HISTOGRAMA VS. GRÁFICO DE COLUNAS
GRÁFICO DE BARRAS VS. GRÁFICO DE VELAS
CONCLUSÃO
PERGUNTAS FREQUENTES
PONTOS PRINCIPAIS
- Um gráfico de barras na negociação exibe a ação do preço de um ativo durante um período específico.
- Cada barra de preço contém uma linha vertical que mostra os preços mais altos e mais baixos e linhas horizontais curtas em ambos os lados para os preços de abertura e de fecho.
- Esses gráficos são comumente usados para analisar tendências de mercado, identificar volatilidade de preços e detectar pontos de reversão potenciais.
O QUE É UM GRÁFICO DE BARRAS?
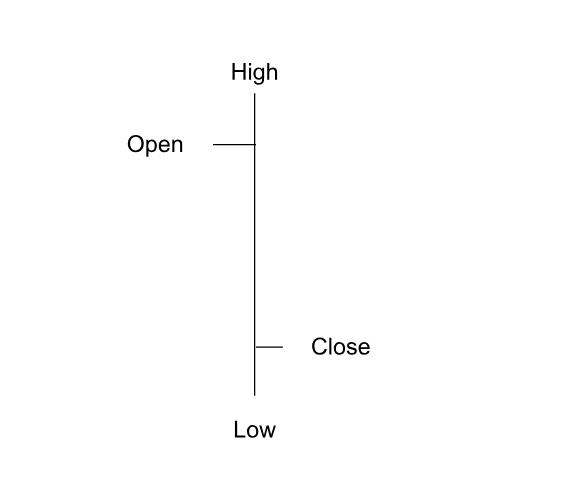
Um gráfico de barras é uma ferramenta visual na negociação que ilustra as alterações no valor de um ativo durante um determinado período de tempo. Cada barra no gráfico representa um único período, como um dia, uma semana ou uma hora, dependendo da preferência do negociador. A linha vertical em cada barra representa os preços mais altos e mais baixos do ativo durante esse período. Os traços horizontais à esquerda e à direita indicam os preços de abertura e de fecho, respetivamente.
Explicação do gráfico de barras
As barras são uma forma específica de gráfico de negociação que consiste em linhas verticais e horizontais.
- As linhas verticais representam os preços máximos e mínimos
- Os ticks horizontais mostram os preços de abertura e de fecho
Uma barra que fecha acima da sua abertura é geralmente vista como otimista, sinalizando um impulso ascendente. O inverso, por sua vez, indica um sentimento de mercado pessimista.
As barras ajudam os traders a analisar informações de mercado e identificar possíveis oportunidades de negociação na análise técnica. Os traders podem avaliar a volatilidade do mercado e o sentimento geral para um período específico, analisando os preços máximos, mínimos, de abertura e de fechamento em cada barra. Uma barra mais longa significa maior flutuação de preço, enquanto uma barra mais curta representa mais estabilidade, com base no comprimento da barra como um indicador da variação de preço.
PADRÕES DE BARRAS
Os padrões de barras num gráfico são cruciais para os traders identificarem potenciais movimentos do mercado e avaliarem o sentimento geral do mercado. Identificar essas tendências pode ajudar os traders a prever se o mercado está a passar por uma tendência de alta, uma tendência de baixa ou se está a se mover lateralmente. Aqui estão alguns padrões de barras populares:
- Dia de alta e dia de baixa. Um dia com um aumento no preço de fechamento em comparação com o dia anterior é conhecido como dia de alta. Esse padrão sinaliza uma potencial tendência de alta. Por outro lado, um dia com uma queda no preço de fechamento em comparação com o dia anterior é conhecido como dia de baixa. Isso indica um sentimento negativo do mercado.
- Dia interno e dia externo. O padrão de dia interno ocorre quando a alta e a baixa da barra estão dentro da variação do dia anterior. Geralmente sinaliza consolidação e pode preceder uma continuação da tendência existente. Um dia externo é caracterizado por uma barra que inclui a variação do dia anterior e tem uma alta mais elevada e uma baixa mais baixa. Isso pode sinalizar um impulso significativo em uma direção e normalmente indica a confirmação da tendência.
- Intervalo de negociação. Este padrão ocorre quando o mercado negocia horizontalmente dentro de um intervalo específico, com os preços a flutuar entre os níveis de suporte e resistência. Significa um período de incerteza antes de uma possível recuperação ou queda.
- Padrões de reversão. Os padrões de reversão indicam uma potencial mudança na direção da tendência. Exemplos incluem reversões importantes, em que uma barra mostra um forte movimento contra a tendência predominante, e topos ou fundos duplos, sinalizando uma potencial reversão do mercado.
Picos
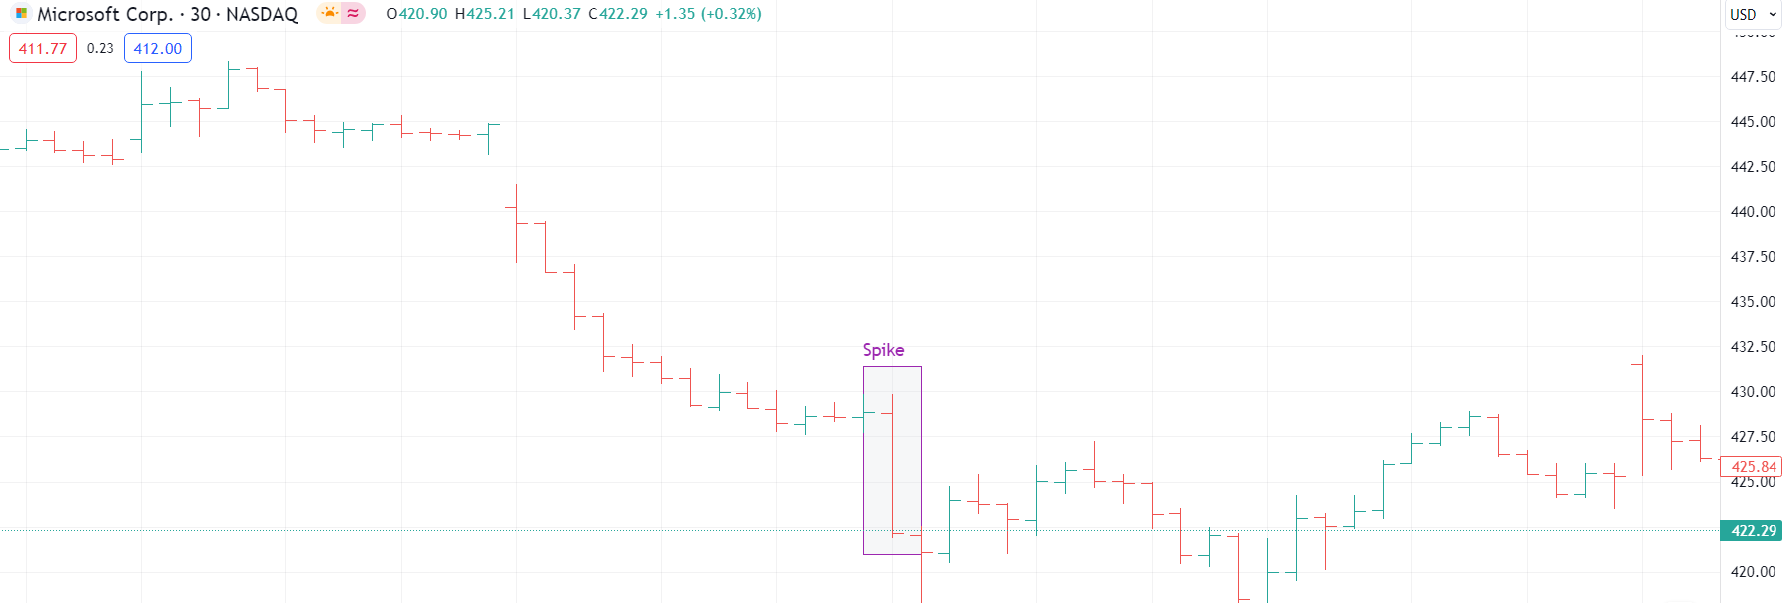
Os picos, também conhecidos como barras longas, significam mudanças rápidas e, por vezes, abruptas nos preços dentro de uma curta faixa de negociação diária, geralmente desencadeadas por notícias ou eventos inesperados.
Um pico pode servir como um sinal importante de reversão, especialmente se ocorrer após uma tendência prolongada. Por exemplo, um aumento repentino numa tendência de alta pode refletir um pico nas compras, indicando uma possível mudança de direção em breve. Por outro lado, um pico repentino numa tendência de baixa pode indicar uma corrida entre os vendedores, possivelmente indicando o ponto mais baixo do mercado.
Diferenças de preço
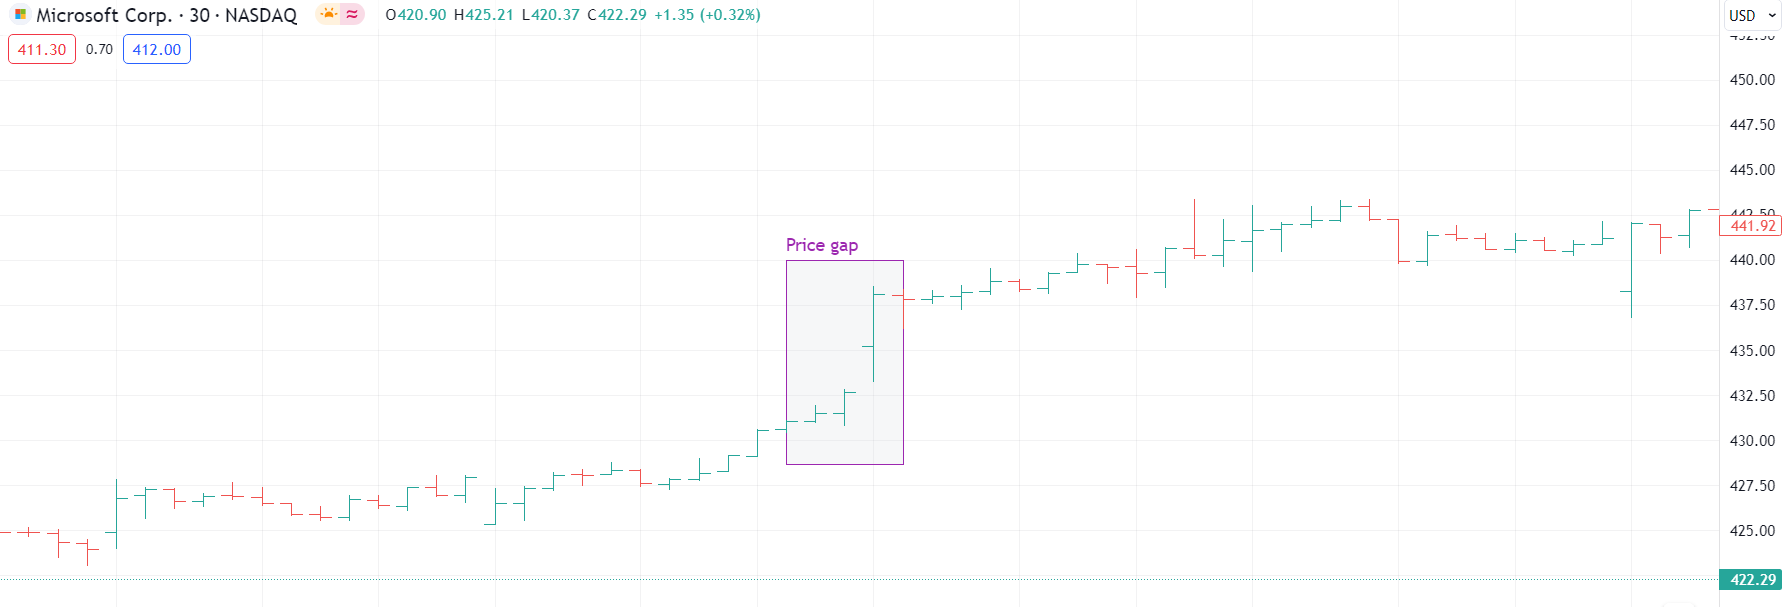
As diferenças de preço ocorrem quando há uma diferença notável entre o preço de fecho de um dia e o preço de abertura do dia seguinte, sem atividade de negociação entre eles. Elas são normalmente divididas em vários tipos.
- A diferença positiva ocorre quando o preço de abertura ultrapassa a alta do dia anterior. Isso é geralmente visto como um sinal positivo, mostrando uma demanda significativa por parte dos compradores.
- A lacuna descendente ocorre quando o preço de abertura está abaixo da mínima do dia anterior, indicando uma perspetiva de baixa e a possibilidade de uma nova queda no mercado.
- O gap comum é normalmente encontrado numa faixa de negociação. Estes gaps são frequentemente preenchidos quando os preços regressam aos níveis anteriores.
- A lacuna de ruptura indica o início de uma nova tendência, frequentemente observada no início de uma ruptura de uma faixa de negociação.
- A lacuna de exaustão geralmente ocorre perto do final de uma tendência e vem antes de uma reversão, à medida que o impulso final da tendência perde força.
- A lacuna de fuga ocorre numa tendência em curso e indica o seu forte potencial de continuação.
- A reversão em ilha é um padrão raro, mas poderoso, em que uma lacuna é seguida por uma consolidação e, em seguida, por outra lacuna na direção oposta. Geralmente representa uma mudança drástica na tendência.
TIPOS
Existem vários tipos de gráficos de barras.
- Barra de preço padrão. Este é o tipo mais comum. Apresenta o preço mais alto, o preço mais baixo, o preço de abertura e o preço de fecho para um período de tempo específico. A marca à esquerda indica o preço de abertura, enquanto a marca à direita indica o preço de fecho.
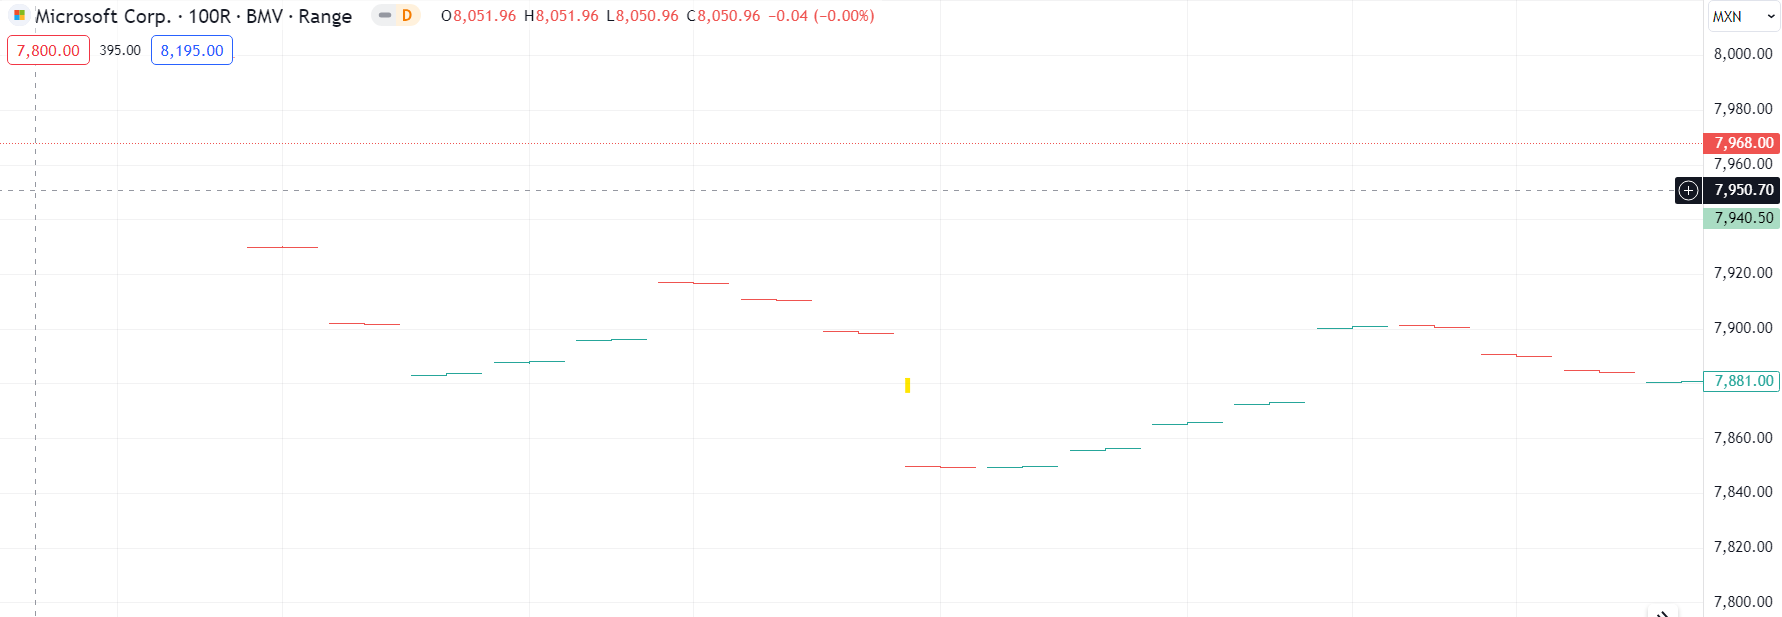
- Barras de intervalo. Estes gráficos focam-se apenas no intervalo entre os preços mais altos e mais baixos, não exibindo os preços de abertura e de fecho. Os gráficos de barras de intervalo são úteis para ilustrar a volatilidade do mercado sem a distração de pontos de dados adicionais.
- Barras de volume. As barras de volume incorporam o volume de negociação, além dos dados de preço, oferecendo uma imagem mais abrangente da atividade do mercado.
Exemplo n.º 1
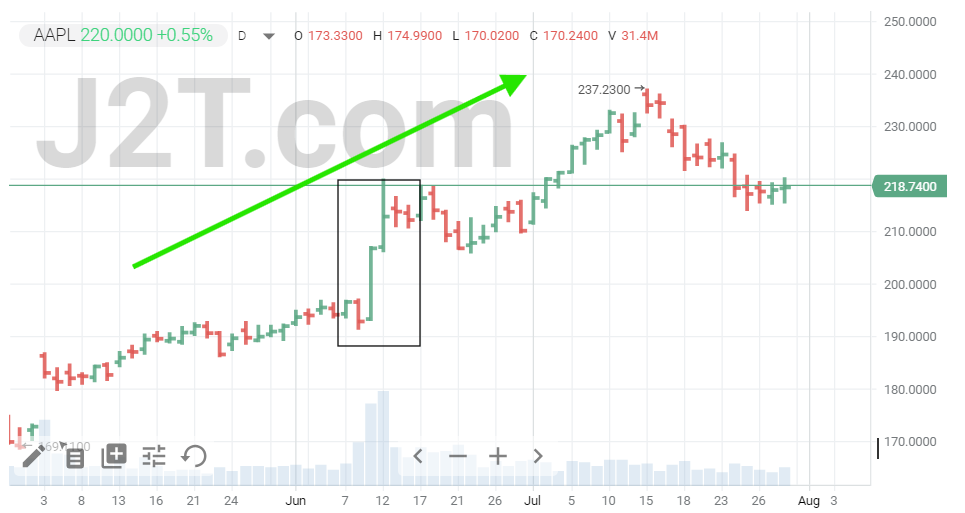
Vamos considerar um exemplo de um gráfico de ações. Podemos ver uma tendência de alta consistente no gráfico, já que a maioria das barras tem uma cor verde. No meio deste gráfico de barras, há duas barras verdes pontiagudas que representam uma rápida mudança de preço durante um curto período de tempo. Neste caso, os picos resultaram num breve impulso descendente e na indecisão do mercado, que logo depois voltou à tendência ascendente.
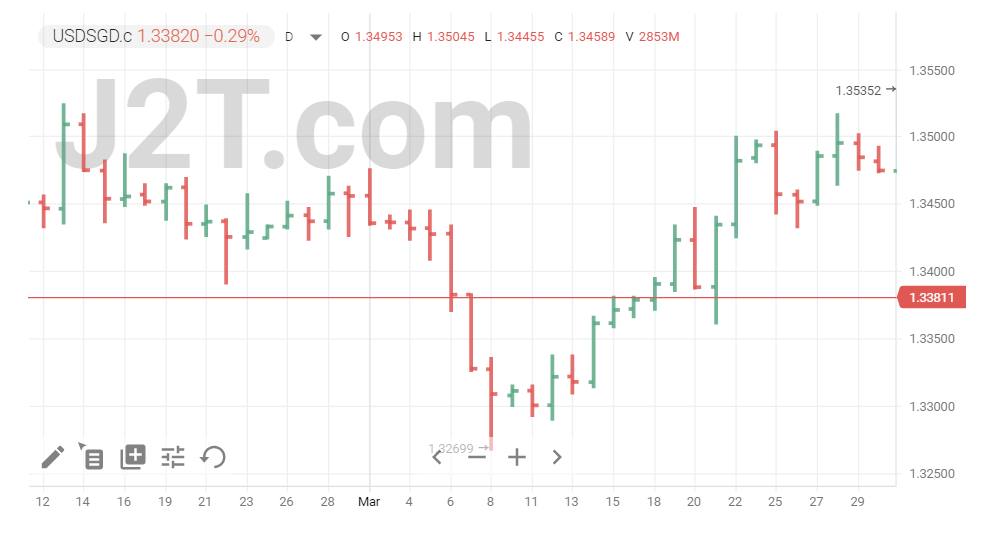
Exemplo n.º 2
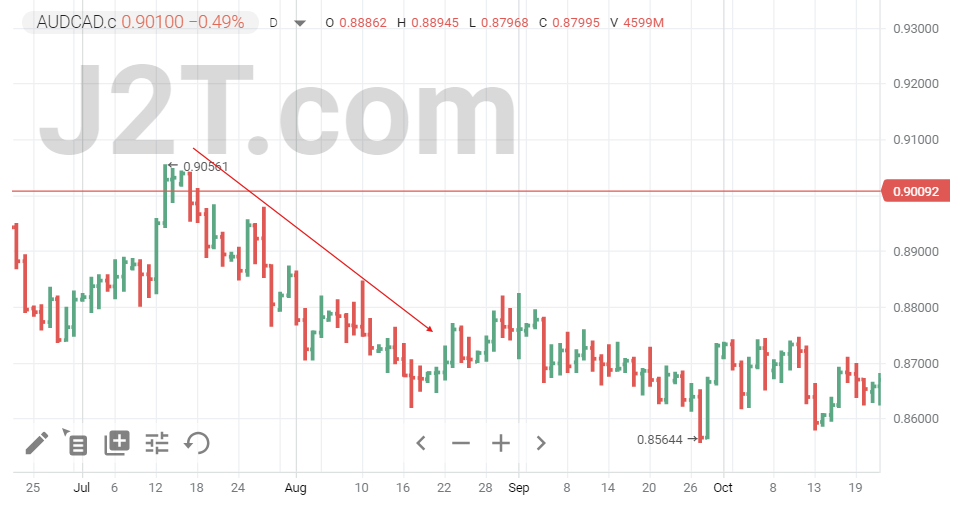
Aqui está outro exemplo no gráfico de barras forex em condições de mercado em queda. À medida que os preços caem, podemos ver que há mais barras vermelhas do que verdes, o que nos ajuda a visualizar melhor o sentimento principal do mercado. Além disso, é importante notar que, num mercado em baixa, as barras geralmente ficam mais longas, refletindo assim a crescente volatilidade dos preços.
BENEFÍCIOS
Aqui estão alguns dos principais benefícios de usar gráficos de barras na negociação:
- Análise histórica. As barras ajudam os negociadores a avaliar as flutuações e tendências de preços anteriores para antecipar as tendências futuras do mercado.
- Níveis de suporte e resistência. Com os gráficos de barras, pode identificar os principais níveis de suporte e resistência, que são essenciais para definir pontos de entrada e saída nas negociações.
- Avaliação da volatilidade. O comprimento e a forma das barras fornecem informações sobre a volatilidade do mercado. Barras mais longas indicam maiores flutuações de preço e potenciais oportunidades de negociação.
- Padrões de preços. As barras permitem que os negociadores identifiquem facilmente padrões de análise técnica, como topos duplos, fundos duplos e cabeça e ombros, que podem indicar potenciais movimentos do mercado.
- Identificação das tendências do mercado. A visualização da evolução dos preços ao longo do tempo num gráfico de barras ajuda os traders a identificar e confirmar as tendências do mercado com mais facilidade.
GRÁFICO DE BARRAS VS. HISTOGRAMA VS. GRÁFICO DE COLUNAS
Embora os gráficos de barras, histogramas e gráficos de colunas possam parecer semelhantes, eles têm funções distintas na análise de dados. Vamos dar uma olhada mais de perto.
Como já mencionámos acima, os gráficos de barras exibem dados de preços individuais para períodos de tempo específicos. Eles mostram os preços máximos, mínimos, de abertura e de fecho, o que os torna essenciais para analisar as tendências e a volatilidade do mercado.
Os histogramas, por sua vez, mostram a dispersão dos dados numéricos, comumente empregados para exibir distribuições de frequência ou distribuições de probabilidade dentro de um conjunto de dados. Ao contrário das barras, os gráficos de histograma não se concentram em pontos de dados específicos baseados no tempo.
Os gráficos de colunas são semelhantes aos gráficos de barras. No entanto, são normalmente utilizados para comparar categorias de dados, em vez de dados baseados no tempo. Na negociação, são menos comuns, mas podem ser utilizados para comparar diferentes ativos (forex, futuros, índices, etc.) ou segmentos de mercado ao longo de um período de tempo igual.
GRÁFICO DE BARRAS VS. GRÁFICO DE VELAS
Tanto os gráficos de barras como os gráficos de velas são ferramentas essenciais na análise técnica. Em contraste com as barras, as velas oferecem os mesmos dados, mas com um toque visual um pouco mais interessante. As velas consistem em corpos coloridos para indicar tendências de alta e de baixa: normalmente, verde ou branco para alta (preço de fechamento acima da abertura) e vermelho ou preto para baixa (preço de fechamento abaixo da abertura). Esse código de cores facilita a avaliação rápida do sentimento do mercado, ajudando os traders a tomar decisões informadas.
CONCLUSÃO
Os gráficos de barras são uma ferramenta essencial na análise técnica. Eles fornecem uma representação clara dos movimentos dos preços ao longo de um determinado período, destacando dados importantes sobre os preços, como os preços máximos, mínimos, de abertura e de fechamento.
No entanto, não se esqueça que, tal como acontece com qualquer outra ferramenta de negociação , os sinais e padrões dos gráficos de barras não devem ser considerados como certos. Por isso, recomenda-se combinar esta ferramenta com outros instrumentos de análise técnica.
PERGUNTAS FREQUENTES
O que é um gráfico de barras na negociação?
Um gráfico de barras representa a variação do preço de um ativo durante um período específico, como um dia ou uma semana. Cada barra de preço exibe os preços mais altos e mais baixos, juntamente com os preços de abertura e de fecho.
Qual é a diferença entre um gráfico de linhas e um gráfico de barras na negociação?
Um gráfico de linhas mostra os preços de fecho ao longo do tempo, formando uma linha contínua. Um gráfico de barras fornece uma visão mais detalhada com barras de preços, exibindo os preços de abertura, fecho, máximos e mínimos.
Qual é a diferença entre velas e barras na negociação?
As velas e as barras representam a ação do preço. As velas usam corpos coloridos para mostrar a variação entre os preços de abertura e de fecho. As barras usam uma única linha vertical para a variação máxima-mínima e ticks para a abertura e o fecho.
O que um gráfico de barras pode indicar?
Um gráfico de barras pode indicar tendências de mercado, volatilidade e potenciais pontos de reversão. Ao analisar as barras de preços, um trader pode identificar padrões como máximos mais elevados, dias internos e níveis-chave de suporte e resistência.