Bearish Engulfing Pattern: Definition, How it Works, Trading, and Examples
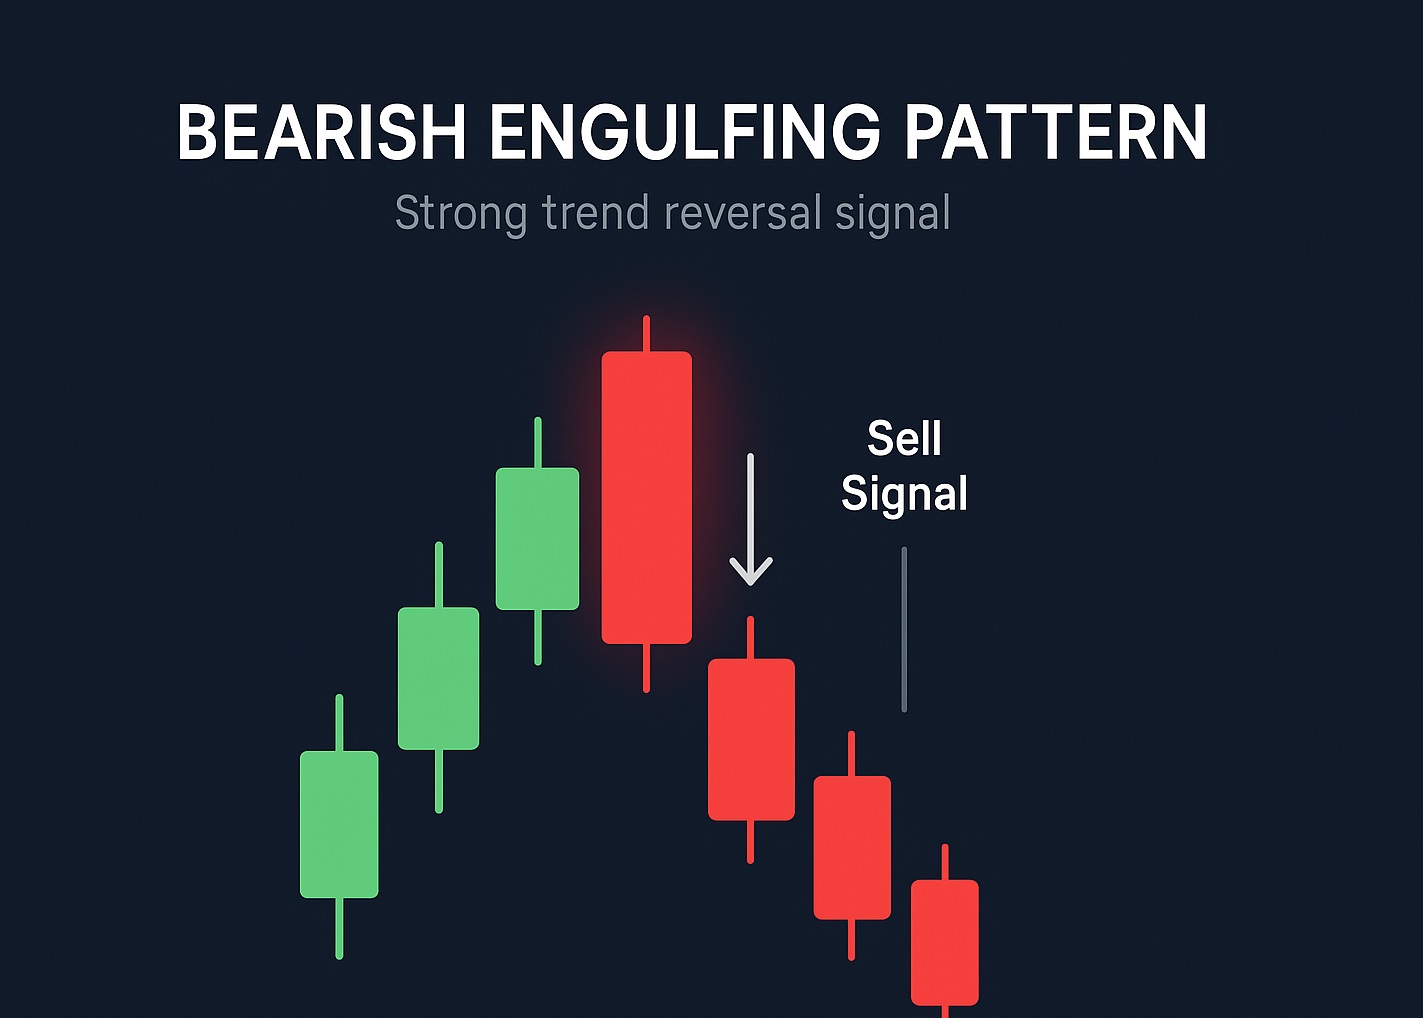)
Table of Contents
Key Takeaways
Interpreting the Bearish Engulfing Pattern
The Psychology Behind the Bearish Engulfing Pattern
Trading the Bearish Engulfing Pattern
Intra-day Bearish Engulfing Pattern
The Pros and Cons of Using the Bearish Engulfing Pattern
Examples of the Bearish Engulfing Pattern
Similar Chart Patterns
Comparing Bar Charts and Candlestick Charts
Reliability and Confirmation of the Bearish Engulfing Pattern
Choosing the Right Time Frame
Conclusion
FAQs
The bearish engulfing pattern is a candlestick pattern traders love to spot — especially when a trend might be ready to turn. This bearish reversal signal forms at the top of an uptrend and sends a powerful message: momentum is shifting.
It appears when a small bullish candle is completely overshadowed by a larger bearish candle. This combination suggests a sentiment change. When the bearish engulfing pattern occurs, the bulls retreat, and the bears step in. Understanding this chart pattern is vital for technical analysis.
Key Takeaways
- A candle chart visualizes price moves with rectangular candles.
- The bearish engulfing candlestick pattern signals a potential reversal.
- It involves two candles — the first candle is bullish, the second candle is a strong bearish candle that engulfs it.
- This pattern typically follows a strong uptrend.
- Consider short positions if the setup is confirmed.
- Place your stop loss just above the second candle’s high.
- Use other technical indicators for confirmation.
- Match your trading strategy to your preferred chart time frame.
- Market gaps often amplify the signal’s strength.
- Always use risk management tools when trading bearish engulfing patterns.
Interpreting the Bearish Engulfing Pattern
This chart pattern is not just a shape — it's a reversal signal. It usually shows up after an upward price trend. The first candle is bullish. The second candle, a bearish one, opens higher but closes far below the first, creating an engulfing candle.
The meaning? Sellers have taken over. The bulls were in charge, but the bears just slammed the door. It's a warning: the uptrend may be over. Downtrend ahead. But don’t rush. Smart traders always confirm with RSI, MACD, and trading volume.
The Psychology Behind the Bearish Engulfing Pattern
Think of it as a story in two parts. First, optimism drives price upward — buyers dominate. That’s your white candle. Then comes the twist: the second candle opens strong but crashes down, forming a dominant black candle's body that swallows the first.
Fear replaces confidence. That’s bearish sentiment gaining ground. The second candle doesn't whisper — it shouts. It tells us bulls are backing off. When you see this, pause and think: is the trend flipping? Use the market context and technical indicators to help identify reversals.
Engulfing patterns reveal market psychology at its rawest. Watch how quickly traders jump ship when emotion kicks in.
Trading the Bearish Engulfing Pattern
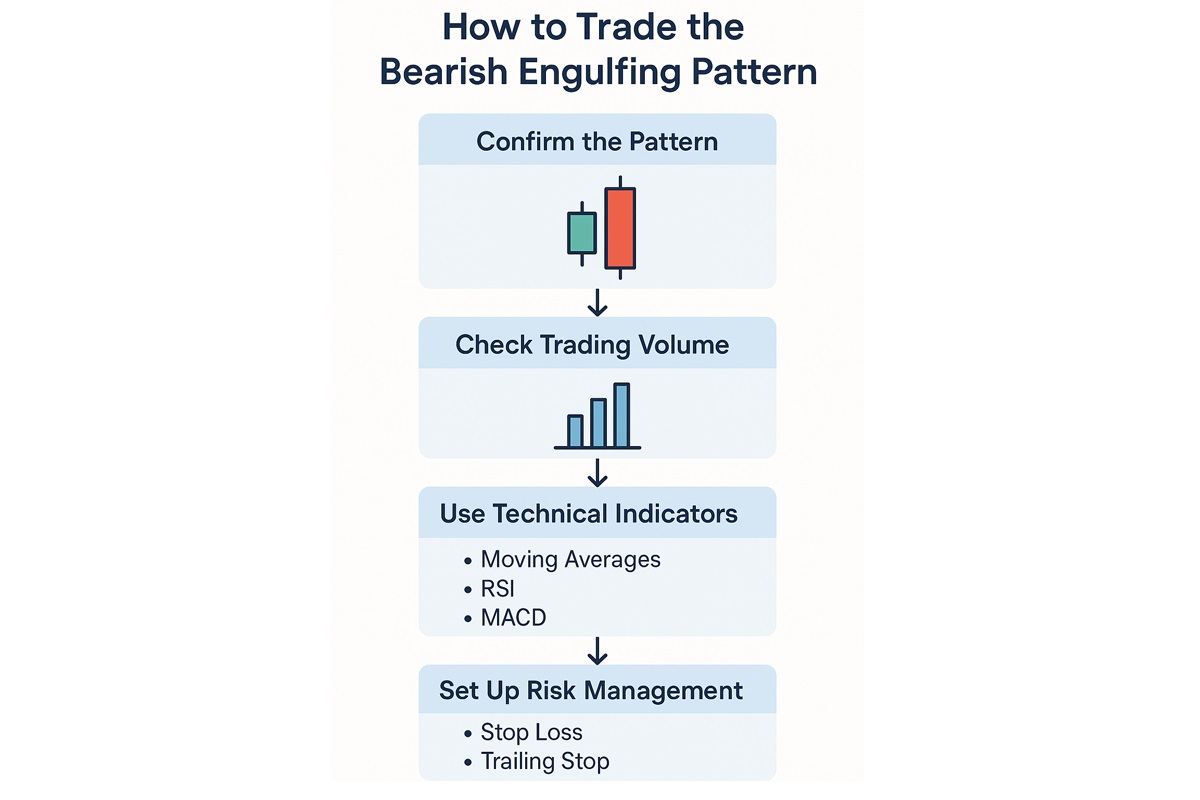
Trading bearish engulfing patterns is more than just spotting two candles. Timing, confirmation, and discipline matter. Wait for the next candle to seal the deal. Look for indicators — RSI diving, MACD turning, high trading volume.
A gap down? Even better. That adds strength. Now check your chart and the market context. Don’t make decisions in isolation.
Set your stop loss above the second candle’s high. Use your entry point just below the closing price. Stick to your risk management tools — this isn’t gambling, it’s trading.
Trading Strategy Tips:
- Use confirmation from other technical indicators.
- Steer clear of trading stocks stuck in tight ranges.
- Respect your trading strategy. Obey your stop loss.
)
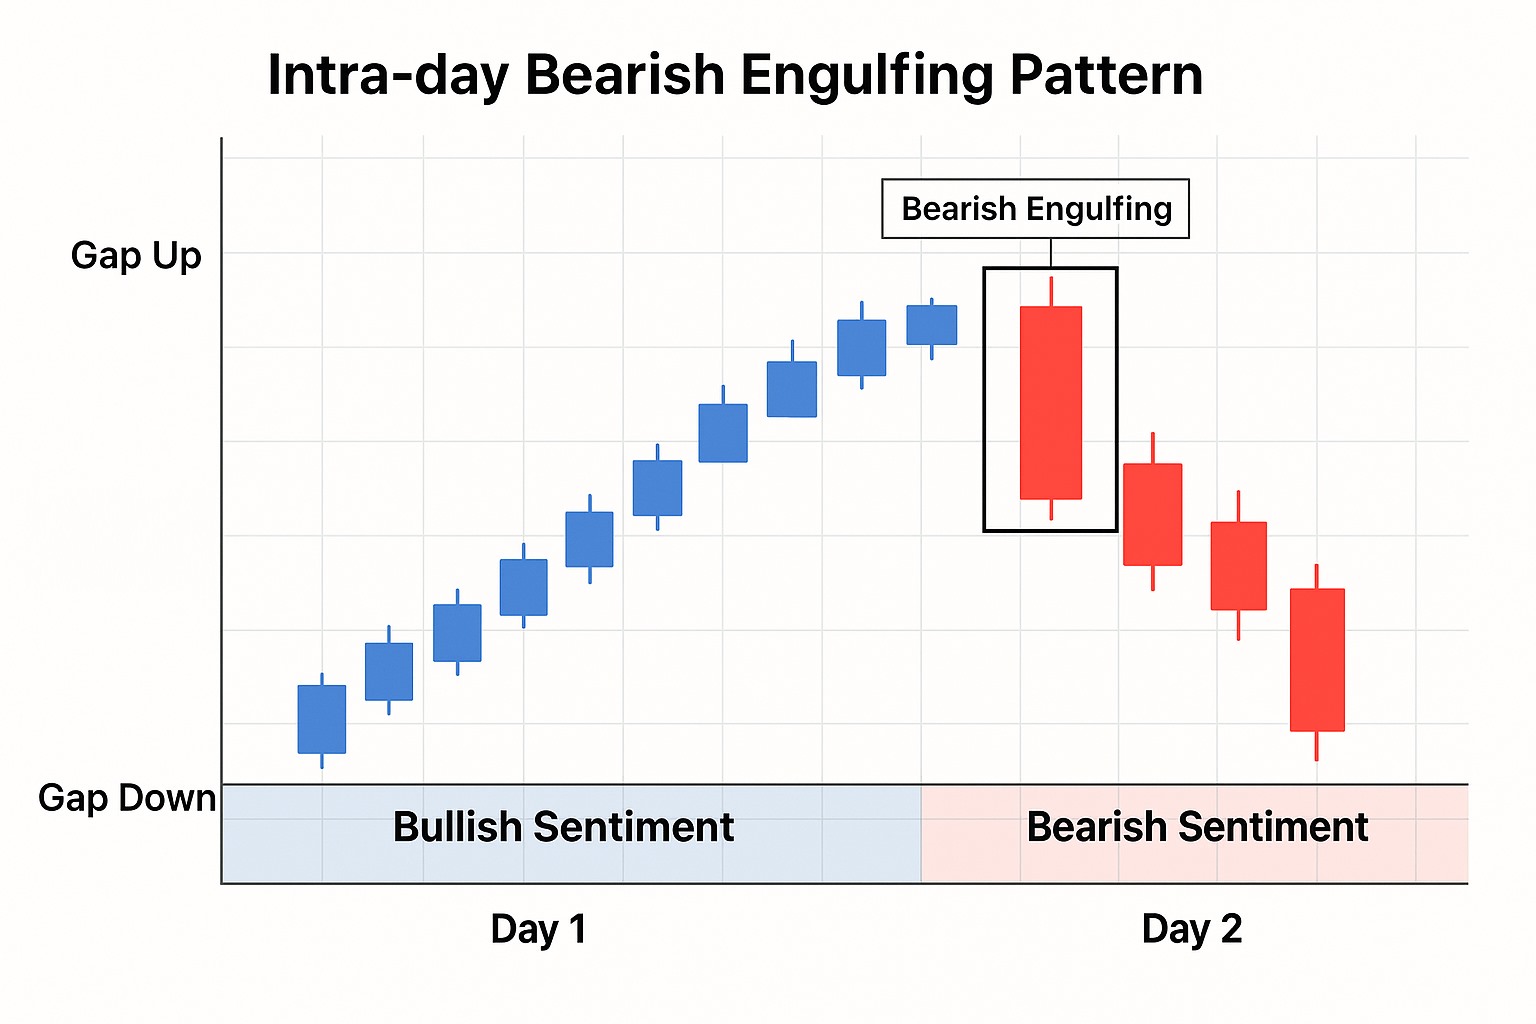
Intra-day Bearish Engulfing Pattern
Let’s zoom in. On a 15-minute chart, you see a bullish candle forming after a gap up — momentum is hot. Suddenly, sellers crash the party. A big bearish candle forms.
This intra-day bearish engulfing candle pattern is fast, sharp, and perfect for short-term traders. The opposite? The bullish engulfing pattern occurs when the second candle flips sentiment back upward. Watch both sides.
)
The Pros and Cons of Using the Bearish Engulfing Pattern
| Pros |
Cons |
| Easy to recognize on candlestick charts |
False signals are common without confirmation |
| Powerful early warning for trend reversals |
Requires market context and volume data |
| Works across multiple time frames |
Weak during low trading volume periods |
| Helps find entry points with strong risk-reward |
Might lag in fast-moving markets |
Knowing both the strengths and the risks helps refine your trading strategy. Don’t lean too hard on one pattern. Blend it with volume, risk management tools, and solid investment advice.
Examples of the Bearish Engulfing Pattern
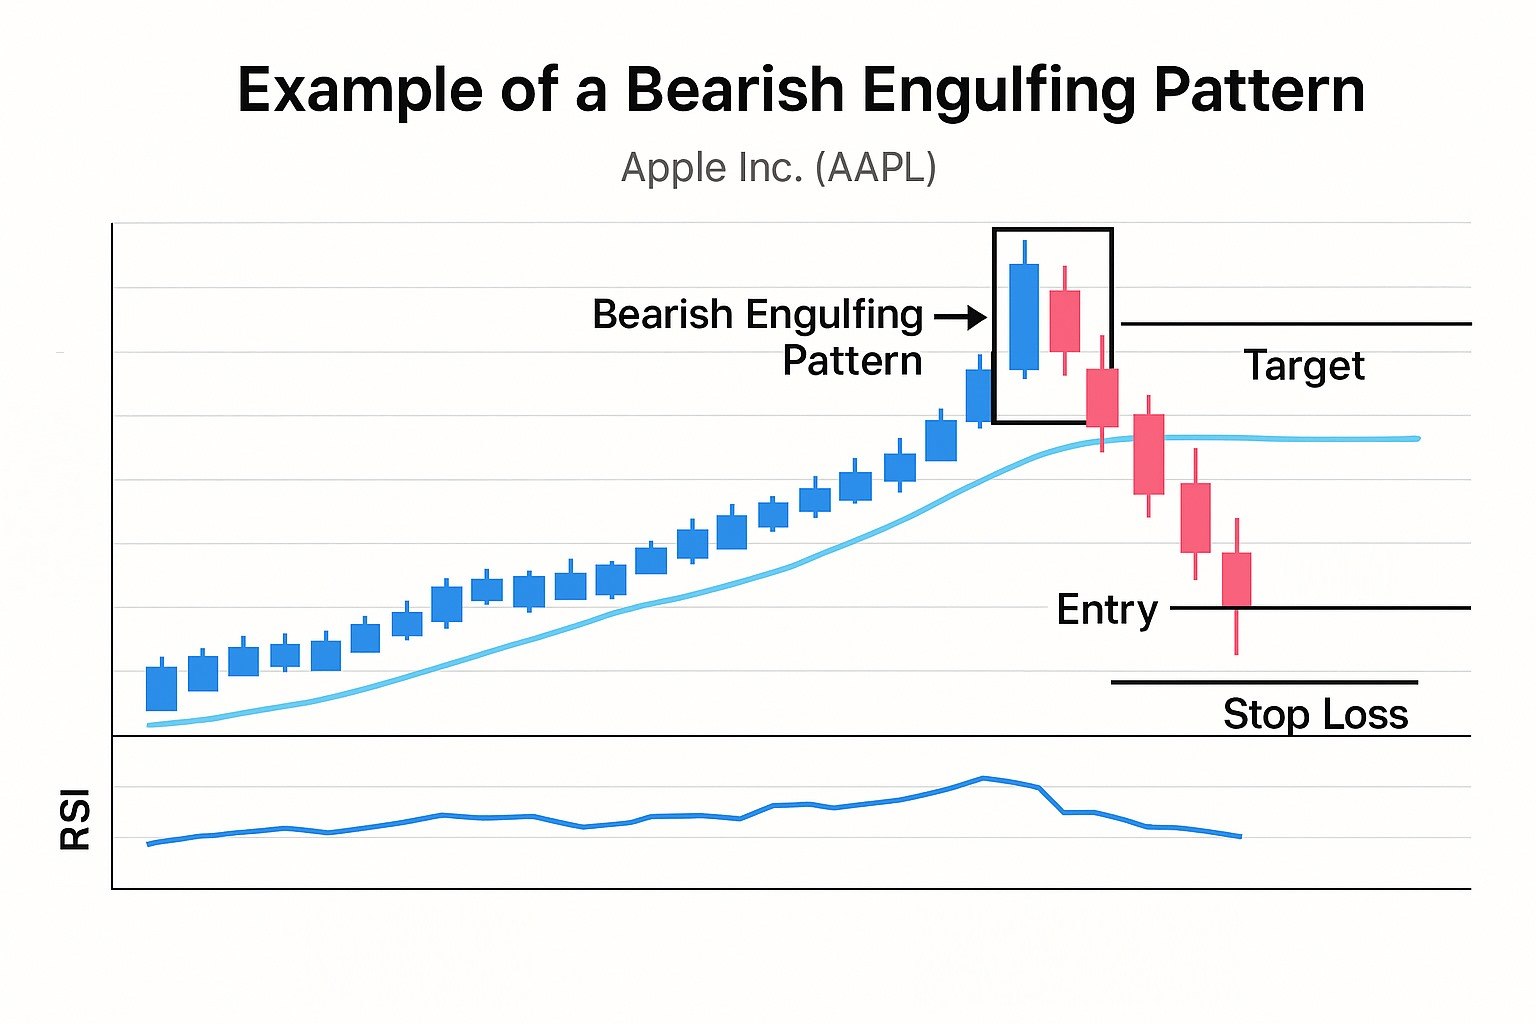
Take Apple Inc. (AAPL). On a daily chart, imagine a strong uptrend. A white candle appears. Next day? A fat black candle’s body swallows it whole — classic bearish engulfing candlestick.
With RSI over 70 and a flattening moving average, it’s your signal. Enter near the closing price. Set your stop loss above the candle’s high. Look for a 1:2 risk-reward ratio. That’s how pros handle price action.
This example speaks volumes. The setup is clean. The reversal is clear. These are the charts you want. Volume spikes? Even better.
)
Similar Chart Patterns
The bearish engulfing pattern has relatives. Some look similar but have unique vibes:
- Dark cloud cover
- Shooting star
- Bearish harami
- Three black crows
- Tweezer top
- Double top
- Head and shoulders
- Evening star
Mastering these patterns improves your ability to read market moves. Want the flip side? Study the bullish engulfing candlestick pattern — it’s the bullish sibling.
Comparing Bar Charts and Candlestick Charts
Both chart types show open, high, low, and closing price. But candlestick charts do it with more flair.
With bar charts, you get numbers. With candlesticks, you get emotion. Candlestick patterns like the bearish engulfing pattern make it easier to spot bearish sentiment and shifts in price direction.
Reliability and Confirmation of the Bearish Engulfing Pattern
Is the bearish engulfing pattern always right? Nope. But it’s solid—especially with context. Strong uptrend? Volume spike? RSI confirmation? That’s your trifecta.
Don’t trust just two candles. Confirm with trend indicators. Analyze the full chart. Risk management should always back you up. False signals love careless traders.
Choosing the Right Time Frame
Time frame matters. Day trader? Stick to the 5- or 15-minute chart. Swing trader? Look at daily or weekly candles.
The bearish engulfing pattern occurs on the daily chart. It shows clearer reversals. Whatever you choose, your trading strategy should match your chosen time frame.
Conclusion
The bearish engulfing pattern is more than a chart shape—it's a voice. It tells you when the bulls are losing control. Use it wisely. Confirm it carefully. Respect your stop loss. Combine it with other indicators and your trading arsenal becomes stronger.
FAQs
What is a bearish engulfing pattern?
A bearish engulfing pattern is a two-candle reversal signal where a large bearish candle fully covers the prior bullish candle’s body, indicating potential trend reversal.
How reliable is the bearish engulfing pattern?
It’s considered reliable when confirmed by high trading volume, supportive technical indicators like RSI or MACD, and overall market or chart context.
What happens after a bearish engulfing candle?
Usually, the price declines as sellers gain control, bullish sentiment weakens, and traders may initiate short positions anticipating further downward movement.
What is the success rate of the engulfing pattern?
The bearish engulfing pattern has about a 65% success rate when paired with proper risk management and confirmation through additional technical analysis tools.