Bullish Engulfing Pattern: Definition, How it Works, Trading, and Examples
)
The bullish engulfing pattern is a strong reversal signal in technical analysis. Traders use this candlestick pattern to spot the end of a bearish trend. When it appears, it may be time to prepare for a bullish move.
Table of Contents
What Is a Bullish Engulfing Pattern
Key Takeaways
Understanding a Bullish Engulfing Pattern
Bullish Engulfing Pattern vs. Bearish Engulfing Pattern
Example of a Bullish Engulfing Pattern
Bullish Engulfing Candle Reversals
How to Trade the Bullish Engulfing Pattern
Limitations of Using Engulfing Patterns
Conclusion
FAQs
What Is a Bullish Engulfing Pattern
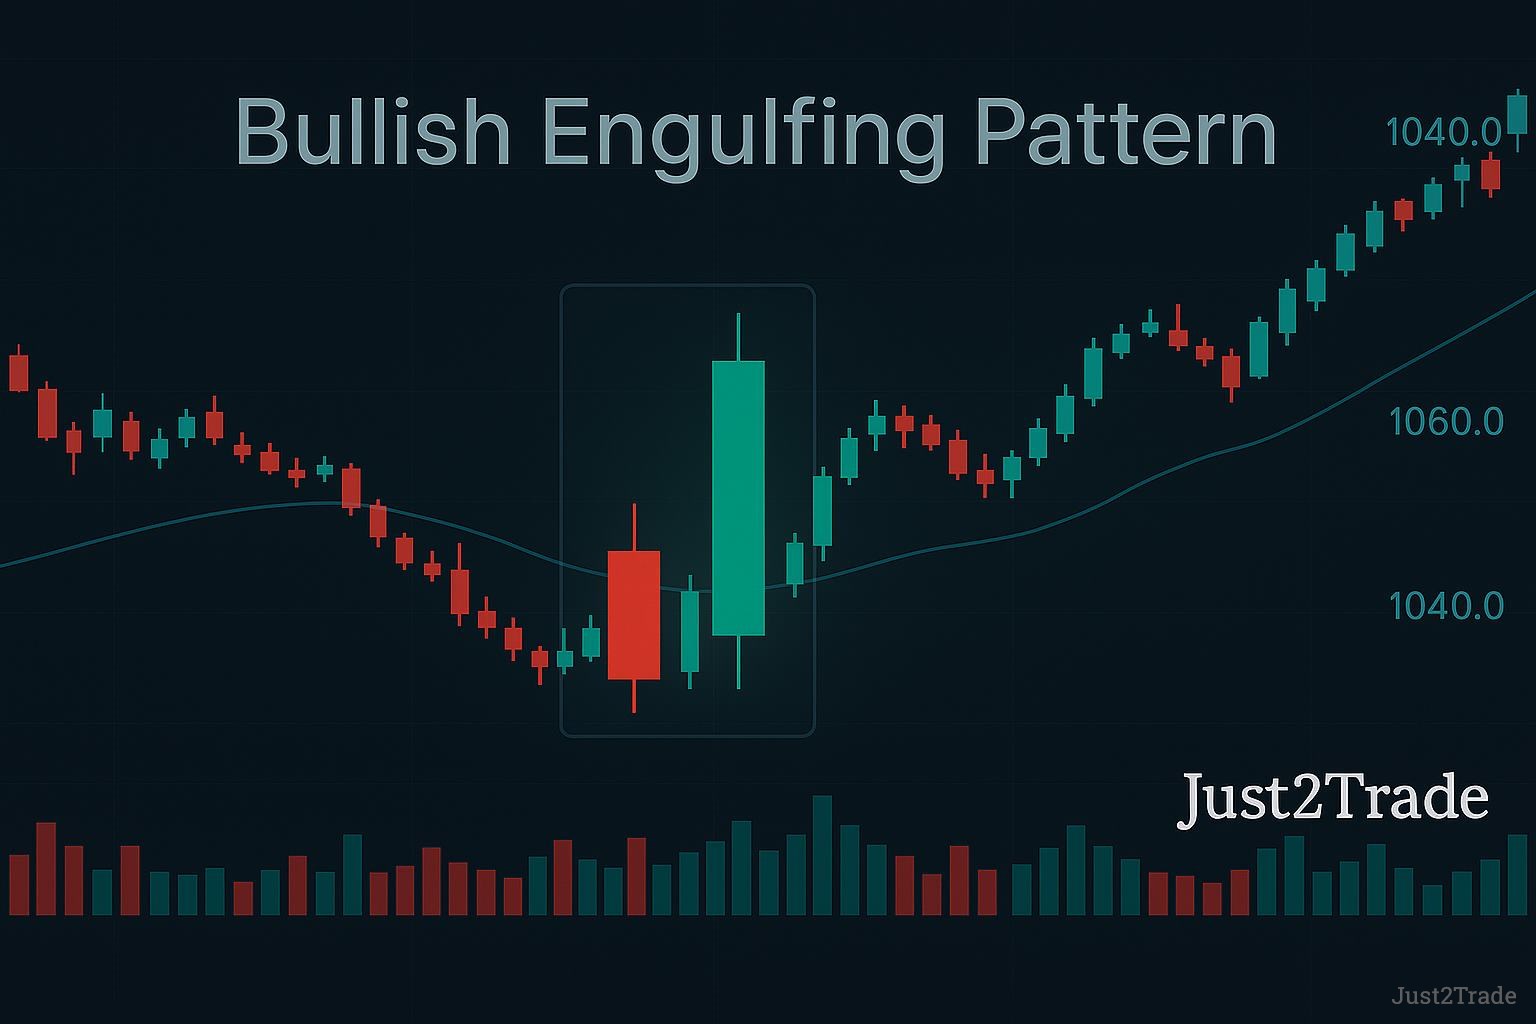
A bullish engulfing pattern forms over two trading days and signals a potential shift in market direction. It typically emerges during bearish engulfing patterns, right when sellers seem firmly in control. The first candle is small and red (or black), representing continued downside pressure. Then comes a surprise — a much larger green (or white) candlestick that opens lower but closes above the previous day's high.
This engulfing candle doesn’t just overshadow the earlier red one — it swallows it whole. That move tells a story: buyers have charged in, overpowering the sellers. The wider body of this green candlestick shows strong demand and growing optimism. It marks a clear shift in market sentiment. Traders interpret it as a decisive buy signal. A bullish engulfing pattern appears after persistent bearish control, offering a strong hint of reversal.
)
Key Takeaways
- The bullish engulfing pattern forms when a large green candlestick follows a smaller red one.
- It gains strength when preceded by several bearish candlesticks.
- The pattern works best in daily or weekly charts when the second candlestick closes above the midpoint of the first.
Understanding a Bullish Engulfing Pattern
This setup features a two-candle reversal pattern, often spotted at the tail end of a downtrend. It begins with a gap down on the second day — a move that suggests sellers are tightening their grip. But then, momentum shifts. Buyers surge in, driving the price well above the previous day's high.
The result? A strong green candle that closes significantly higher, completely engulfing the red one before it. Often, there’s little to no upper wick, a detail that reinforces the strength of the buying pressure.
This dramatic flip from bearish to bullish control doesn't go unnoticed. It grabs traders' attention and stands out as a powerful signal. That’s why the bullish engulfing candle continues to be a favorite among price action enthusiasts.
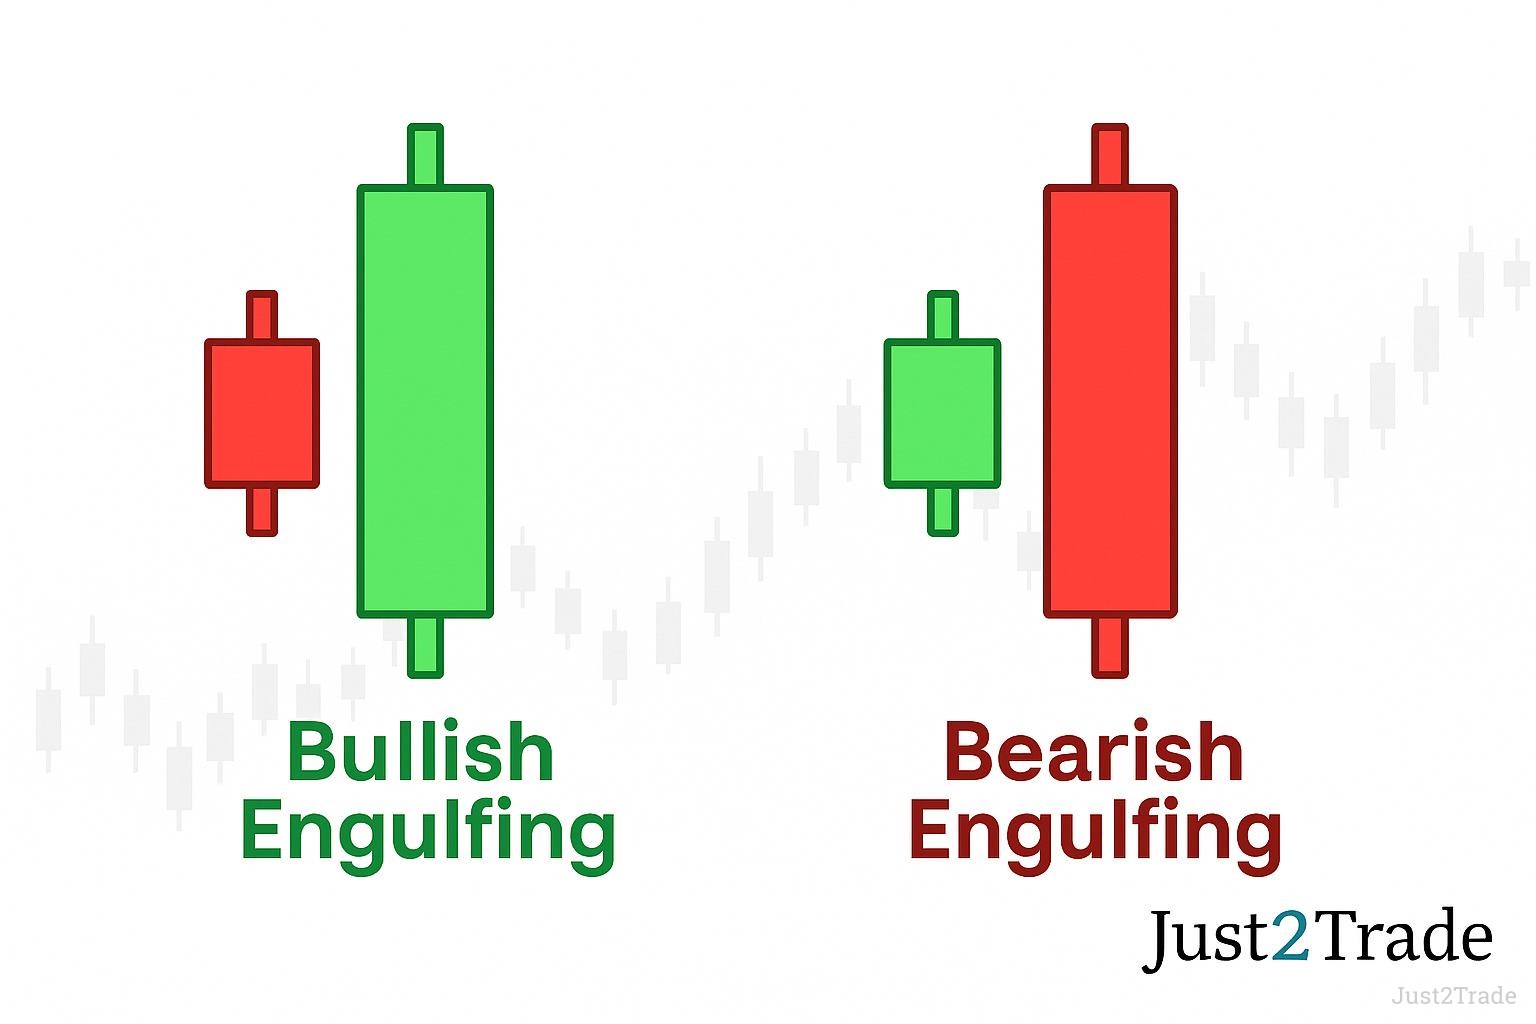
Bullish Engulfing Pattern vs. Bearish Engulfing Pattern
In contrast, the bearish engulfing pattern paints the opposite picture. It typically appears after an uptrend, acting as a warning sign for an upcoming price decline. The pattern starts with a small green candle, followed by a large red one that completely covers the previous body.
This engulfing move suggests that buyers have lost momentum while sellers are reclaiming dominance. Traders watching bear markets pay close attention to these signals. A bearish engulfing pattern occurs when sellers push back after a rise, flipping the sentiment and hinting at a shift to downward pressure.
)
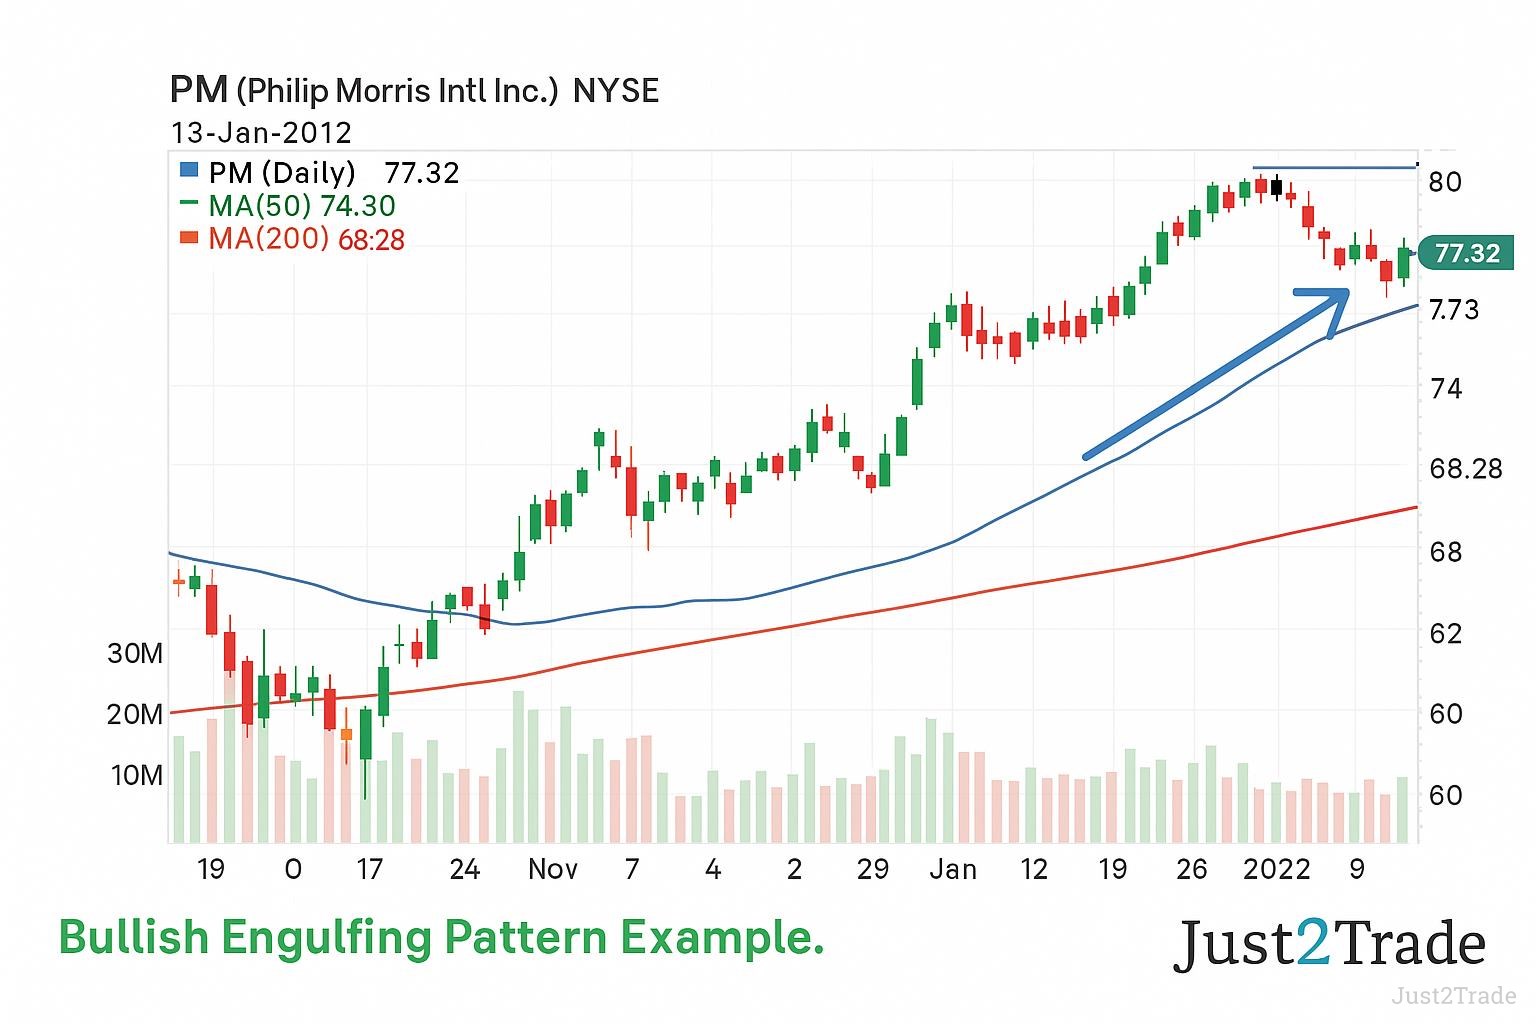
Example of a Bullish Engulfing Pattern
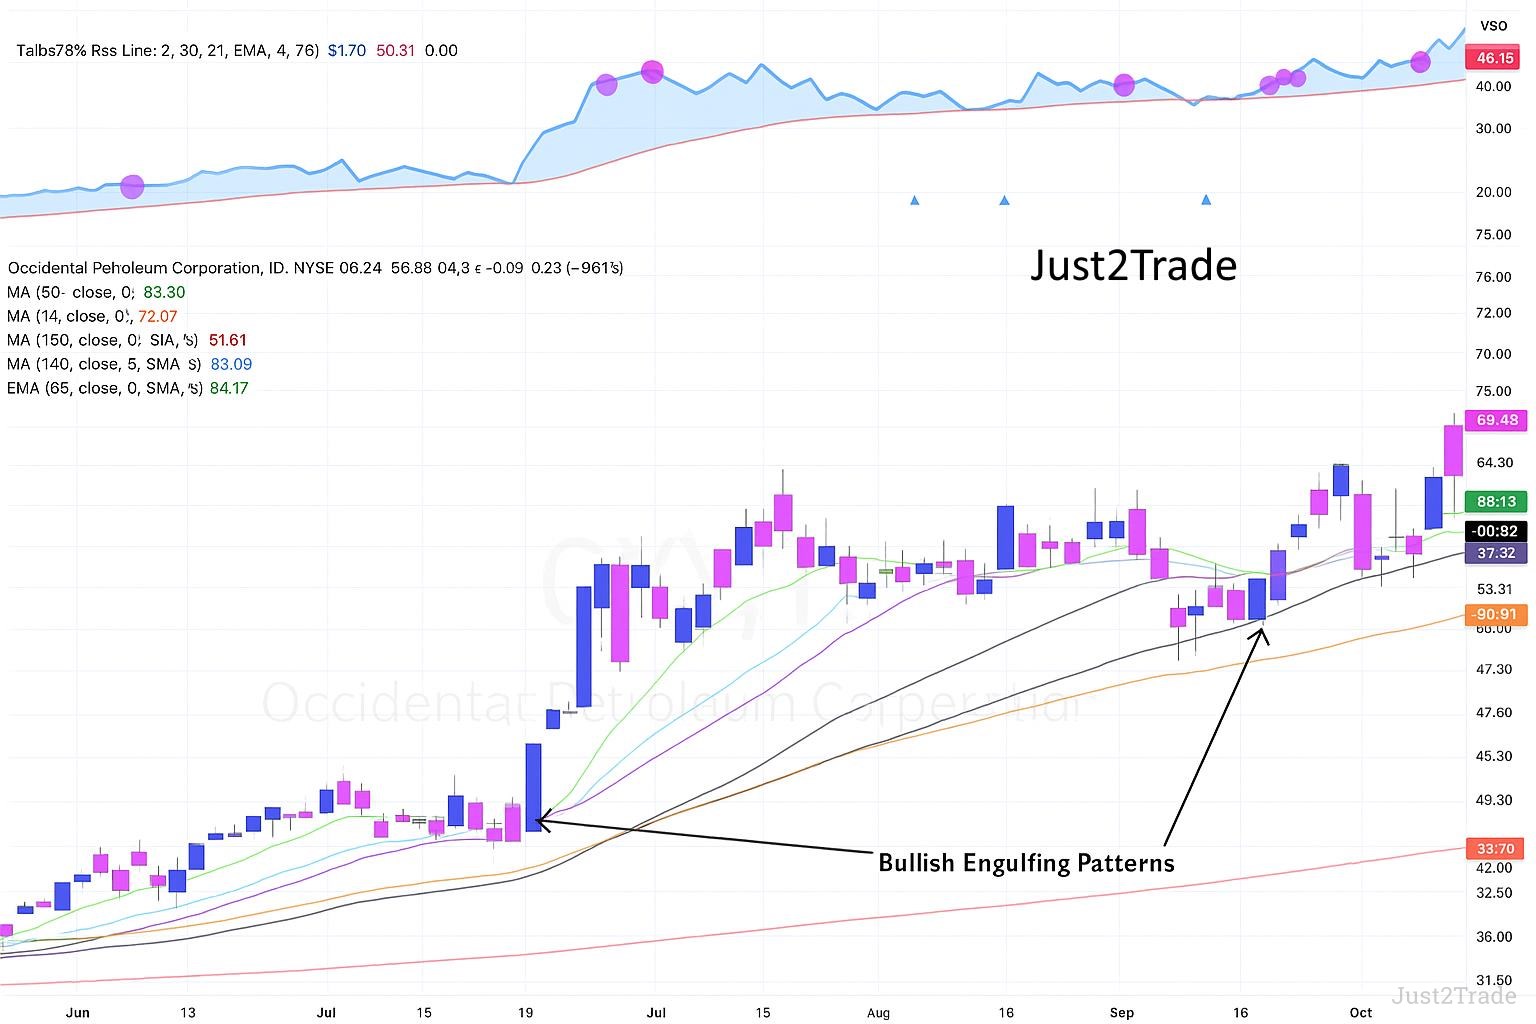
Take Philip Morris (PM) stock as a real-world case. Imagine the price declines for three consecutive sessions. Then, out of nowhere, a large green candle takes shape. It opens below the prior close but rallies to finish well above it — classic bullish engulfing behavior.
Such bullish engulfing patterns often signal that the tide is turning. What once looked like a continuous drop may now become an opportunity.
Depending on the charting platform, you might see green up days rendered in blue, or red candles shown in pink. But the message remains unchanged: the candle’s size and its position carry the meaning, not the color palette.
)
)
Bullish Engulfing Candle Reversals
When several red or black candlesticks appear in succession, the pressure within the trend intensifies. This extended bearish action sets the stage for something dramatic. Suddenly, a large bullish candle emerges, catching the market off guard and challenging the established direction.
That unexpected surge often marks the formation of a reliable bullish engulfing pattern. It’s not just a visual shift — it’s a psychological one.
Still, traders must view this setup in context. Support zones, market sentiment, and broader conditions all help validate whether this is a true trend reversal or a temporary reaction.
It’s never just about two candles; it’s about the powerful story they tell together.
How to Trade the Bullish Engulfing Pattern
This candlestick often signals a buying opportunity — but rushing in without a plan can be risky. Always begin by checking volume. High volume gives weight to the reversal.
If you're an aggressive trader, you might enter the moment the next candle opens. Prefer caution? Then wait for confirmation — place a buy-stop order slightly above the high of the second candle. Add extra confidence with tools like moving averages or trend lines. Support zones can also strengthen your setup.
Risk control is essential. A stop loss just below the engulfing candle helps protect your position if the trend fails.
Important: Never rely on one signal alone. Align the bullish engulfing pattern with broader market sentiment and complementary strategies. It’s a powerful pattern — but not invincible.
Limitations of Using Engulfing Patterns
Bullish engulfing patterns shine brightest in well-defined trends. In contrast, their reliability diminishes in sideways or volatile markets, where false signals become more frequent.
Another drawback? These patterns don’t provide a clear price target, which can complicate trade management. And due to their size, stop losses may need to be wider than usual — raising the risk.
To boost reliability, always pair engulfing setups with other tools. Indicators like RSI, MACD, and broader trend analysis help you sift out stronger, more trustworthy opportunities.
Pros & Cons:
| Pros |
Cons |
| Simple and easy to spot |
Prone to false signals in flat markets |
| Effective in strong trend reversals |
No fixed price target |
| Clear entry point |
Needs confirmation from other tools |
Conclusion
The bullish engulfing pattern is a classic signal of bullish reversal. It’s clear, easy to spot, and backed by psychology. But no signal works alone. Combine it with other strategies. Practice on a demo account. Get the feel before risking real capital.
FAQs
How reliable is bullish engulfing?
It’s fairly reliable in strong trends, but much weaker in sideways markets. Confirmation through volume or other indicators can significantly improve its success rate.
What happens after bullish engulfing?
Typically, prices bounce higher shortly after the signal. However, the outcome depends heavily on context, market conditions, and confirmation from technical indicators.
How do you trade bullish engulfing?
Traders often buy on the next candle’s open or above the high of the pattern. Always use a stop loss and confirm with additional indicators.
What is the psychology behind the bullish engulfing pattern?
It reflects a shift in sentiment. Bears lose control, bulls step in with strength, and the strong green candle signals a decisive change in direction.
What is a good bullish engulfing pattern?
A textbook pattern includes a large green candle following several small red ones in a downtrend, supported by high volume and near a support zone.
What is the win rate of engulfing?
With proper confirmation and in trending markets, win rates generally range from 55% to 65%, depending on the timeframe and market conditions.
What is the most accurate bullish pattern?
Many traders consider the combination of a double bottom followed by a bullish engulfing pattern one of the most reliable reversal signals available.