CAC 40 Technical Analysis: Mastering French Index Investment Opportunities
Table of Contents
Why Technical Analysis Works Exceptionally Well for CAC 40
Essential Technical Indicators for CAC 40 Trading
High-Probability Chart Patterns for CAC 40
Support and Resistance Mastery on CAC 40
Complete CAC 40 Trading Strategies
Advanced Technical Analysis Concepts for CAC 40
Risk Management and Position Sizing for CAC 40 Trading
Common Mistakes and How to Avoid Them
Conclusion: Integrating Technical Analysis for CAC 40 Investment Success
Frequently Asked Questions
The CAC 40 ranks among Europe's most technically responsive indices, offering traders actionable opportunities through disciplined technical analysis. From recognizable chart patterns at psychological round numbers to indicators like MACD and the Relative Strength Index, the French benchmark rewards those mastering its characteristics.
This guide delivers complete trading strategy frameworks designed for consistent results during Euronext Paris hours. It covers essential indicators with CAC-optimized parameters, support and resistance identification, candlestick pattern recognition, Fibonacci retracement techniques, and risk management.
Key Takeaways
- Technical analysis fundamentals tailored for CAC 40 behavior
- Essential indicators (MACD, RSI, Moving Averages) with optimized settings
- Proven chart patterns with volume confirmation techniques
- Three complete trading strategies: trend following, mean reversion, breakout
- Risk management integration for long-term capital preservation
Why Technical Analysis Works Exceptionally Well for CAC 40
Technical analysis, defined as the statistical evaluation of securities through market activity data including price and volume patterns, finds an ideal application in the CAC 40. The French stock index analysis comprises the 40 largest companies on Euronext Paris, operating within concentrated 09:00–17:30 CET hours that generate clean price action.
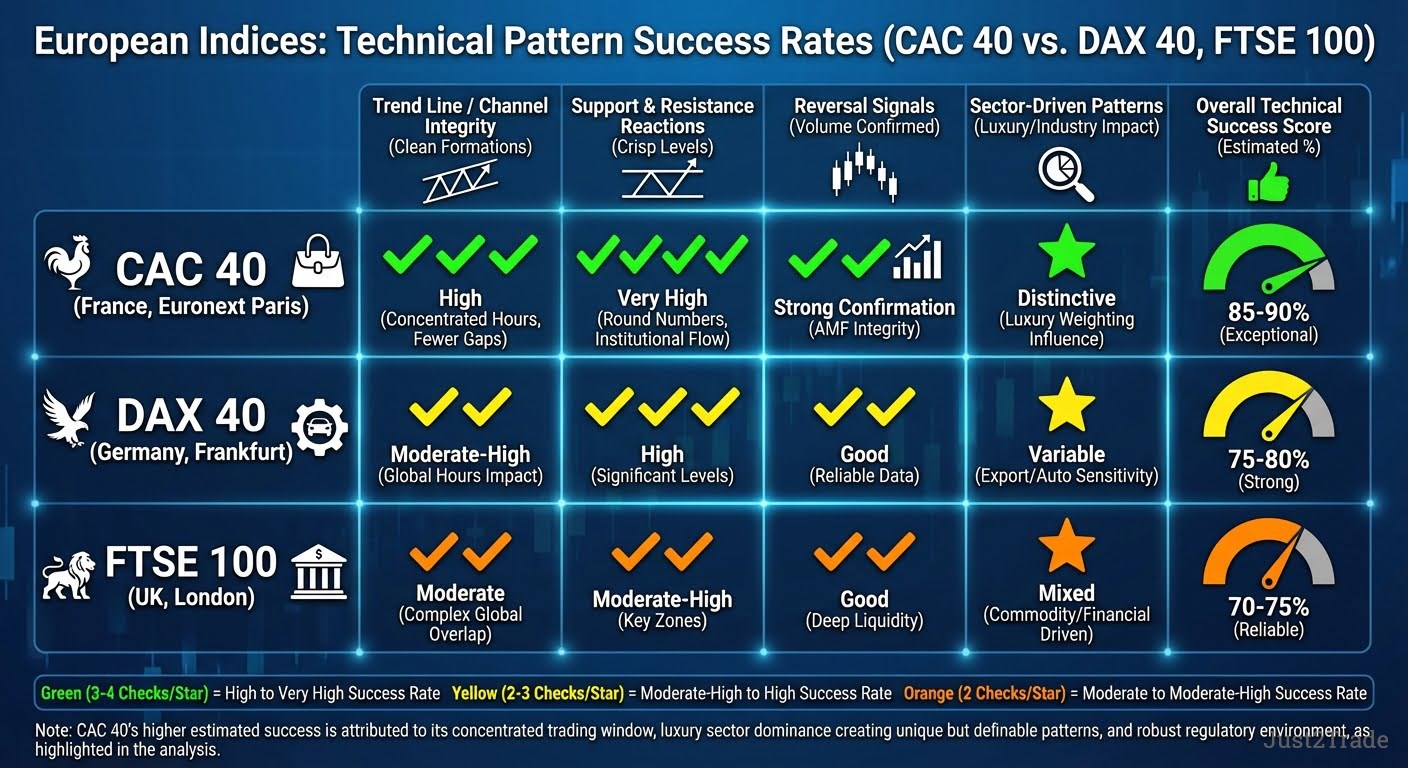)
The luxury sector weighting creates distinctive technical behavior, while regulation by the French Financial Markets Authority (AMF) ensures data integrity. Robust volume analysis from Euronext confirms that major reversals are typically preceded by identifiable technical signals.
Concentrated Trading Hours and Clean Price Action
The CAC 40's single European session creates a favorable environment for technical analysis and price action trading. Without Asian or U.S. overnight sessions fragmenting liquidity, charts display cleaner formations with fewer gaps.
All institutional flow concentrates into one window, producing defined trend lines and crisp support and resistance reactions. For CAC 40 price action trading, this concentrated liquidity is a structural advantage.
Luxury Sector Influence on Technical Patterns
The CAC 40's heavy luxury weighting (LVMH, L'Oréal, and Kering combined near 20%) creates unique technical characteristics. When these companies report earnings or experience sentiment shifts, the index tests major support and resistance levels.
Sector-driven moves respect round numbers (7,000, 7,500) as institutional orders cluster there. Technical analysis effectiveness improves when traders recognize luxury sector catalysts aligning with established formations.
Essential Technical Indicators for CAC 40 Trading
Effective CAC 40 technical analysis relies on three core instruments: MACD for momentum, the Relative Strength Index for extremes, and Moving Averages for trend structure. Each benefits from parameter adjustments for the CAC 40's concentrated hours, where standard settings produce lagging signals. The table below highlights standard versus optimized parameters for trading CAC 40 index positions.
| Indicator |
Standard |
CAC 40 Optimized |
Rationale |
| MACD |
12-26-9 |
8-17-9 (intraday) / 12-26-9 (swing) |
Faster response in concentrated session |
| RSI |
14-period |
9-period |
Quicker signals in 8.5-hour window |
| Short MA |
20 SMA |
20 EMA |
Captures recent price action faster |
| Medium MA |
50 SMA |
50 SMA |
Effective for CAC 40 swing trades |
| Long MA |
200 SMA |
200 SMA |
Institutional trend filter |
MACD — Momentum and Trend Identification
)
The MACD is calculated as the 12-period EMA minus the 26-period EMA with a 9-period signal line. For CAC 40 day trading strategies, the optimized 8-17-9 parameters generate faster crossovers without noise.
Three signal types drive decisions: bullish/bearish crossovers, histogram expansion indicating momentum acceleration, and divergences where MACD opposes price direction. When MACD bullish crossovers coincide with bounces off the 50 SMA, the confluence produces high-conviction entries.
Historically, such crossovers preceded rallies, including moves from 6,600 to 7,100, by one to two sessions, providing actionable French index technical indicators signals.
RSI — Overbought/Oversold and Divergence Trading
)
The Relative Strength Index is calculated as
RSI=100−(1+RS100)
where RS equals average gain divided by average loss. For CAC 40 chart analysis, a 9-period RSI delivers faster signals. Readings above 70 flag overbought conditions; below 30 indicates oversold.
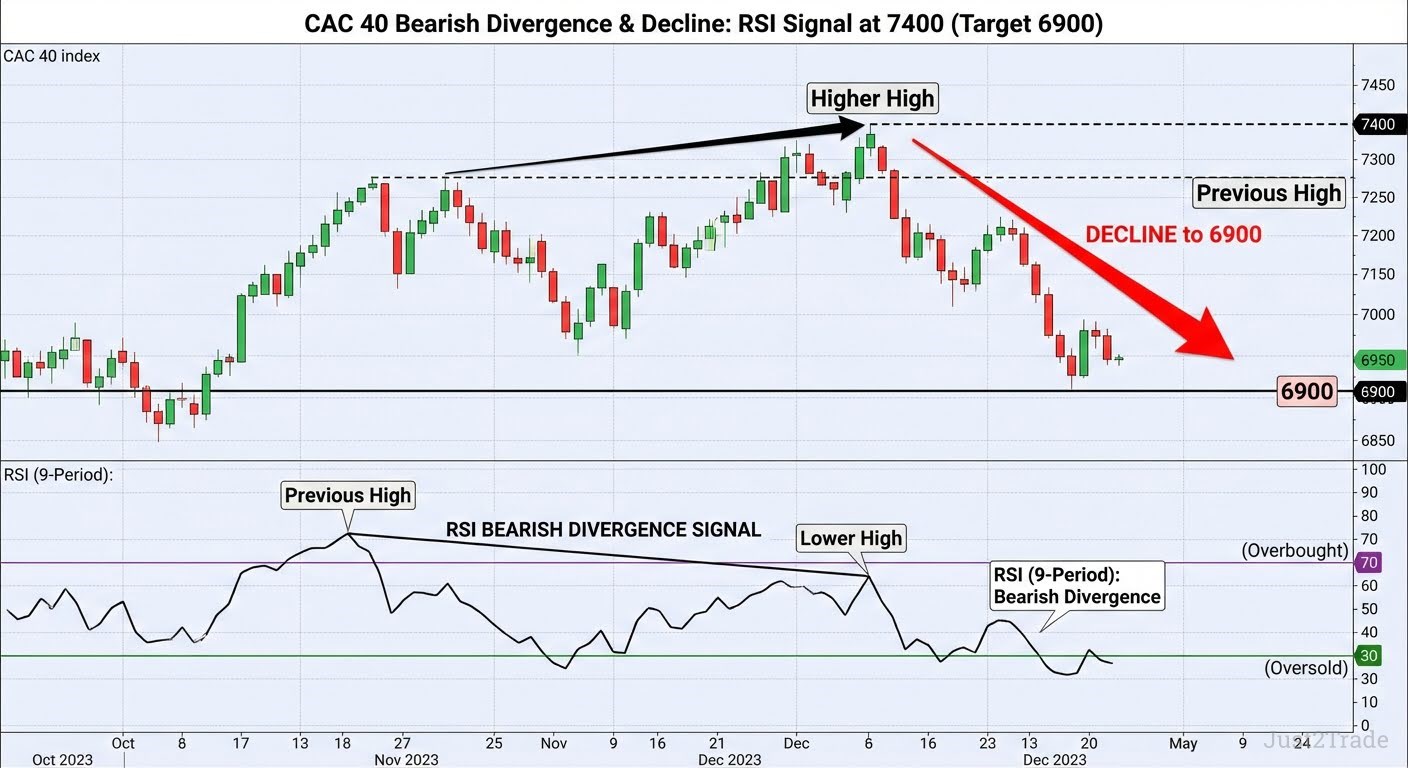
The most powerful application is divergence: price printing a higher high while RSI prints a lower high signals bearish reversal. These divergence signals gain reliability at support and resistance near round numbers (6,500, 7,000, 7,500), creating high-probability entries for CAC 40 technical trading.
Moving Averages — Dynamic Support, Resistance, and Trend
)
Moving averages serve as trend identifiers, dynamic support/resistance, and crossover generators in CAC 40 trading strategies. The optimal combination: 20 EMA (short-term), 50 SMA (medium-term), 200 SMA (long-term filter).
During luxury sector-driven uptrends, CAC 40 price consistently bounces off the 50 SMA. The golden cross (50 SMA above 200 SMA) signals bullish phases; the death cross warns of weakness. Full alignment where price holds above the 20 EMA above the 50 SMA above the 200 SMA defines the strongest trending conditions for Euronext Paris trading entries.
High-Probability Chart Patterns for CAC 40
)
Chart pattern recognition translates market psychology into actionable CAC 40 chart analysis signals. The CAC 40 forms textbook patterns regularly due to its institutional base and concentrated liquidity.
Reversal formations (head and shoulders, double tops/bottoms) signal trend exhaustion, while continuation formations (triangles, flags, pennants) indicate resumption. Volume analysis through Euronext data is the essential confirmation layer. Success rates improve from roughly 60% to over 75% with proper volume and multi-timeframe confirmation.
Reversal Patterns — Head and Shoulders, Double Tops/Bottoms
)
The head and shoulders carries highest reliability on CAC 40 charts, especially at round numbers. The formation features three peaks consisting of a central "head" flanked by lower "shoulders" with a neckline connecting the troughs.
The measured target equals head-to-neckline distance projected from breakpoint: head at 7,400, shoulders near 7,200, neckline at 6,900 yields a target near 6,400. The inverse pattern marks bottoms identically.
Double tops form when price tests the same support and resistance twice and fails ("M" shape); double bottoms create a "W" at support. On the CAC 40, double tops frequently form at round-number resistance (7,000, 7,500). Confirmation requires neckline breaks on increased volume. Without it, the chart pattern lacks conviction and traps premature entries.
Continuation Patterns — Triangles, Flags, and Pennants
)
Continuation CAC 40 chart chart patterns signal trend resumption, offering entry points for CAC 40 trading strategies.
Three triangle variants dominate. Ascending triangles have flat resistance and rising support, signaling bullish bias.
Descending triangles have flat support and declining resistance, signaling bearish bias. Symmetrical triangles feature converging trend lines, where the breakout typically follows the prior trend.
Bull flags appear as tight downward channels after rallies; pennants resemble small symmetrical triangles.
On the CAC 40, flag patterns during luxury momentum phases show particular reliability. A rally from 6,800 to 7,100 followed by flag consolidation between 7,000–7,100 typically resolves upward with a measured target near 7,400.
Ascending triangles below round-number resistance frequently produce clean breakouts when volume analysis confirms participation through technical analysis validation.
Pattern Confirmation and False Breakout Avoidance
)
False breakouts threaten chart pattern traders, but confirmation protocols reduce this risk. First, volume analysis: valid breakouts require volume 30–40% above the 20-day average. Second, only close-based breaks qualify, as wick-only penetrations leave the pattern intact.
Third, retest entries (break, pullback to boundary, bounce) offer superior risk/reward. On the CAC 40, retests occur frequently during early European session hours. Implementing these three filters improves success rates from 60% to 75%+, significantly enhancing profitability.
Support and Resistance Mastery on CAC 40
)
Support and resistance forms the structural framework of CAC 40 technical analysis. These levels derive from previous highs/lows, psychological round numbers (6,500, 7,000, 7,500), volume profile nodes from Euronext data, and Fibonacci retracement levels. The strongest levels feature confluence where multiple types overlap.
Volume analysis validates strength, and levels tested on high volume carry greater significance. The role reversal principle, where broken support becomes resistance and vice versa, is essential for professional CAC 40 support resistance levels trading.
Identifying High-Probability Support and Resistance Levels
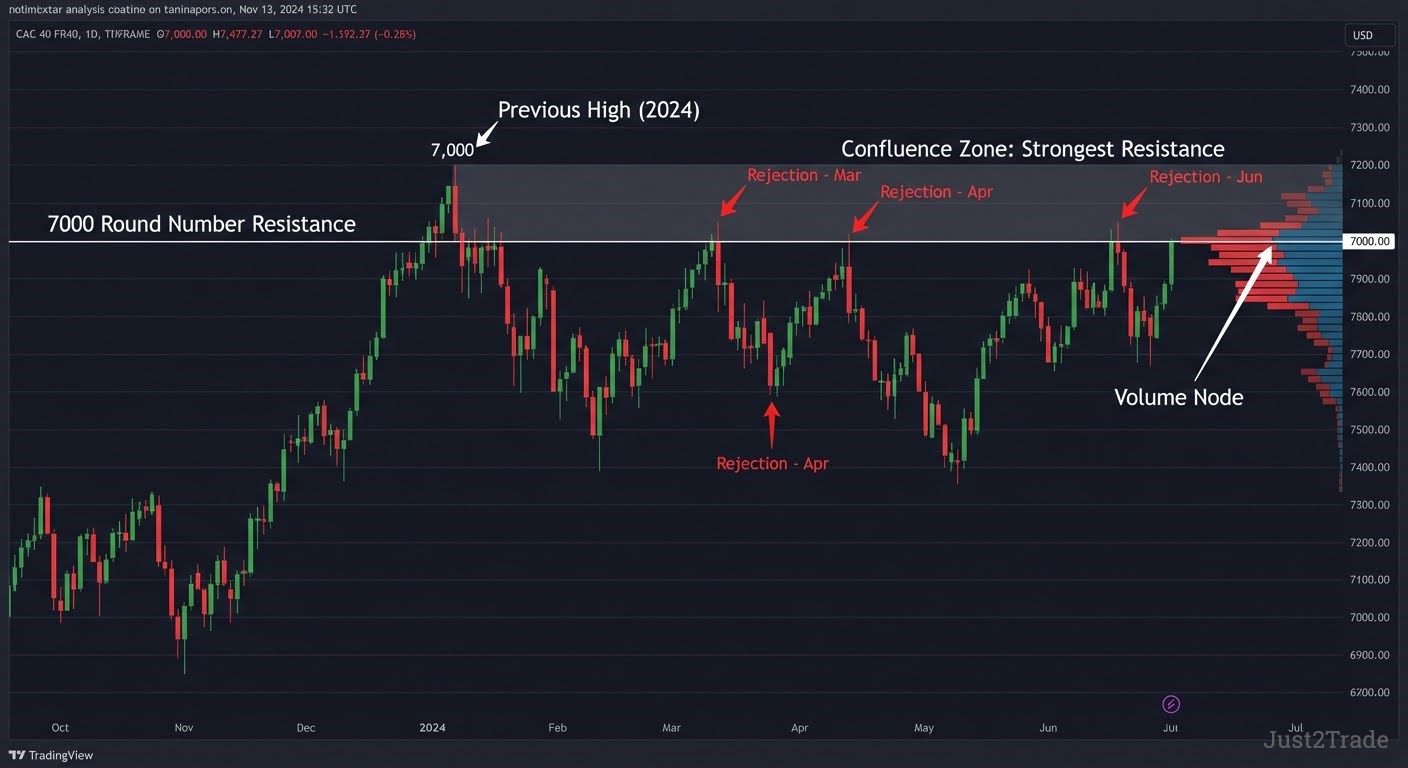)
Systematic identification begins with mapping swing highs and lows on daily and weekly charts, which serve as memory points where institutional orders shifted direction. Overlay round numbers (6,500, 7,000, 7,500), significant due to order clustering.
Apply volume analysis via volume profile to find high-transaction zones indicating institutional commitment. The highest-probability levels emerge at confluence zones. When a previous high, the 7,000 round number, and a volume node align at the same zone, the support and resistance becomes extremely difficult to penetrate without substantial catalysts.
Trading Bounces at Support and Resistance
)
Bounce trading at major support and resistance yields 70%+ win rates with selective application. Wait for price to approach a strong level and produce a reversal candlestick pattern — bullish engulfing or hammer at support; bearish engulfing at resistance.
Enter on the confirming candle's close with stops 50–80 points beyond the level. Target the next major level. A bullish engulfing at 6,800 triggers entry at 6,820, stop at 6,750 (70 points), target at 7,100 (280 points) — a 4:1 reward-to-risk ratio ideal for CAC 40 investment opportunities.
Breakout Trading and False Breakout Avoidance
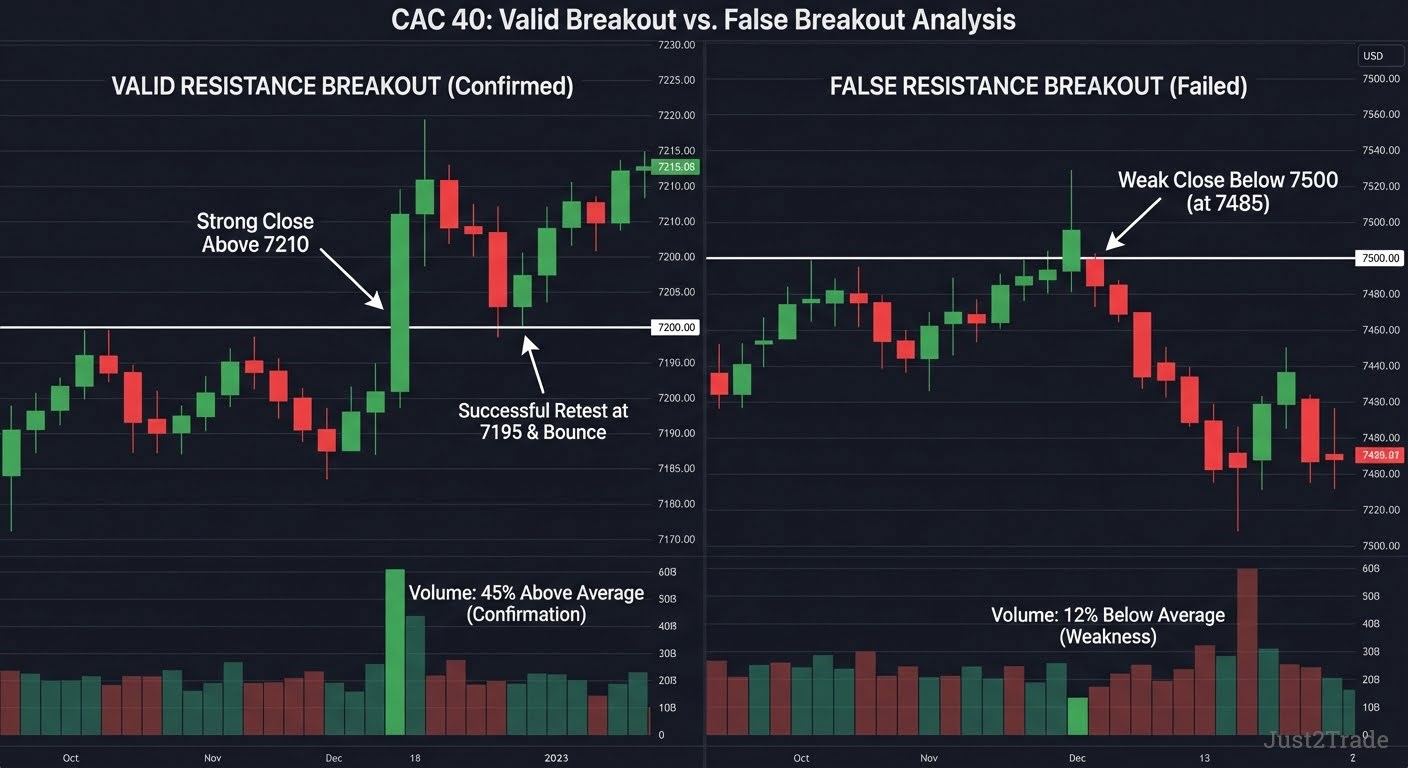)
Support and resistance breakout trading captures explosive moves when the CAC 40 exits established ranges. Valid breakouts require volume 30%+ above average and a strong close beyond the level.
Retest trading adds confirmation. After the break, price returns to the former boundary before accelerating. This role reversal is critical for CAC 40 technical trading. A 7,200 resistance break on 45% above-average volume with a successful retest at 7,195 confirms validity, contrasting sharply with weak probes on below-average volume analysis readings.
Complete CAC 40 Trading Strategies
)
Translating technical analysis tools into systematic trading strategy frameworks creates repeatable processes. Three strategies cover primary CAC 40 market regimes: trend following, mean reversion, and breakout. Each integrates indicators, chart patterns, support and resistance, and volume analysis with explicit entry/exit rules and risk parameters.
These systems work for both day trading during 09:00–17:30 CET and swing approaches. Each accounts for Euronext Paris trading dynamics, luxury sector correlation, and the index's round-number tendency. Backtesting on historical data is essential before live deployment.
Trend Following Strategy — Riding CAC 40 Luxury Sector Momentum
)
This trading strategy captures sustained directional moves when luxury heavyweights lead.
- Trend: All moving averages aligned, price above 20 EMA above 50 SMA above 200 SMA.
- Entry: MACD bullish crossover (8-17-9 intraday) while price holds above 50 SMA.
- Stop: Below recent swing low or 50 SMA, typically 80–120 points.
- Management: Trail below the 20 EMA; exit on MACD bearish crossover.
- Profile: 45–50% win rate, winners averaging 2.5–3× losers.
When LVMH and luxury peers surge, this captures multi-day trending moves characteristic of CAC 40 price action trading momentum phases, with exits at 7,400 from 6,950 entries producing substantial point gains.
Mean Reversion Strategy — Trading CAC 40 Extremes at Round Numbers
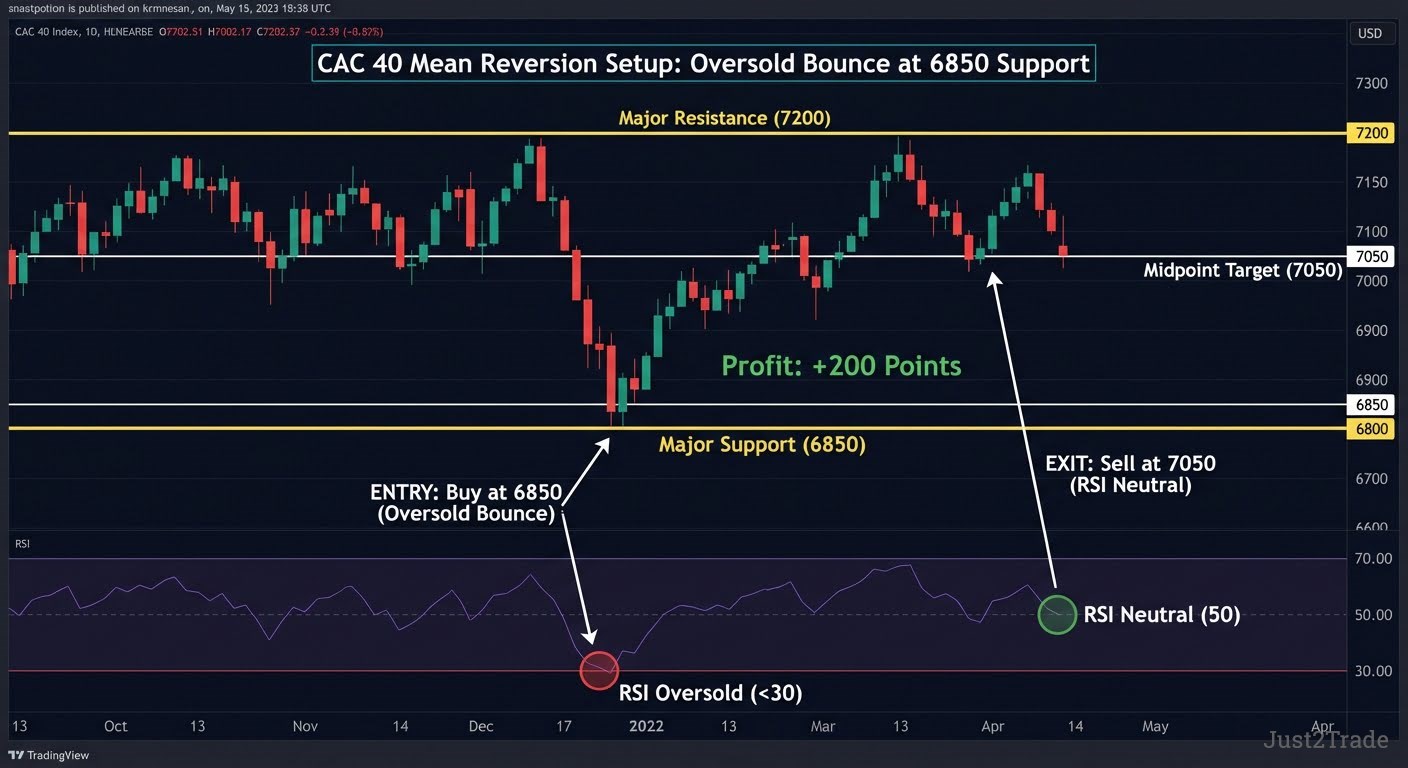)
This trading strategy exploits CAC 40 reversions from extremes at round numbers.
- Setup: Price near major support and resistance round number with Relative Strength Index (9-period) below 30 or above 70.
- Entry: Reversal candlestick pattern (engulfing, hammer) at the level; enter on confirming close.
- Stop: 60–80 points beyond the round number.
- Target: Range midpoint or 50 SMA; exit when RSI returns to 45–55 neutral zone.
- Profile: 68–72% win rate, 1.5–2:1 reward-to-risk.
This contrarian approach buys weakness at 6,500/7,000 support and sells strength at resistance, performing strongly in ranging markets and providing steady returns from CAC 40 support resistance levels reactions.
Breakout Strategy — Capturing CAC 40 Volatility Expansion
)
This trading strategy profits from volatility expansion out of consolidation.
- Identification: Chart pattern consolidations such as triangles, rectangles, and pennants on 4-hour or daily charts.
- Entry: Break beyond the pattern boundary with volume analysis confirming 30%+ above average. Alternatively, enter on retest.
- Stop: Inside the pattern beyond the opposite boundary, 80–120 points.
- Target: Measured move — widest pattern point projected from breakout. A 150-point triangle breaking at 7,050 targets 7,200.
- Profile: 2–4 monthly trades, 2.5–4:1 reward-to-risk.
This excels during transitions from consolidation to trend, particularly around luxury earnings seasons that catalyze CAC 40 directional moves.
Advanced Technical Analysis Concepts for CAC 40
)
Advanced technical analysis elevates CAC 40 chart analysis to professional quality. Fibonacci retracement provides mathematical precision for pullback entries, pure price action eliminates indicator lag, and candlestick pattern mastery refines timing.
Multiple timeframe analysis ensures trades align with dominant trends while achieving precision entries. These concepts, applied during the European session, represent the edge separating consistently profitable traders from the inconsistent majority.
Fibonacci Retracement for Precision CAC 40 Entries
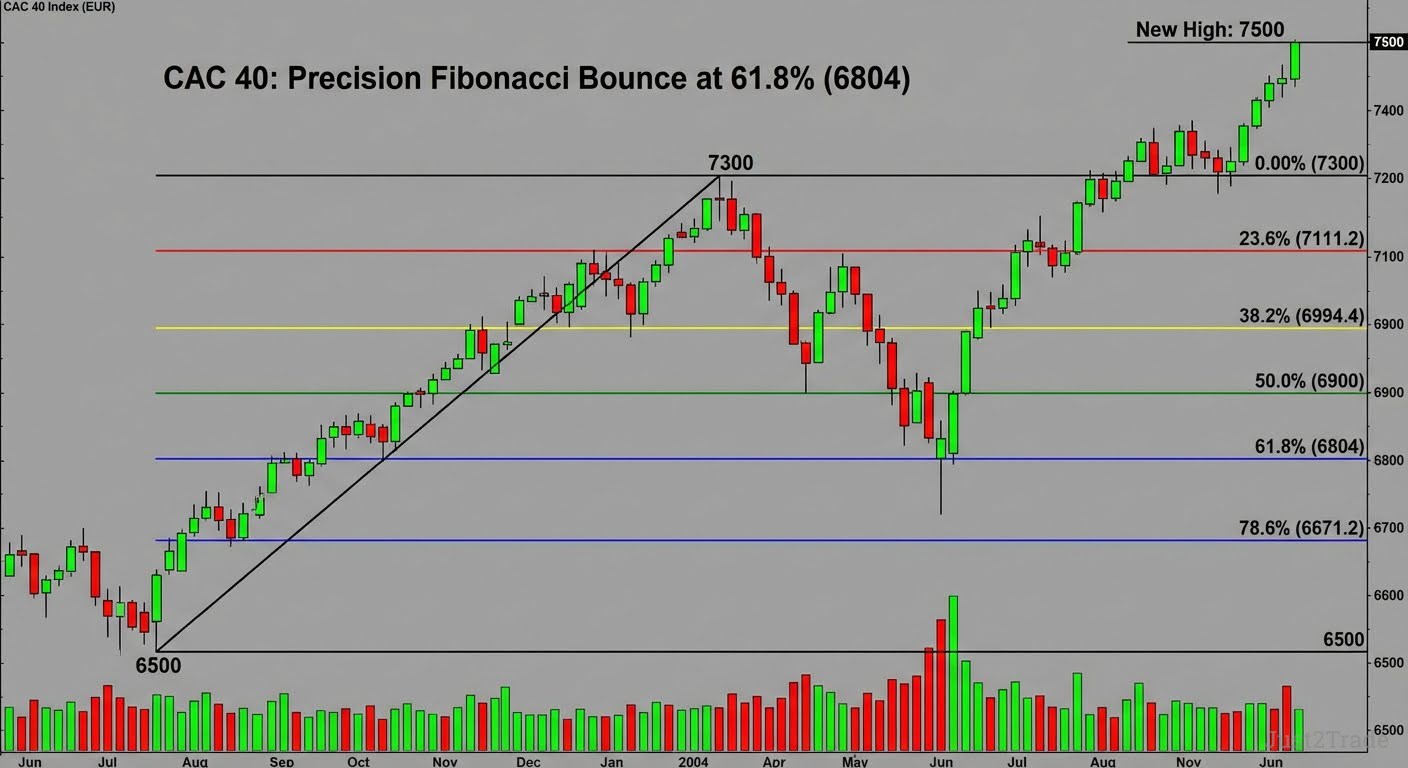
Fibonacci retracement levels at 23.6%, 38.2%, 50%, 61.8%, and 78.6% identify potential support during pullbacks. On the CAC 40, the 50% and 61.8% levels show particularly strong adherence, often aligning with independent support and resistance for confluence entries.
A rally from 6,500 to 7,300 places the 61.8% retracement at approximately 6,805. If aligning with horizontal support and a volume node, this creates a high-probability long entry. Fibonacci retracement works best layered onto existing technical analysis rather than as a standalone system.
Pure Price Action Trading on CAC 40
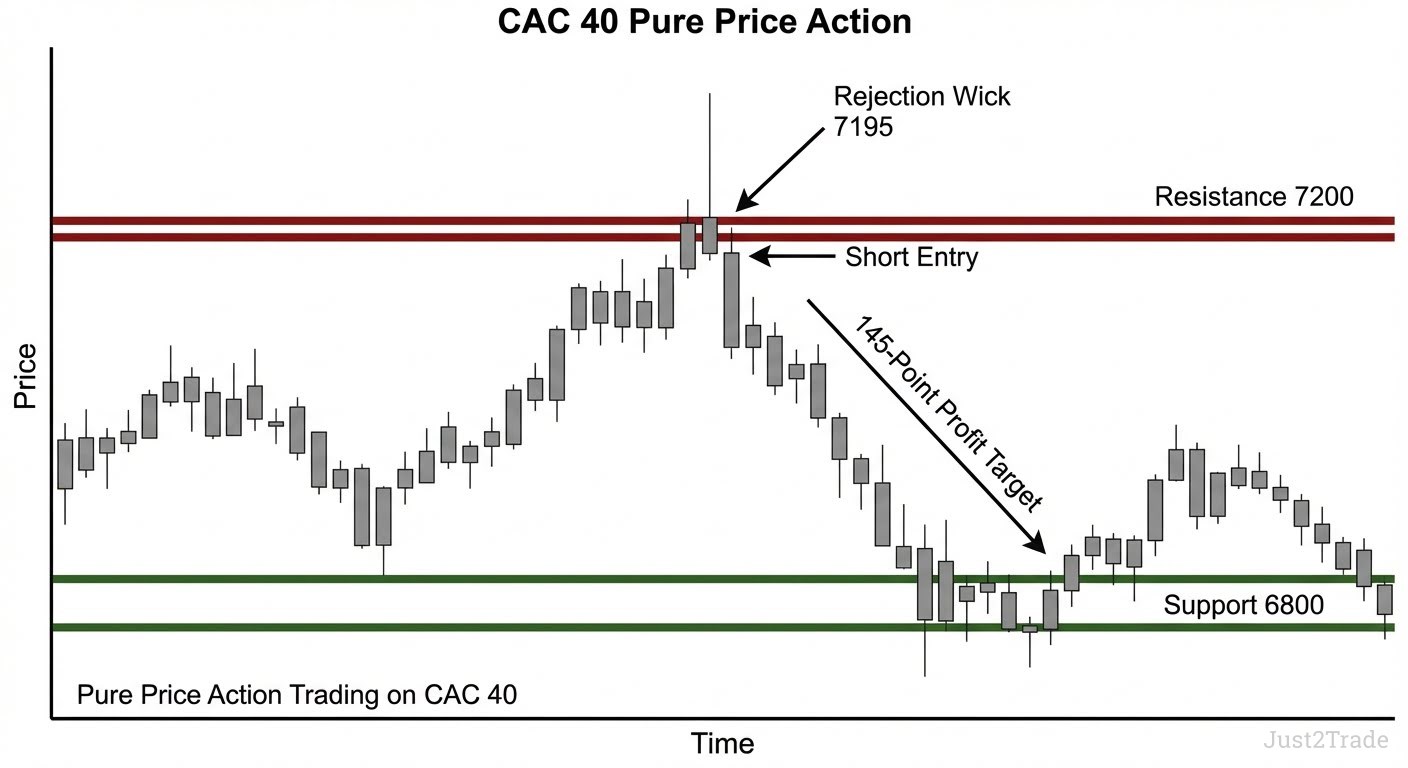
Pure price action eliminates all indicators, relying on price structure, support and resistance reactions, and candlestick pattern formations. This minimalist approach provides clarity. No lagging signals, direct interpretation of buying and selling pressure.
During the European session, CAC 40 price action produces clean signals: a rejection wick at 6,800 support or bearish engulfing at 7,200 resistance provides sufficient information. Market structure (higher highs/lows vs. lower highs/lows) and trend line positioning establish the bias for individual setups.
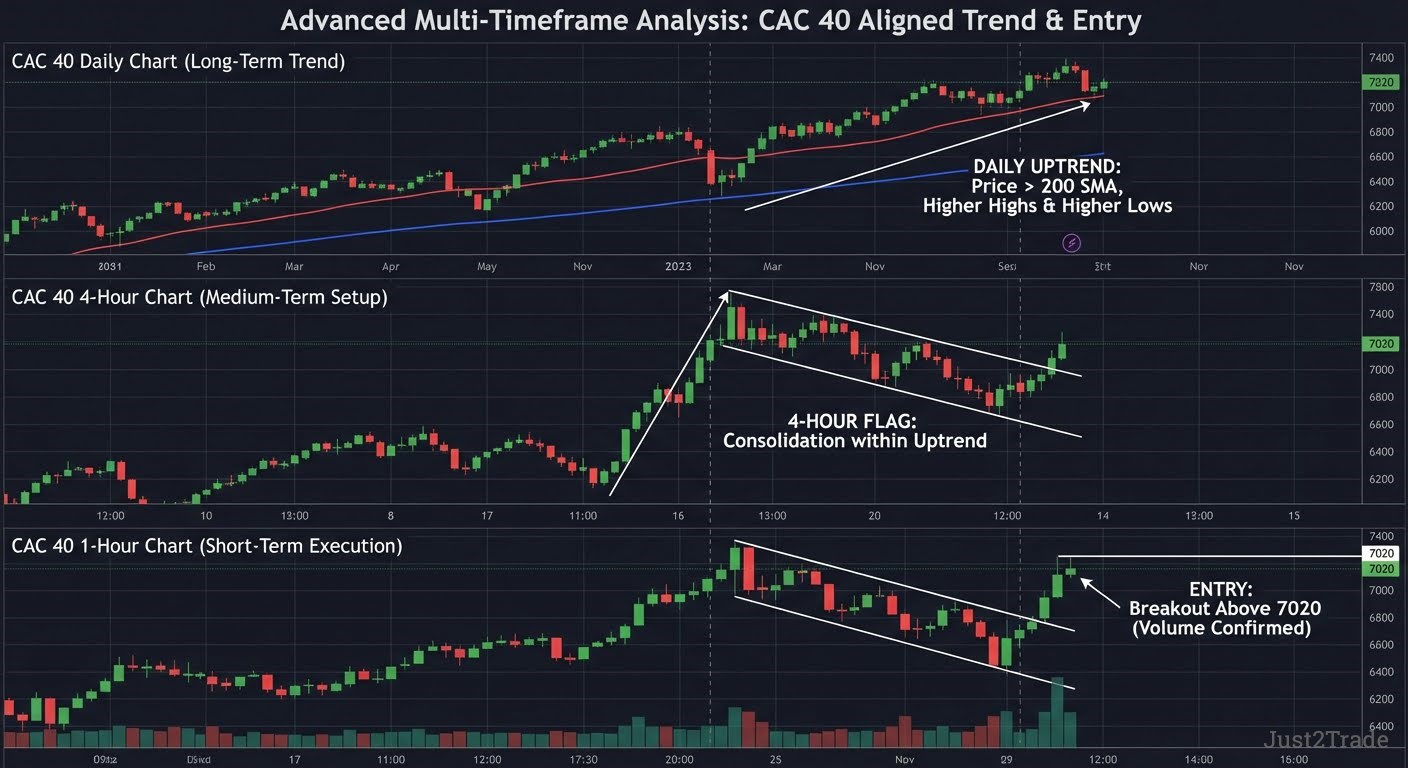
Multiple Timeframe Analysis for CAC 40
)
Multiple timeframe analysis is the professional standard for CAC 40 trading strategies: daily charts establish trend direction and major support and resistance; 4-hour charts identify consolidation patterns; 1-hour charts provide precise entry triggers.
Trades qualify only when all timeframes agree. Daily uptrend above 200 SMA, 4-hour bull flag, 1-hour breakout entry. This technical analysis approach dramatically increases probability through timeframe confluence.
Risk Management and Position Sizing for CAC 40 Trading
No trading strategy survives without rigorous risk management. For CAC 40 traders using index instruments or exchange-traded fund vehicles (annual fees 0.15–0.40%, some offering 2× leverage), risk management must account for medium-to-high volatility. The foundational formula:
Position Size=Account Equity×Risk %/Stop Distance
Maximum drawdown limits (10%) and per-trade risk caps (0.5–2%) ensure survival through adverse periods while preserving capital for CAC 40 investment opportunities. Technical analysis informs every stop placement decision.
| Account Size |
Risk % |
Risk Amount |
Stop Distance |
Position Size |
| €10,000 |
1% |
€100 |
80 pts |
1.25 contracts |
| €25,000 |
1% |
€250 |
100 pts |
2.5 contracts |
| €50,000 |
1% |
€500 |
100 pts |
5.0 contracts |
| €100,000 |
1% |
€1,000 |
120 pts |
8.3 contracts |
Position Sizing Calculations for CAC 40
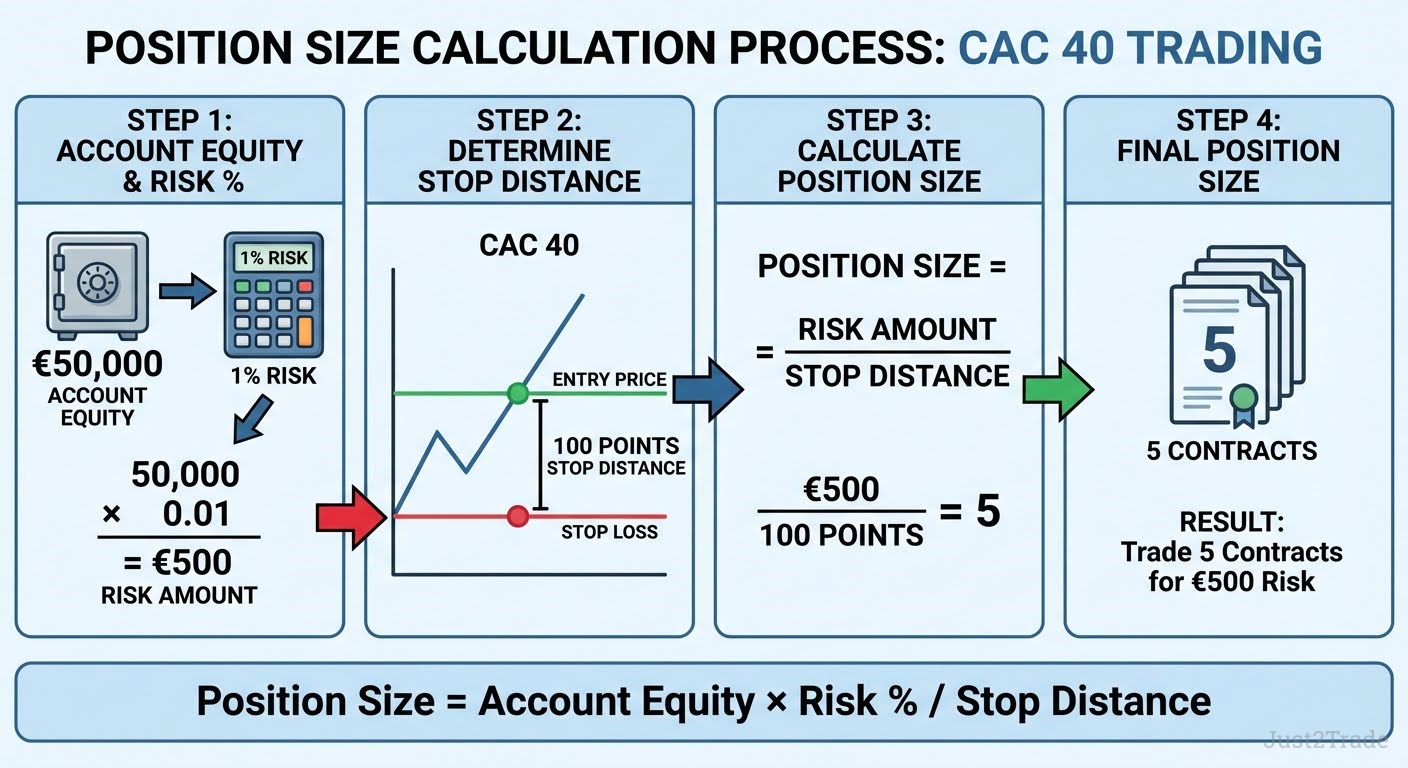
Formula Position Size=Account Equity×Risk %/Stop Distance applies before every entry. A €50,000 account risking 1% (€500) with a 100-point stop yields 5 contracts. Wider stops (150 points) reduce size to 3.3 contracts, maintaining identical risk. Fibonacci retracement levels at 23.6%, 38.2%, 50%, 61.8%, and 78.6% identify potential support during pullbacks.
Stop Loss Placement and Management for CAC 40
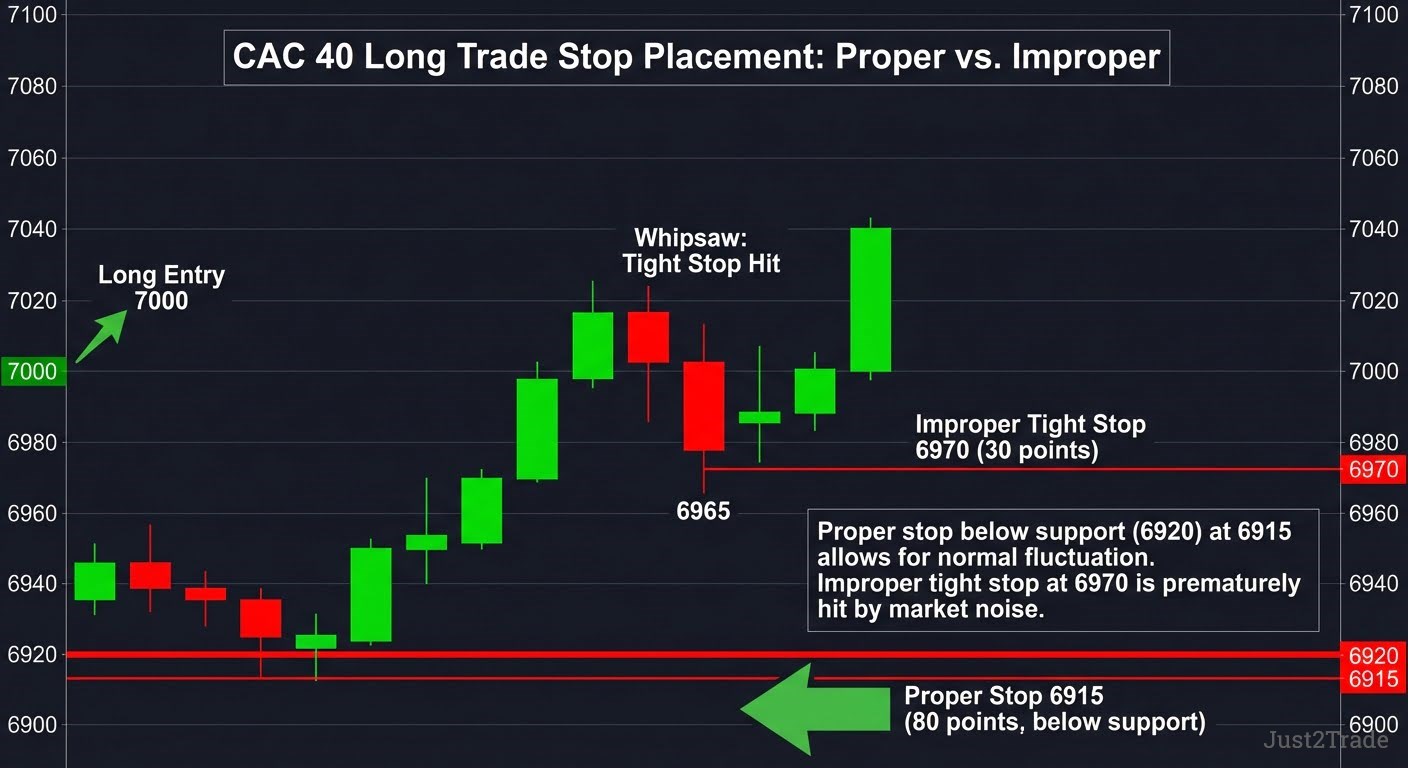
Stops derive from technical analysis invalidation points, beyond support and resistance, typically 50–80 points away. Pattern stops sit beyond formation boundaries. Volatility-based stops use 2×ATR. Management sequence: initial stop at invalidation, breakeven after 1.5:1 R/R, then trail using the 20 EMA. Day trading stops range 60–100 points; swing stops 100–150 points on the CAC 40.
Common Mistakes and How to Avoid Them
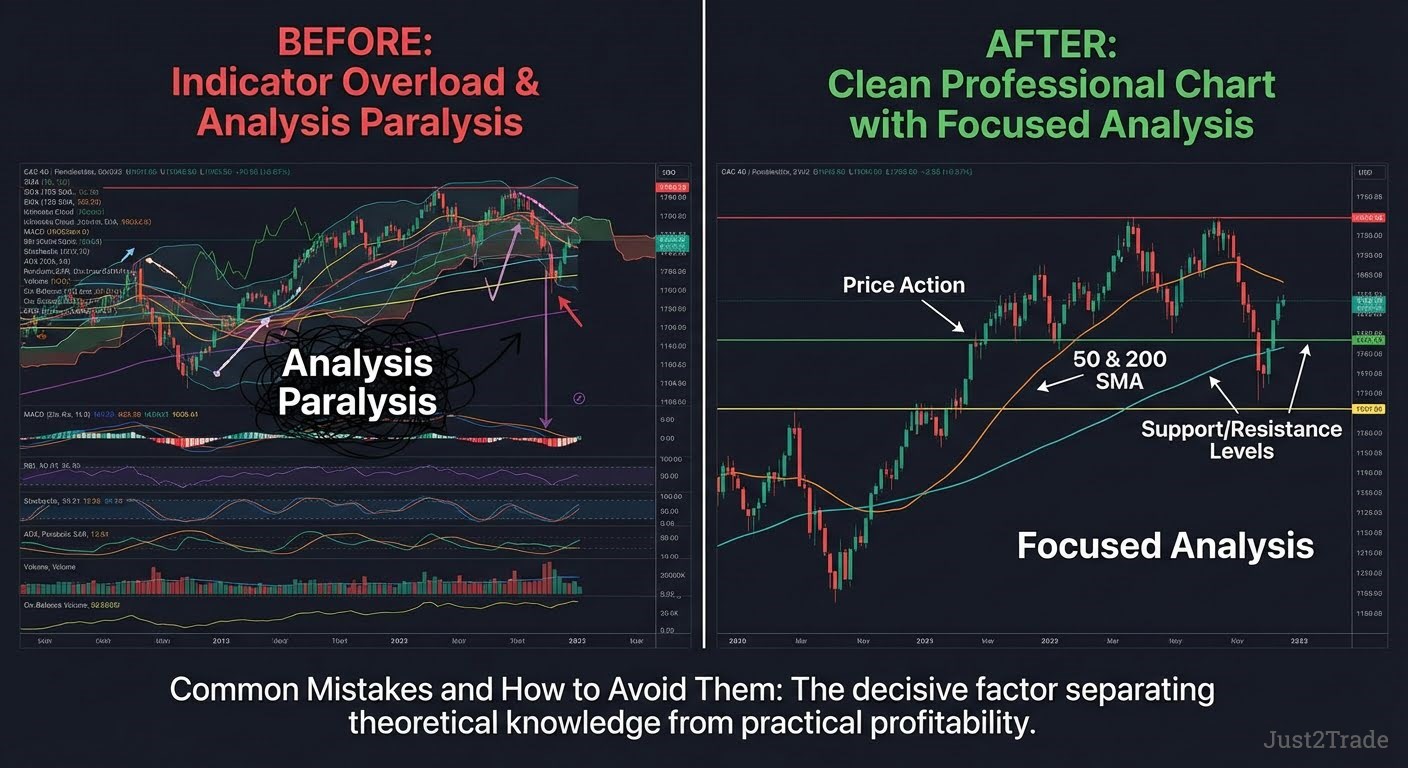
Despite mastering technical analysis, behavioral errors undermine CAC 40 results. Overtrading during the European session, indicator overload creating paralysis, neglecting risk management despite pattern skill, and emotional decisions after luxury sector volatility spikes are primary culprits. Recognizing these patterns in trading strategy execution is the decisive factor separating theoretical knowledge from practical profitability.
Overtrading and Forced Setups During European Session
Taking low-quality setups during quiet sessions systematically erodes profitability. Maintain a checklist requiring 3/5 alignment factors before any trading strategy entry qualifies. Limit executions to 3–5 weekly. Technical analysis demands quality over quantity, and patient CAC 40 traders who wait for textbook setups consistently outperform those forcing marginal opportunities.
Ignoring Proper Risk Management Despite Technical Skill
Risking 5–10% per trade turns a three-loss streak into a 15–30% drawdown. The "risk-first" framework determines position sizing before evaluating any trading strategy setup. Exchange-traded fund leverage magnifies this danger. Account survival depends more on disciplined risk management than prediction accuracy, which is essential for long-term CAC 40 trading success.
Conclusion: Integrating Technical Analysis for CAC 40 Investment Success
The CAC 40 offers an exceptional vehicle for technical analysis-based trading, combining concentrated liquidity, clean price action, and responsive behavior at key levels. Success demands integrating indicators such as MACD 8-17-9, RSI 9-period, and Moving Averages 20/50/200 with chart pattern recognition, volume analysis confirmation, and support and resistance mastery into cohesive trading strategy frameworks.
All of this must be governed by disciplined risk management. Exchange-traded fund options extend opportunities to longer-term investors. Backtesting, practice during 09:00–17:30 CET, and gradual implementation build the path to consistent execution.
Summary
- Master MACD (8-17-9), RSI (9-period), MAs (20/50/200)
- Confirm chart patterns with 30%+ above-average volume
- Combine tools for confluence at round numbers (6,500, 7,000, 7,500)
- Risk maximum 1% per trade with stops at technical invalidation
- Trade with discipline during the 09:00–17:30 CET session
FAQ
-
What is technical analysis and why does it work for CAC 40?
Technical analysis evaluates securities through price and volume data to forecast movements. It works exceptionally for the CAC 40 because concentrated Euronext Paris hours (09:00–17:30 CET) produce clean price action with institutional participation. The index reliably respects support/resistance levels, particularly round numbers where heavy order clustering occurs.
-
Which technical indicators are most effective for CAC 40 trading?
MACD (8-17-9 intraday), RSI (9-period), and moving averages (20 EMA, 50 SMA, 200 SMA) form the most effective toolkit. MACD identifies momentum, RSI flags extremes, and moving averages define trend structure with dynamic support/resistance for comprehensive CAC 40 coverage.
-
How do I identify high-probability support and resistance levels on CAC 40?
Map previous swing highs/lows on daily charts, overlay round numbers (6,500, 7,000, 7,500), and analyze volume profile for high-transaction zones. The strongest levels are confluence zones where multiple types align. Count historical touches and observe volume to validate reliability.
-
What are the most reliable chart patterns for CAC 40 trading?
Head and shoulders formations carry highest reliability, especially near round numbers. Double tops/bottoms, ascending triangles, and flags also produce consistent results. All patterns require volume confirmation, and breakouts need 30 to 40% above average volume for validation.
-
How do I set appropriate stop losses for CAC 40 trades?
Place stops at technical invalidation points, beyond support/resistance, typically 50–80 points. Day trading stops range 60–100 points; swing stops 100–150 points. Use 2×ATR for volatility-adjusted placement adapted to current conditions.
-
How can I use MACD effectively for CAC 40 trend identification?
Apply 8-17-9 parameters for intraday or 12-26-9 for swing trading. Focus on crossovers for entries, histogram expansion for momentum, and price-MACD divergences for reversal warnings. Enter crossovers only in the direction of the dominant trend identified by moving averages.
-
What are the best investment opportunities in CAC 40 using technical analysis?
CAC 40 exchange-traded funds (0.15–0.40% annual fees) suit longer-term investors applying weekly technical analysis. Active traders find opportunities in trend following during luxury sector momentum, mean reversion at oversold round-number support, and breakout trades from consolidation patterns.