How to Read Candlestick Charts: Main Candlestick Patterns
)
Table of Contents
Key Takeaways
What is a Candlestick Chart?
Candlestick Charts vs. Bar Charts
How to Read Candlestick Charts?
Key Candlestick Patterns
Candlestick Pattern Analysis
Example of Trading Based on Candlestick Patterns
Conclusion
FAQs
Reading candlestick charts transforms how traders view price movements. These powerful tools reveal market sentiment through simple visual patterns. Every candle tells a story about buyer and seller battles. Japanese traders revolutionized technical analysis centuries ago. Today's traders rely on these formations daily. Master these candlestick chart formations to improve your trading decisions today.
The stock market speaks through price action. Candlestick patterns translate this language clearly. Each formation predicts future price movements with surprising accuracy.
Key Takeaways
- Candlestick charts display price data through colored bodies and wicks showing market emotions
- Each pattern signals specific market conditions and potential trend changes ahead
- Single, double, and triple patterns offer different reliability levels for traders
- Combine patterns with support levels for stronger trade signals and confirmations
- Practice pattern recognition on demo accounts before real trading with capital
- Timeframes affect pattern reliability and trading decisions significantly
- Japanese traders revolutionized technical analysis worldwide since the 1700s
- Technical indicators allow confirmation of candlestick signals for better accuracy
- Understanding candle formations helps read the prevailing emotions in markets
What is a Candlestick Chart?
Candlestick formations originated in 18th-century Japan. Rice trader Munehisa Homma developed these visual price indicators. His techniques analyzed rice market emotions brilliantly. Today, they dominate trading platforms worldwide.
What are candlestick charts? Understanding starts with their basic purpose. Each candlestick shows four crucial price points. The open, high, low, and close create unique formations. These formations help traders identify market sentiment instantly. Colors reveal buying or selling dominance.
The rectangular body displays opening and closing prices clearly. Wicks extend to show price extremes reached. Green or white candles indicate upward movement. Red or black candles show downward pressure. This color coding speeds decision-making.
Modern trading instruments rely heavily on these charts. Forex, stocks, and cryptocurrencies all use candlestick analysis. The patterns transcend markets and timeframes effectively. Professional traders consider them essential tools.
These visual tools include valuable psychological insights. Each formation reflects trader emotions and decisions. Fear and greed appear visually on charts. Smart traders exploit these emotional patterns.
Want to master specific patterns? Check out our guide on Doji candles for deeper insights into this crucial formation.
Candlestick Charts vs. Bar Charts
Bar charts preceded these Japanese formations in Western markets. Both display identical price information technically. However, their visual impact differs dramatically. Understanding both helps choose the right tool.
Bar charts use simple lines for price levels. A vertical line connects highs and lows. Horizontal ticks mark opening and closing prices. This creates a skeletal appearance. Information exists but lacks visual appeal.
Candlestick charts add filled bodies between opens and closes. This visual enhancement reveals trend direction instantly. Traders process information faster with colored bodies. The filled space creates immediate understanding.
The body's size shows price movement strength clearly. Large bodies indicate strong trends developing. Small bodies suggest market indecision prevailing. Bar charts lack this immediate visual feedback. Traders must calculate mentally.
Pattern recognition becomes easier with candlesticks significantly. Complex formations jump off the screen immediately. Bar charts require more mental processing time. This speed advantage matters in fast markets. Seconds count when trading actively.
Visual memory retention improves with candlesticks too. Traders remember patterns better with colors. Bar charts blend together over time. Candlesticks create distinct mental images. This aids learning and recognition.
How to Read Candlestick Charts?
Understanding chart reading requires systematic analysis. Start with individual candle components first. Then progress to pattern recognition gradually. Time frames affect interpretation significantly. Master basics before advancing further.
Each candle represents a specific time period. Daily charts show one day per candle. Hourly charts display 60-minute periods precisely. Five-minute charts reveal micro movements. Choose timeframes matching your trading style.
Price dynamics create unique candle shapes constantly. Strong trends produce large-bodied candles consistently. Consolidation creates small bodies or Doji patterns. Volatility extends the wicks dramatically. Each shape tells its story.
Trend analysis combines multiple candles effectively. Look for higher highs in uptrends. Identify lower lows in downtrends clearly. Patterns often signal trend changes early. Timing entries becomes easier then.
Context matters more than individual candles. Support and resistance levels influence patterns. Volume confirms or contradicts signals presented. Always consider the bigger picture. Never trade patterns in isolation.
Market conditions affect pattern reliability greatly. Trending markets produce clearer signals. Choppy markets create false patterns frequently. Adapt your approach to conditions. Flexibility improves trading results consistently.
Structure of a Candlestick
Every candlestick contains four essential components. Understanding each part enables accurate chart reading. Let's examine each element carefully. Knowledge builds trading confidence steadily.
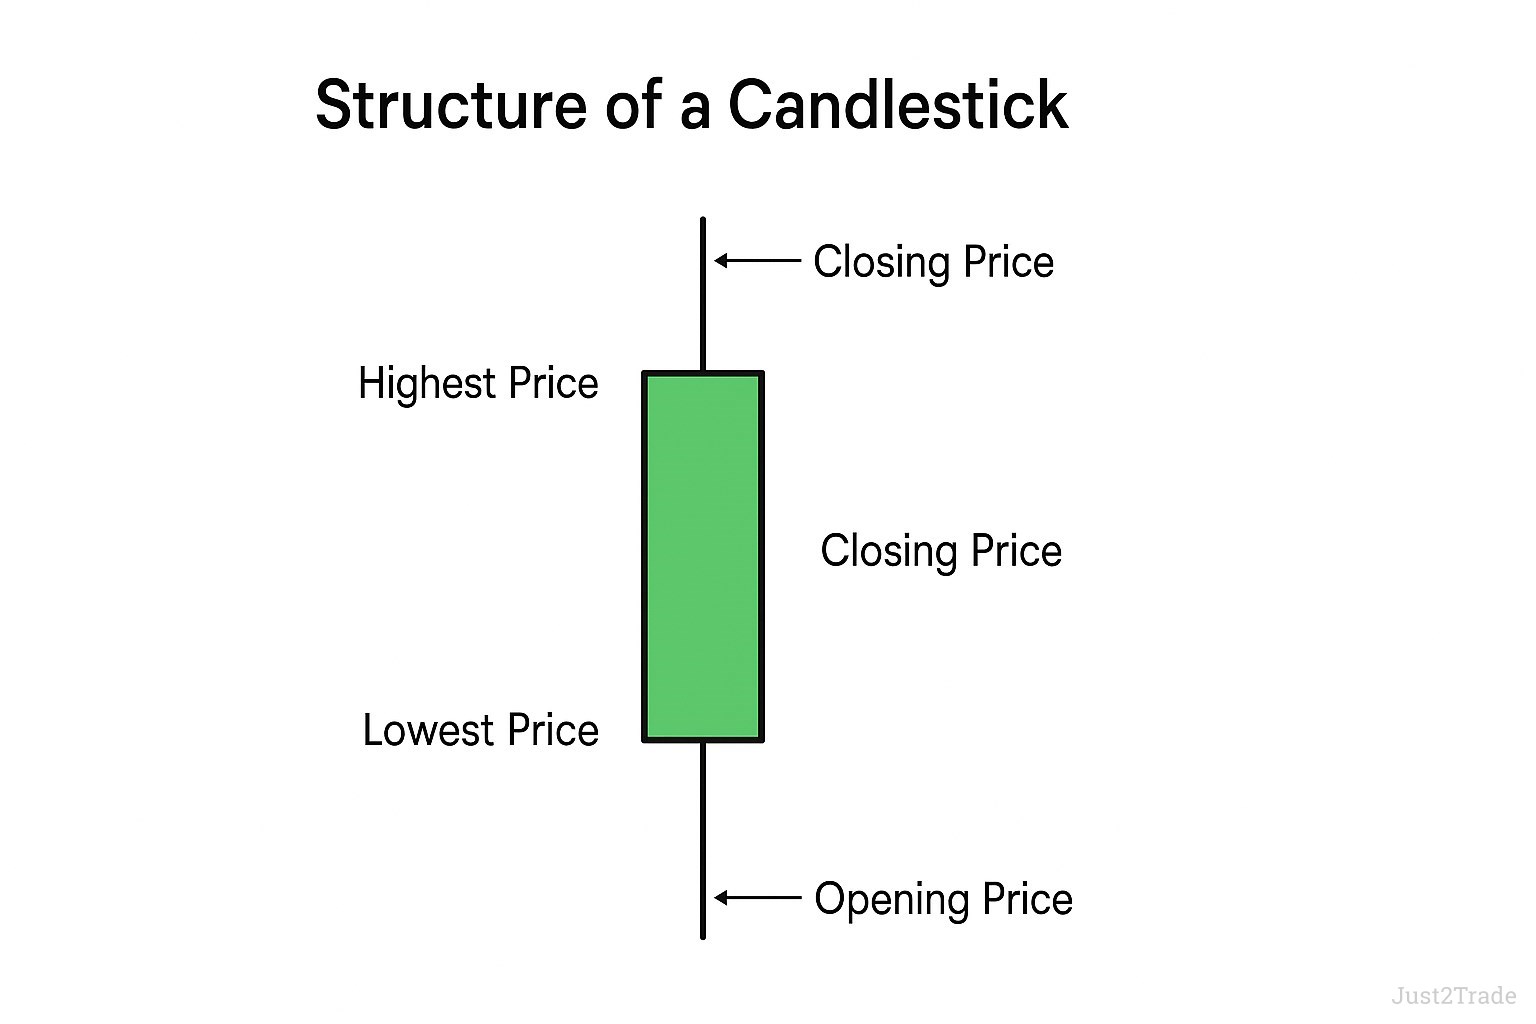)
The rectangular body forms the candle's core structure. It spans from open to close price exactly. Body size indicates movement strength visually. Color shows directional bias clearly. Large bodies signal conviction.
Thin lines extending from the body are wicks. Upper wicks reach the highest price touched. Lower wicks touch the lowest point reached. Some traders call them shadows alternately. Both terms work identically.
Green or white bodies show bullish movement. The close exceeds the open price definitively. Red or black bodies indicate bearish action. The close falls below the open clearly. Colors provide instant recognition.
Real bodies vary in size significantly. Large bodies show strong directional movement. Small bodies indicate consolidation periods. No body creates Doji patterns. Each size conveys different information.
Opening Price
The opening price marks where trading begins. It forms one edge of the candle body. This level often reflects overnight sentiment changes. Gaps from previous closes matter greatly.
Highest Price
The highest price creates the upper wick's tip. It shows maximum bullish pressure during the period. Long upper wicks suggest selling at highs occurred. This creates resistance levels.
Lowest Price
The lowest price forms the lower wick's bottom. It reveals maximum bearish pressure reached. Long lower wicks indicate buying support emerged. These levels often hold subsequently.
Closing Price
The closing price completes the candle body formation. It determines the candle's final color ultimately. This level often influences the next candle's opening. Momentum carries through periods.
Wick
Wicks reveal price rejection levels clearly. Long wicks show volatility and indecision. Short wicks suggest steady price movement. No wicks indicate trending conditions strongly.
Direction
Body color instantly shows price direction. Green means buyers won the period. Red indicates sellers dominated throughout. This visual cue speeds analysis dramatically.
Range
The range measures total price movement. Calculate it from highest to lowest price. Larger ranges indicate higher volatility present.
Key Candlestick Patterns
Patterns form the foundation of candlestick analysis. Master these formations for better trading results. Each pattern tells a specific story. Recognition improves with practice consistently.
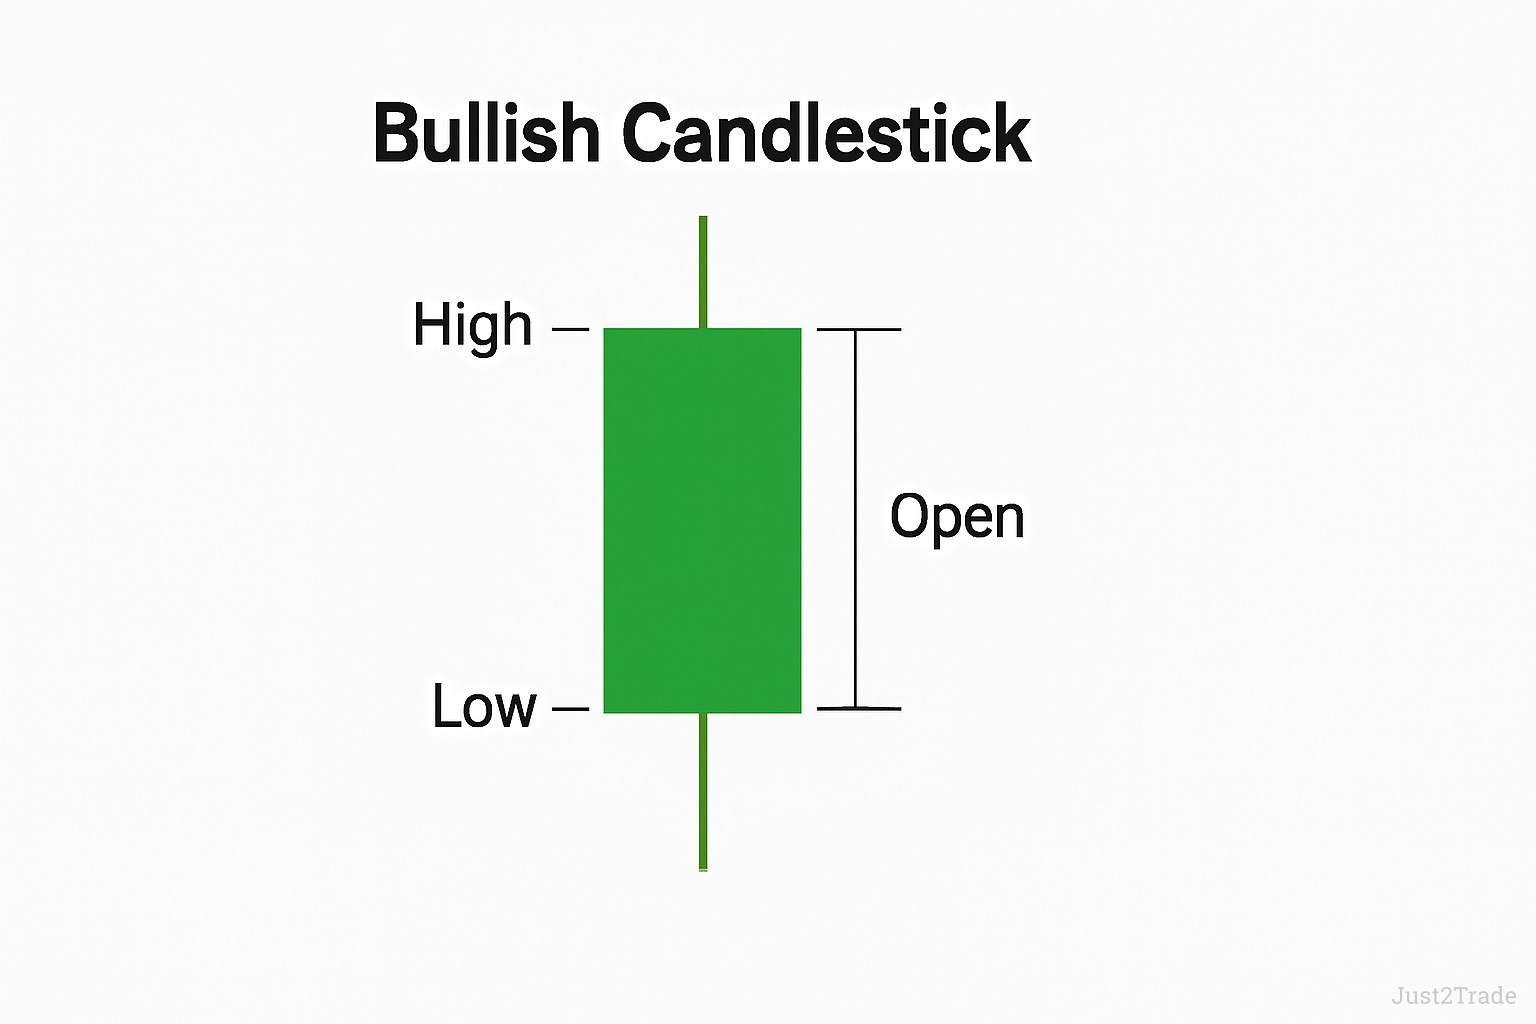
Bullish Candlestick
Bullish candlesticks close higher than they open. The body appears green or white clearly. These candles often appear in upward trends. They signal continued buying pressure building. Large bullish candles show strong momentum developing. Small ones suggest slower accumulation occurring.
Watch for bullish candles near support. They often launch new upward moves. Volume should accompany strong candles. This confirms buyer commitment levels.
)
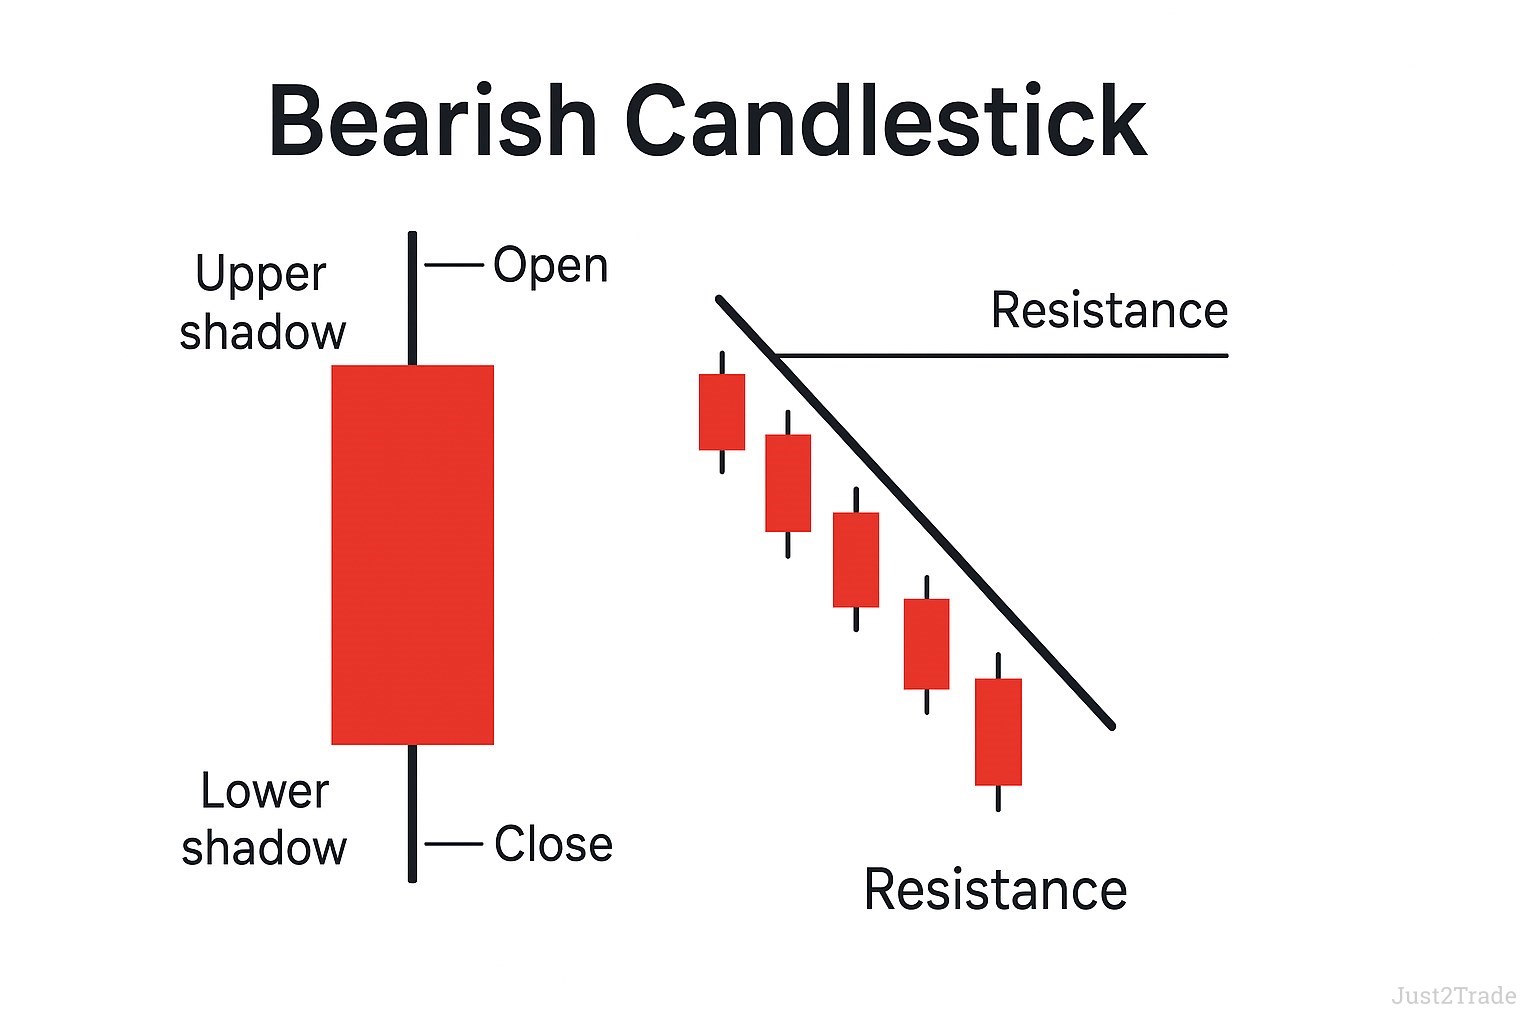
Bearish Candlestick
Bearish candlesticks close below their opening price. Red or black bodies indicate selling pressure. These formations appear in downtrends frequently. They warn of continued price declines ahead. Size matters for bearish candles too. Large ones show heavy distribution occurring.
Multiple bearish candles create resistance overhead. Price struggles to overcome these levels. Traders short-sell at these points. Risk management remains crucial always.
)
Single Candlestick Patterns
Single patterns provide immediate trading signals. The Hammer and Doji rank among the most reliable. These formations often mark trend reversals developing. Watch for them at key support levels. Volume confirms their validity strongly.
Single patterns work best with confirmation. The next candle should support the signal. This reduces false positives significantly. Patience pays when trading patterns.
Double Candlestick Patterns
Two-candle patterns offer stronger confirmation signals. Engulfing patterns clearly show trend changes. The second candle validates the first candle's signal. These patterns reduce false signals significantly. Professional traders prefer double confirmations.
Double patterns appear less frequently. This increases their reliability considerably. Wait for complete pattern formation. Premature entries often fail badly.
Triple Candlestick Patterns
Three-candle formations provide maximum reliability levels. Morning Star and Evening Star patterns excel at reversals. Three White Soldiers confirm strong uptrends developing. These patterns rarely produce false signals. Their completion takes more time.
Triple patterns offer excellent risk-reward ratios. Stop losses stay relatively tight. Profit targets extend much further. This mathematical edge compounds over time.
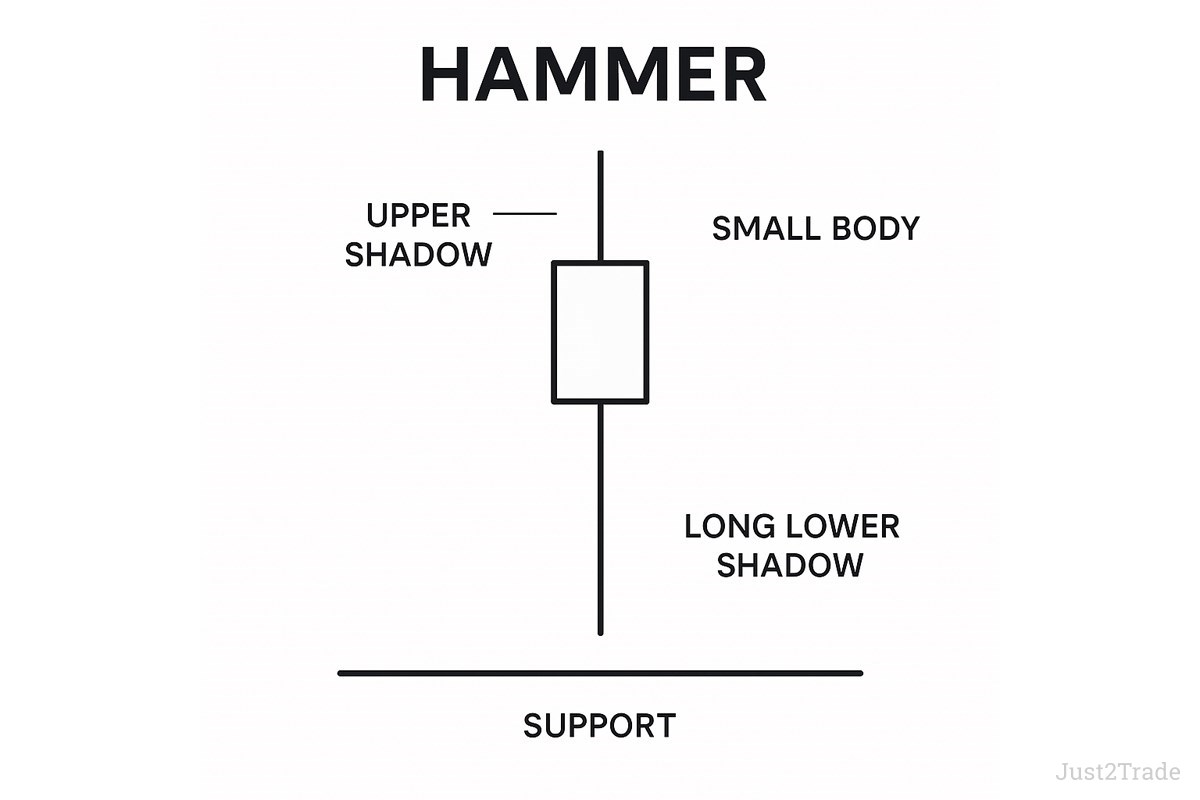
Hammer
The Hammer appears after price declines consistently. Its small body sits atop a long lower shadow. This shadow should be twice the body's length minimum. The color matters less than location.
Buyers stepped in after initial selling pressure. They pushed prices back near the open aggressively. This shows potential trend reversal brewing. Smart money accumulates at lows.
Look for Hammers near major support levels. Volume should increase on the pattern day. The next candle must close higher for confirmation. Entry occurs above the Hammer's high strictly. Stop loss goes below the shadow.
The pattern works across all timeframes. Daily Hammers carry more weight though. Intraday patterns need additional filters. Combine with technical indicators wisely.
)
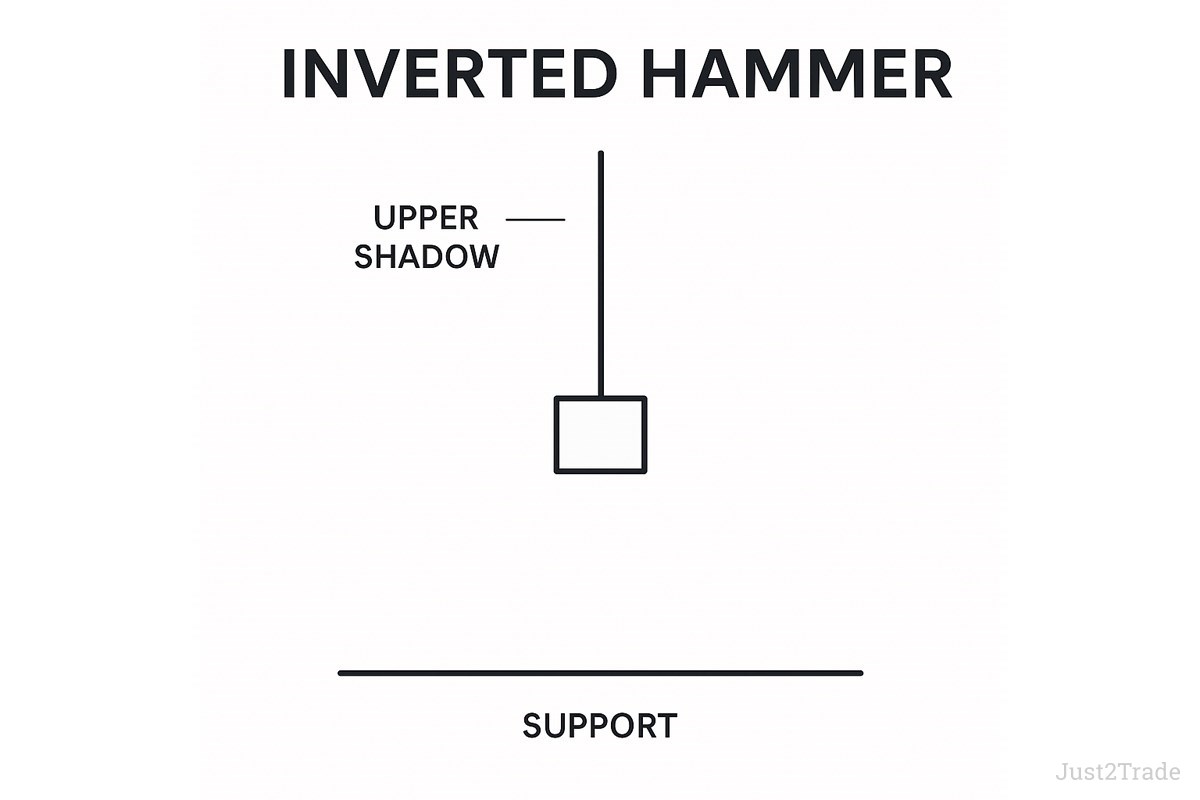
Inverted Hammer
The Inverted Hammer mirrors the standard Hammer exactly. Its long shadow extends upward instead. This reverse hammer pattern also suggests bullish reversal potential. Location determines its effectiveness primarily.
Early buyers pushed prices higher aggressively. However, sellers returned before the close. The small body shows this battle's result. Confirmation remains essential for trading. Never trade without it.
The longer upper shadow shows attempted breakout. Sellers defended successfully this time. But buyer interest emerged clearly. The next session often gaps higher. This confirms the reversal signal.
)
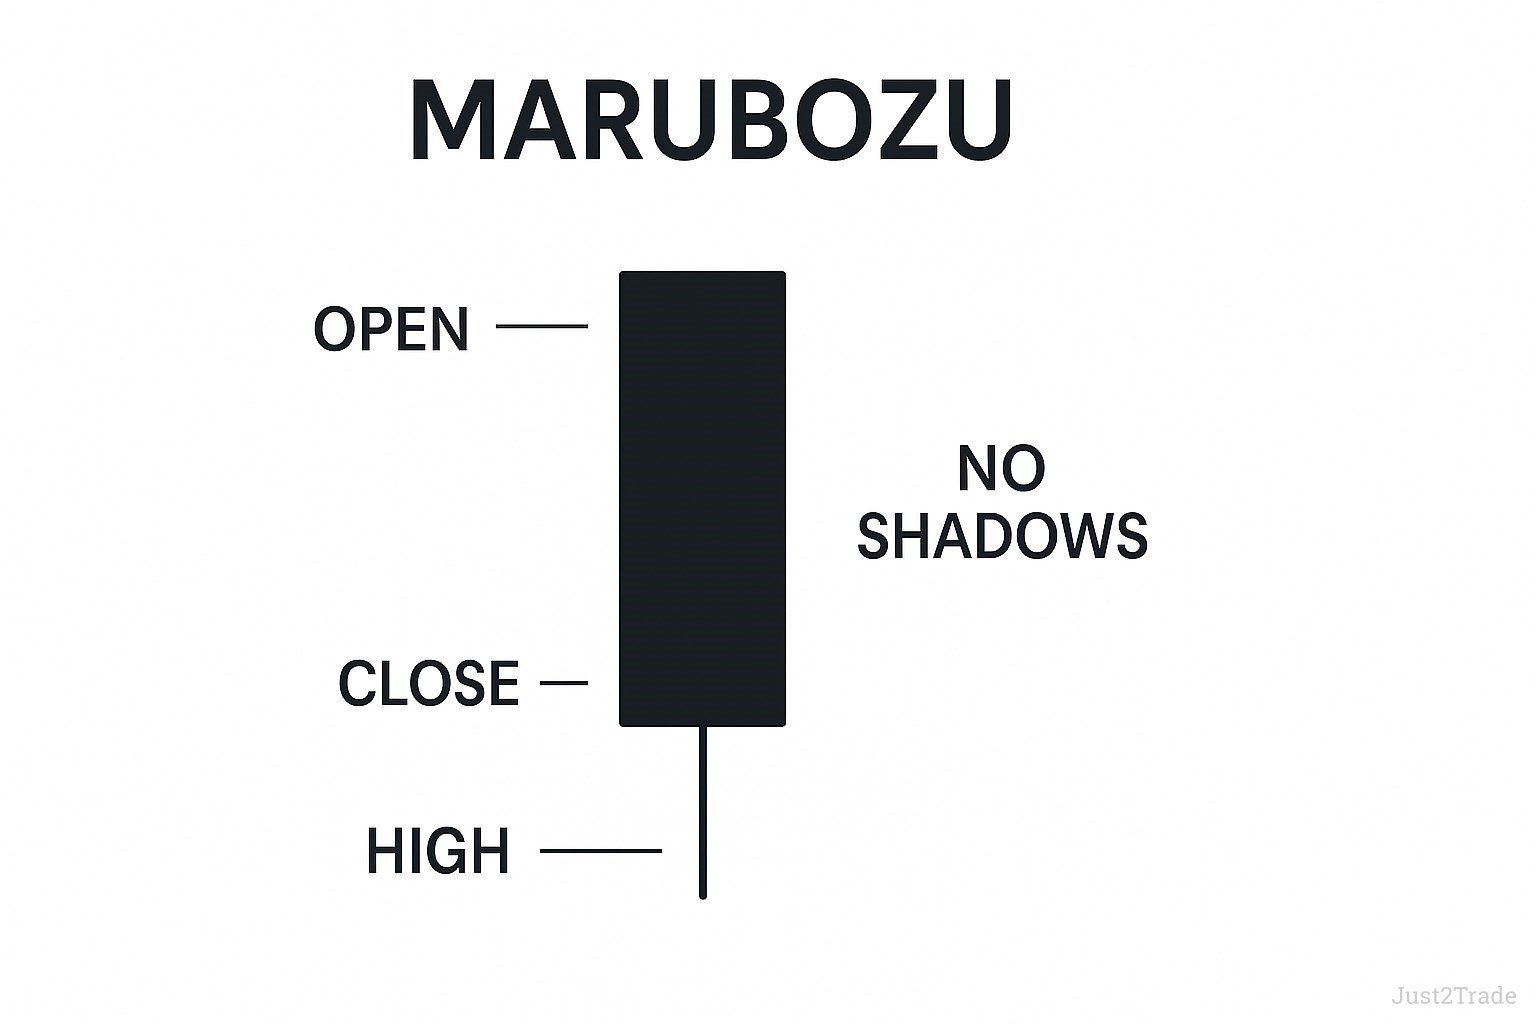
Marubozu
Marubozu candles lack shadows completely. The open equals the low in bullish versions. The close matches the high price exactly. This shows overwhelming one-sided pressure throughout.
Bearish Marubozu opens at highs precisely. It closes at the low tick. No wicks means no price retracement occurred. These powerful candles often continue existing trends. Their appearance signals strong conviction.
Strong Marubozu candles establish new support or resistance. The closing price becomes a key level. Watch for bounces or breaks at these points. They often determine future direction clearly.
Trading Marubozu requires trend alignment. Bullish ones work in uptrends best. Bearish ones excel in downtrends. Counter-trend Marubozu often fail quickly. Context remains king in trading.
)
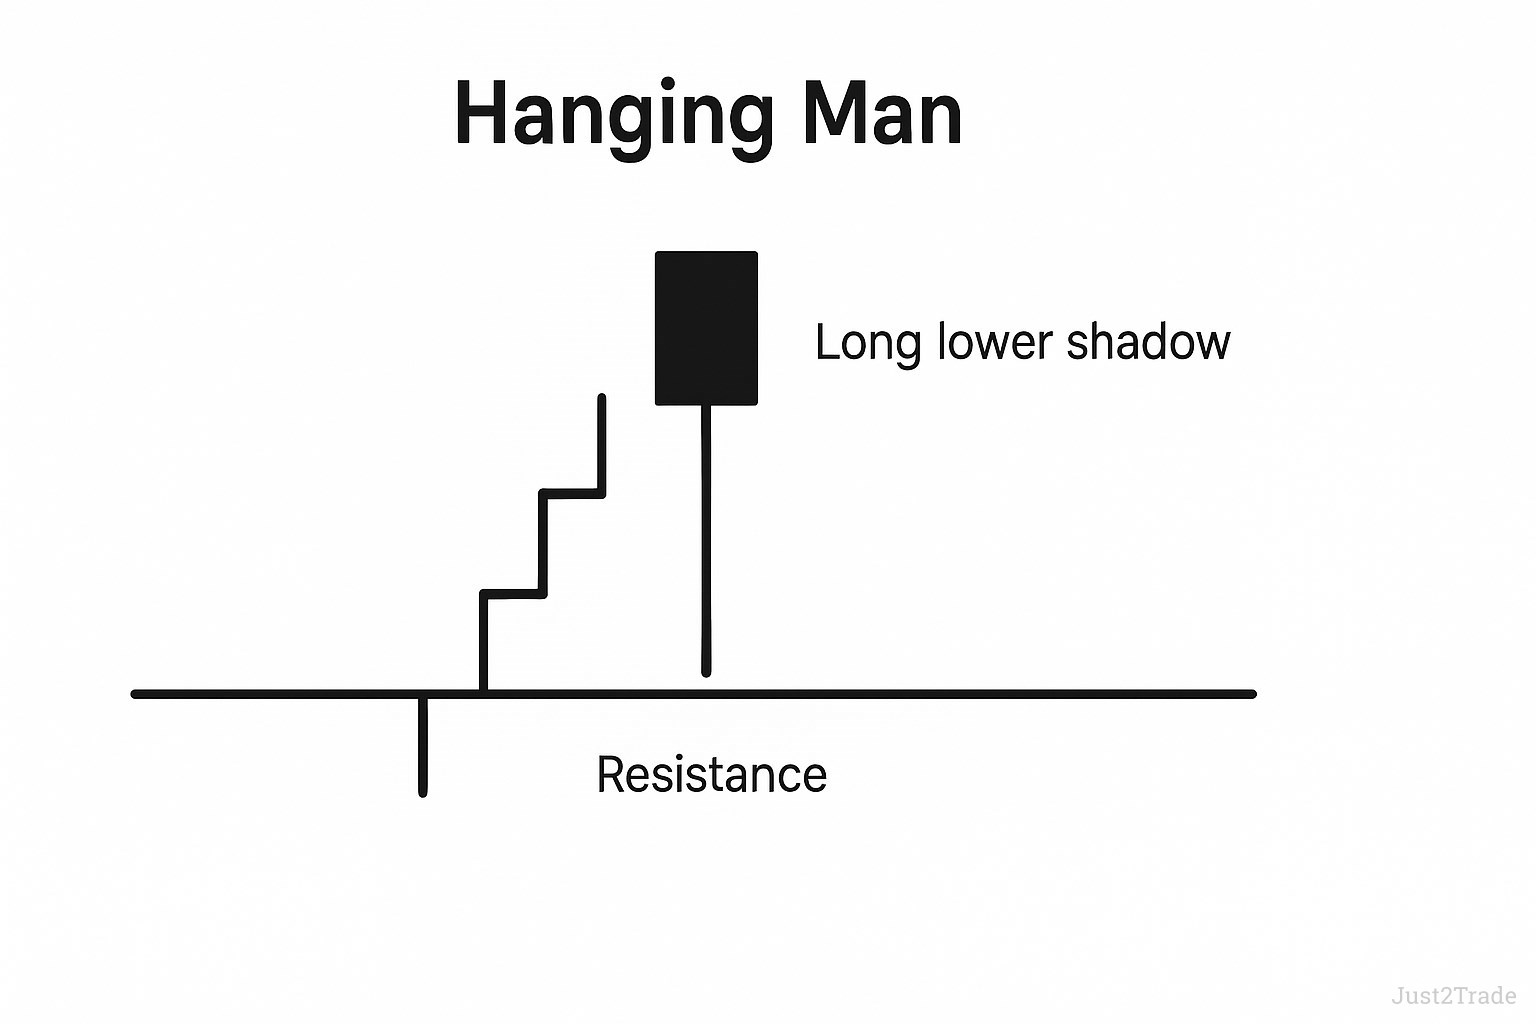
Hanging Man
The Hanging Man appears at uptrend peaks frequently. It looks identical to the Hammer pattern. Context determines the interpretation entirely. This formation warns of potential reversals ahead.
The long lower shadow shows selling pressure emerged. Bulls defended but showed weakness ultimately. The next candle often gaps lower. This confirms the bearish reversal signal strongly.
Look for Hanging Man after extended rallies. Overbought conditions increase reliability significantly. Combine with resistance levels ideally. This confluence strengthens the signal considerably.
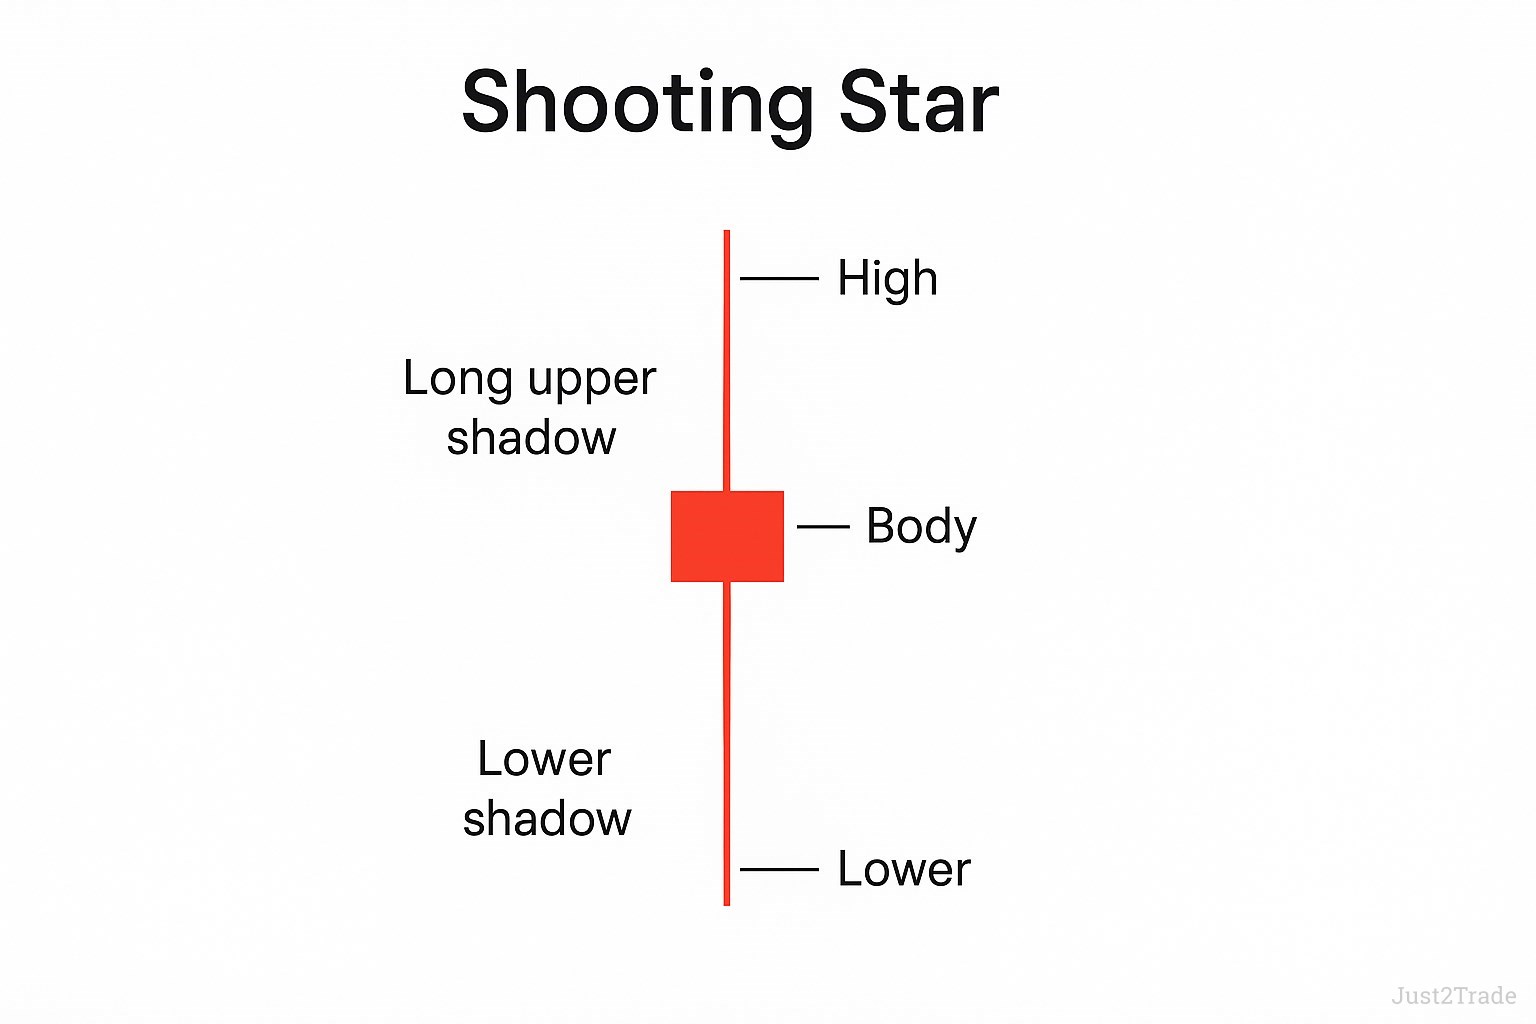
Shooting Star
Shooting Stars flash warnings at the top of the growth trend. Their long upper shadows show rejection clearly. The small body sits at the bottom. This pattern mirrors the Inverted Hammer structurally. Some traders mistakenly call it a falling star.
Bulls pushed prices higher initially. Bears overwhelmed them before the close decisively. The long wick marks clear resistance. Price often reverses after this signal appears.
The Shooting Star works best after uptrends. It signals exhaustion and profit-taking. Smart money distributes into strength. Unfortunately, retail traders often buy these tops.
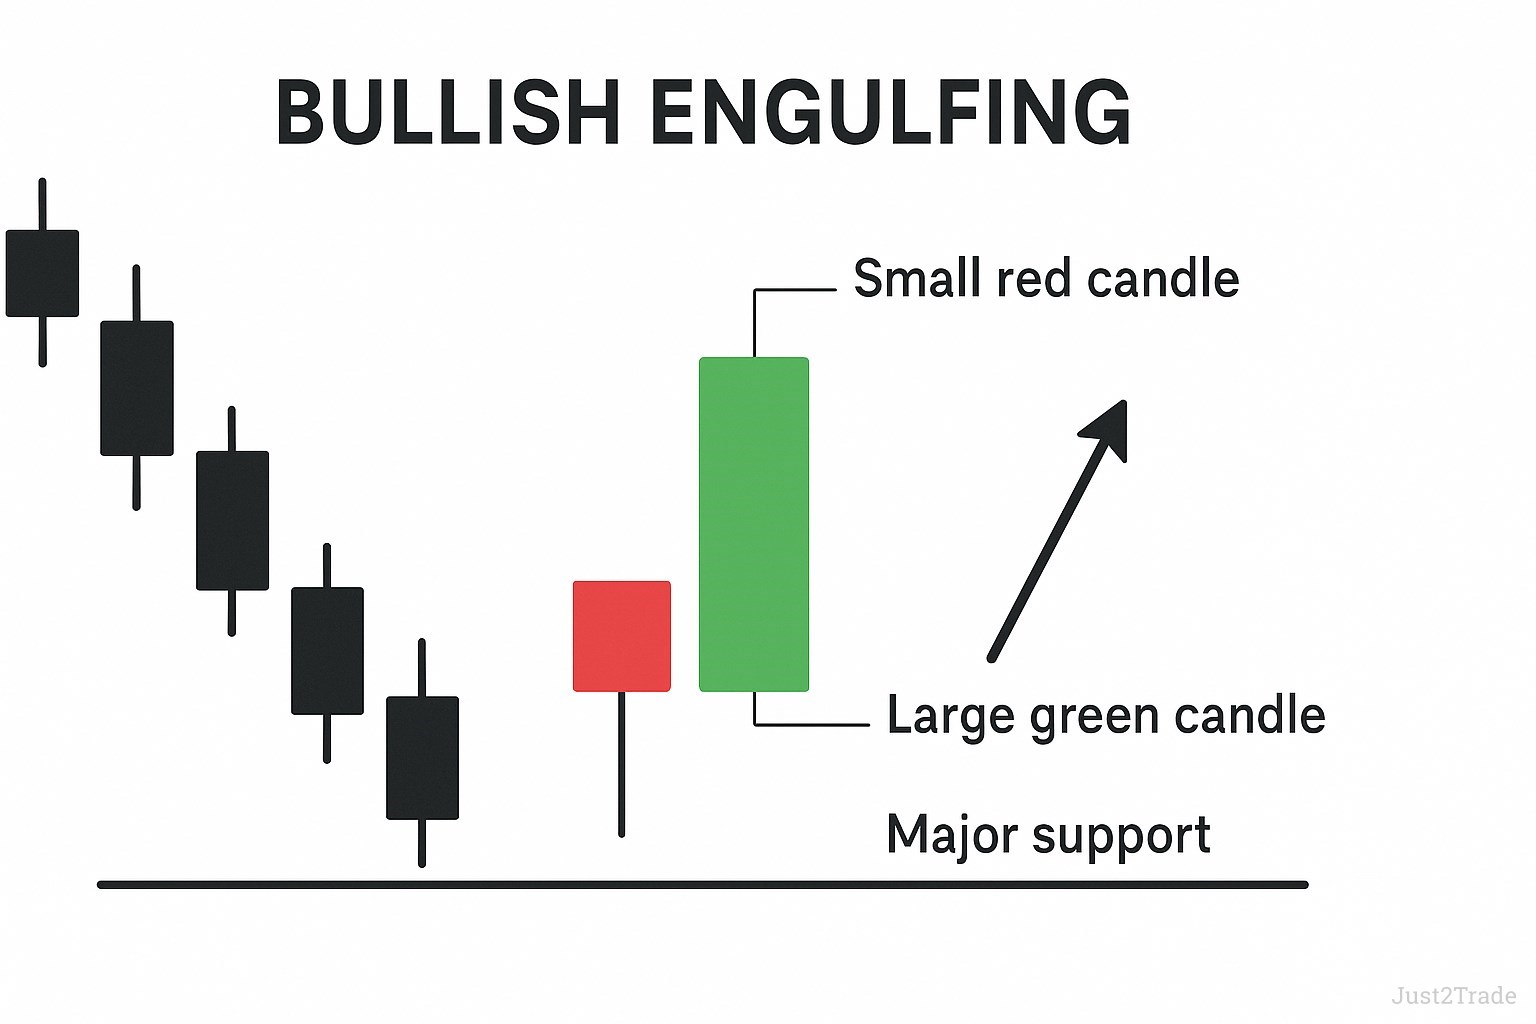
Bullish Engulfing
Bullish Engulfing patterns dominate bearish trends powerfully. A small red candle appears first. The next green candle completely engulfs it. This shows bulls seizing control decisively.
The pattern works best after extended declines. Look for it near major support zones. Volume should spike on the engulfing candle. This adds conviction to the reversal signal.
The body of the first candle sets the stage. Smaller bodies work better generally. The second candle must open below and close above. This complete reversal impresses traders psychologically.
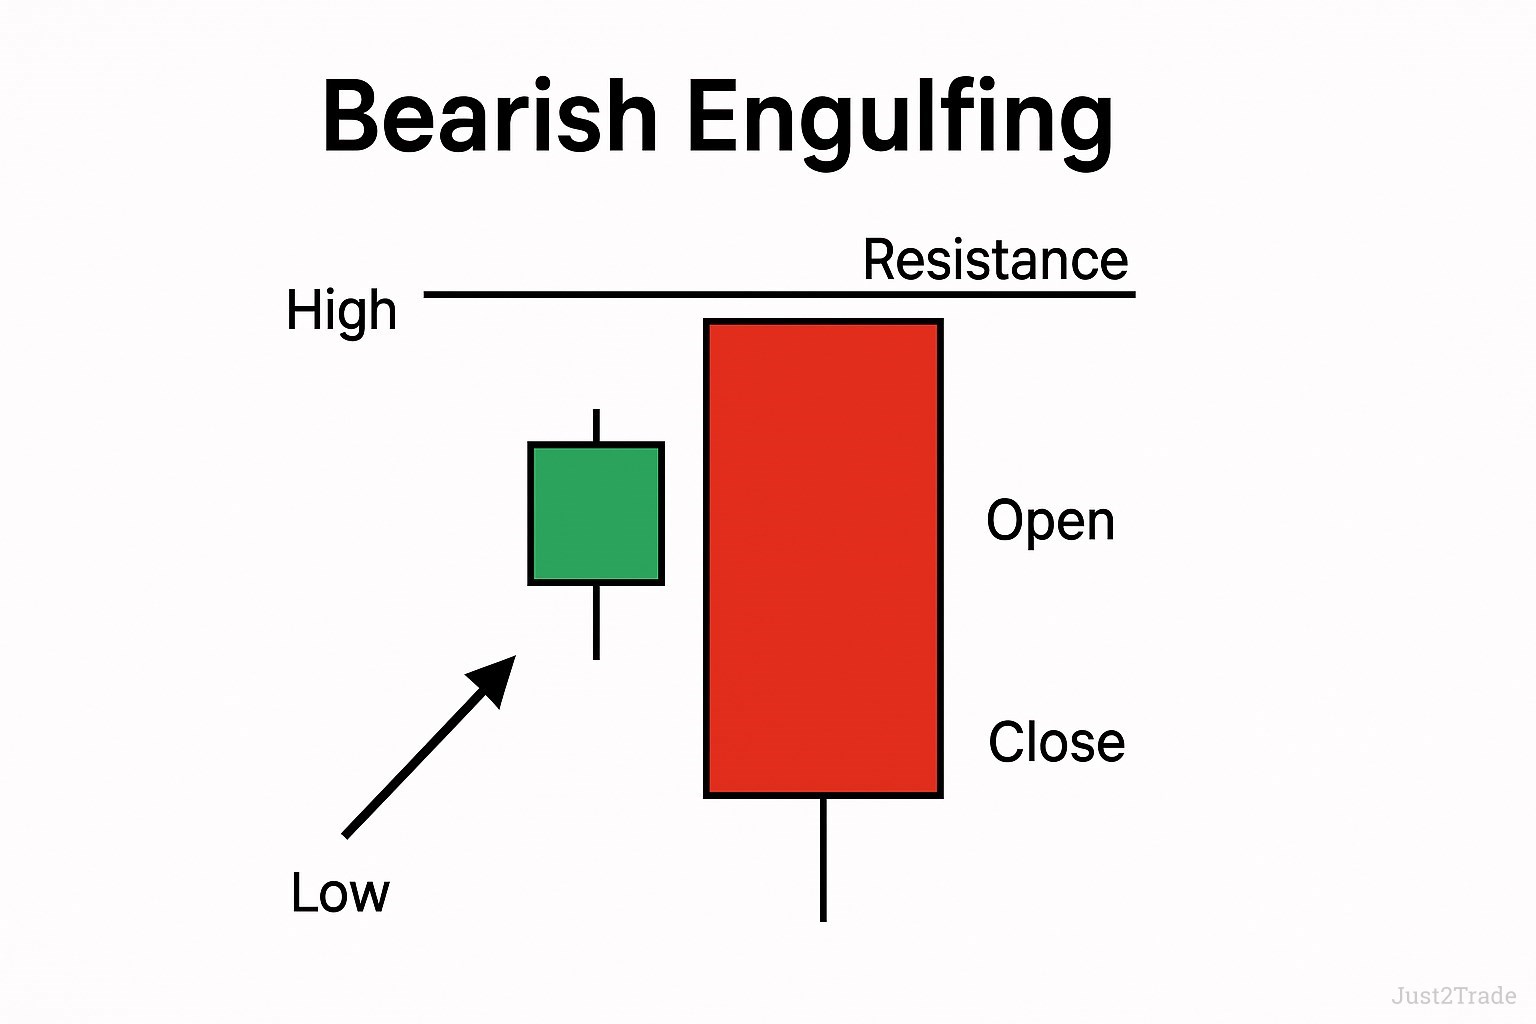
Bearish Engulfing
Bearish Engulfing formations end uptrends abruptly. A green candle forms first innocently. A larger red candle then swallows it whole. Bears have taken charge completely.
This pattern appears at resistance frequently. It marks distribution and profit-taking. The reversal often continues for days. Short sellers target these setups specifically.
Piercing Pattern
The Piercing Pattern signals bullish reversals reliably. A bearish candle appears in a downtrend first. The next candle gaps lower but closes above the first candle's midpoint. This shows buyer strength emerging.
The gap lower traps late sellers. Smart buyers accumulate at discounts. The strong close changes sentiment dramatically. Follow-through usually occurs in the next session.
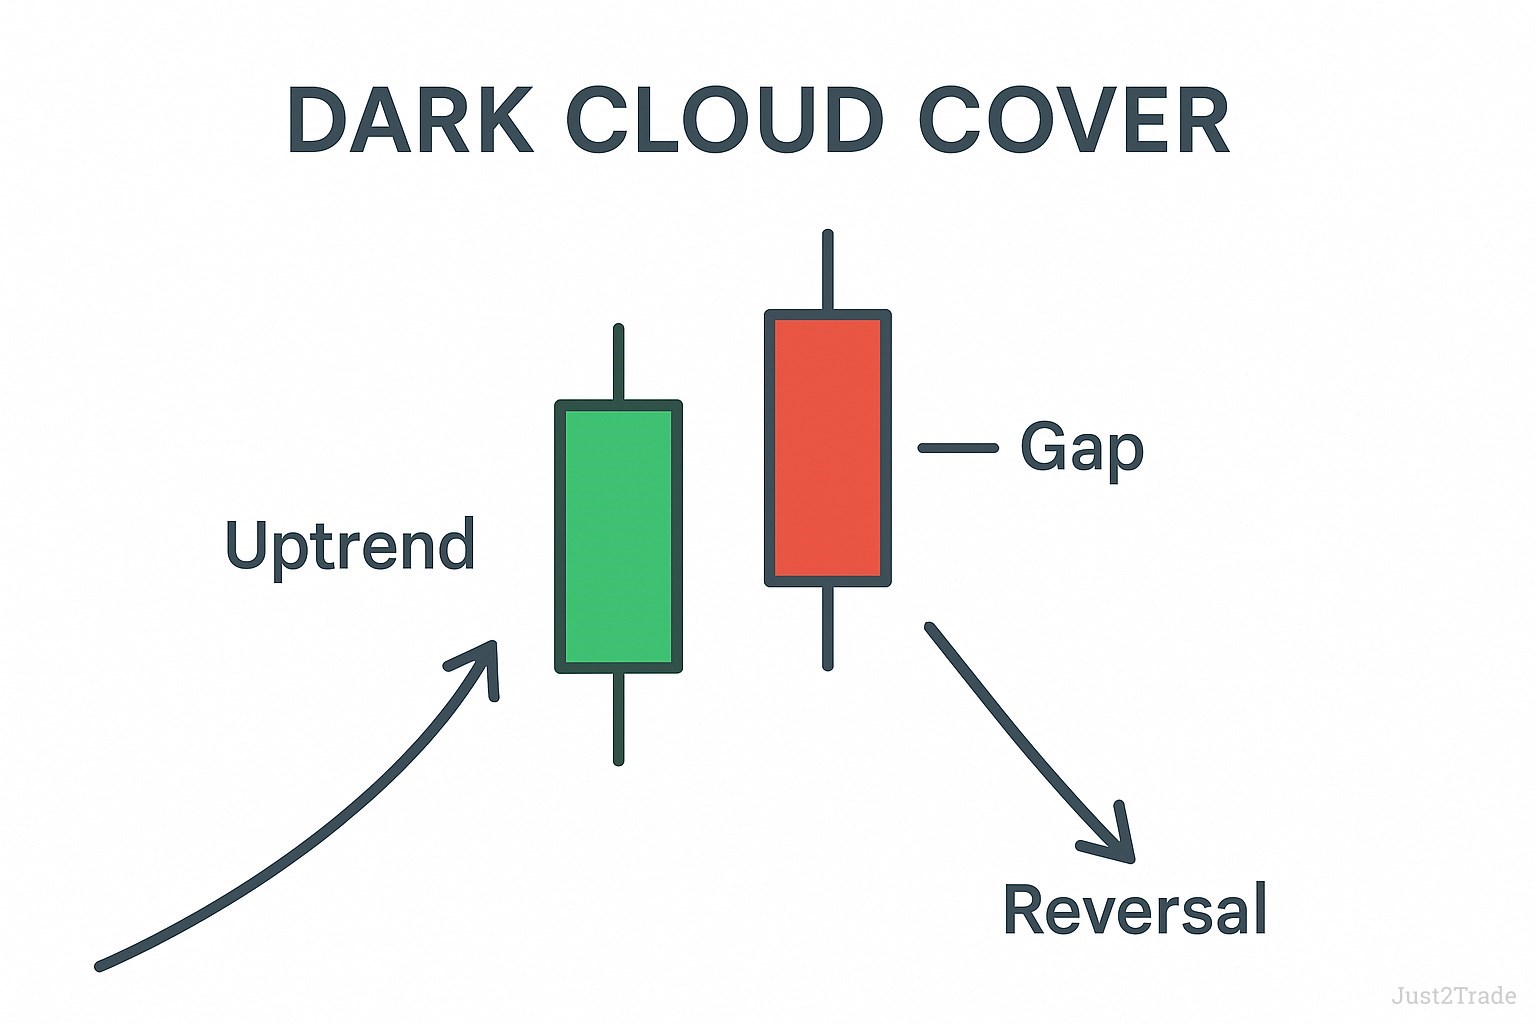
Dark Cloud Cover
Dark Cloud Cover warns of bearish reversals ahead. An uptrend produces a bullish candle first. The next candle gaps higher but closes below the midpoint. This shows bulls losing control rapidly.
Watch for this pattern at resistance levels. The gap and reversal indicate exhaustion clearly. Sellers overcome initial buying enthusiasm. Price often continues lower subsequently.
The pattern resembles a bearish Piercing Pattern. Both show trend exhaustion developing. Trade them similarly with proper stops. Risk management prevents large losses.
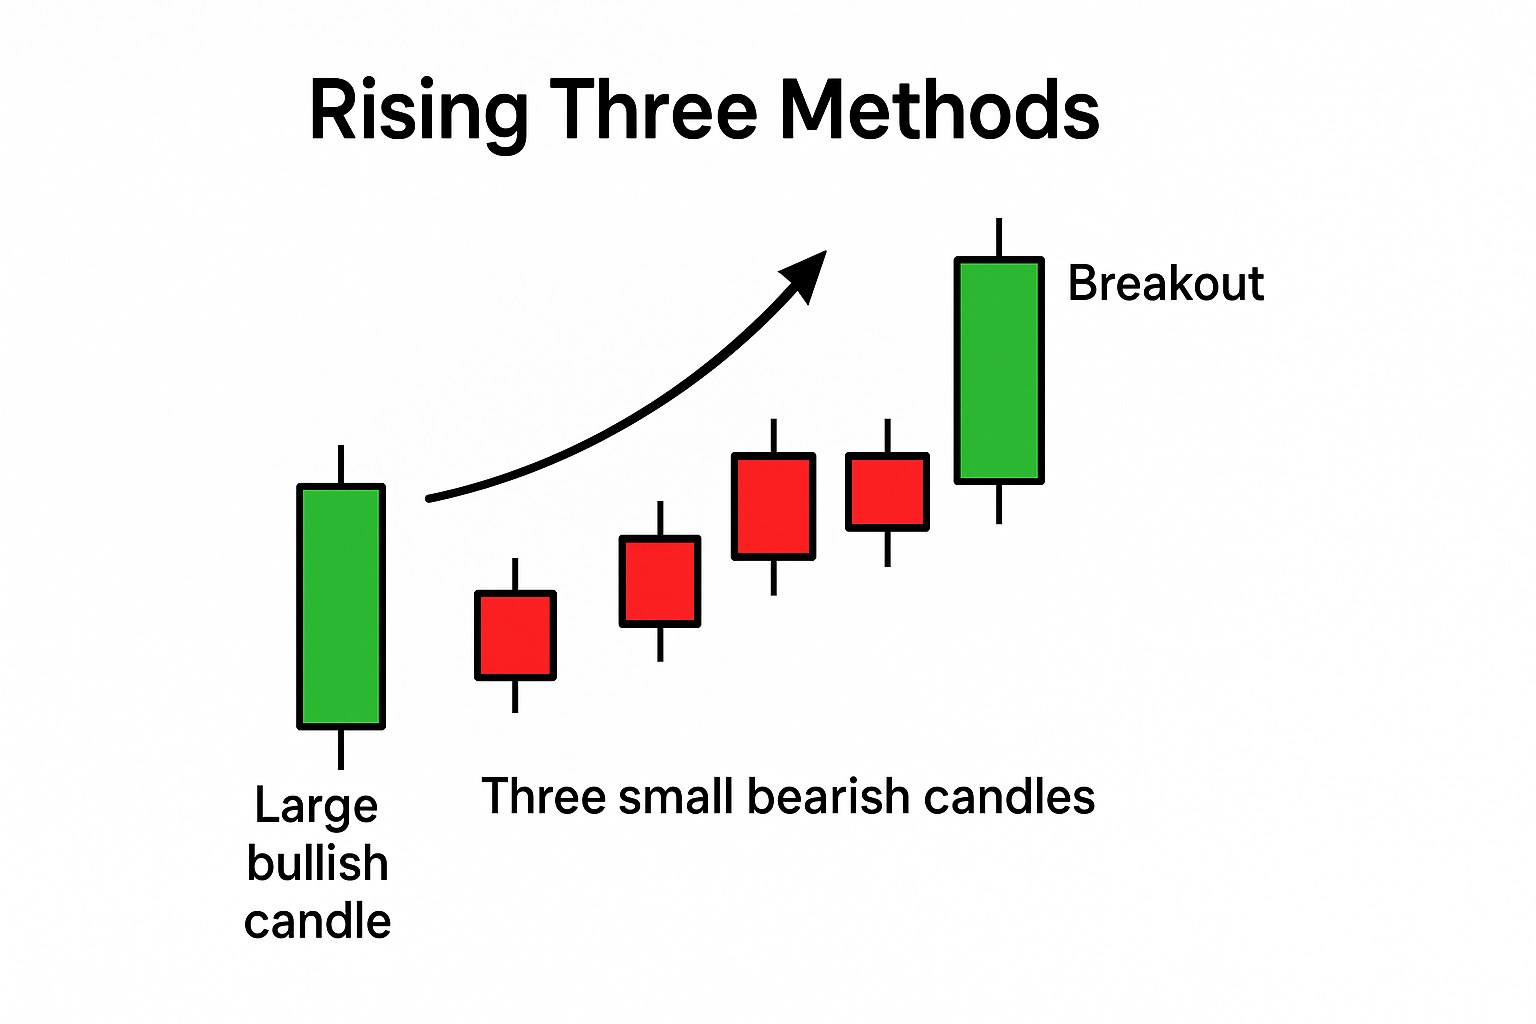
Rising Three Methods
Rising Three Methods confirm uptrend continuation reliably. A large bullish candle appears first strongly. Three small bearish candles follow within its range. A final bullish candle breaks above decisively.
This pattern shows temporary consolidation only. Bulls maintain control throughout the formation. The breakout often accelerates the uptrend. Measure targets from the pattern's base.
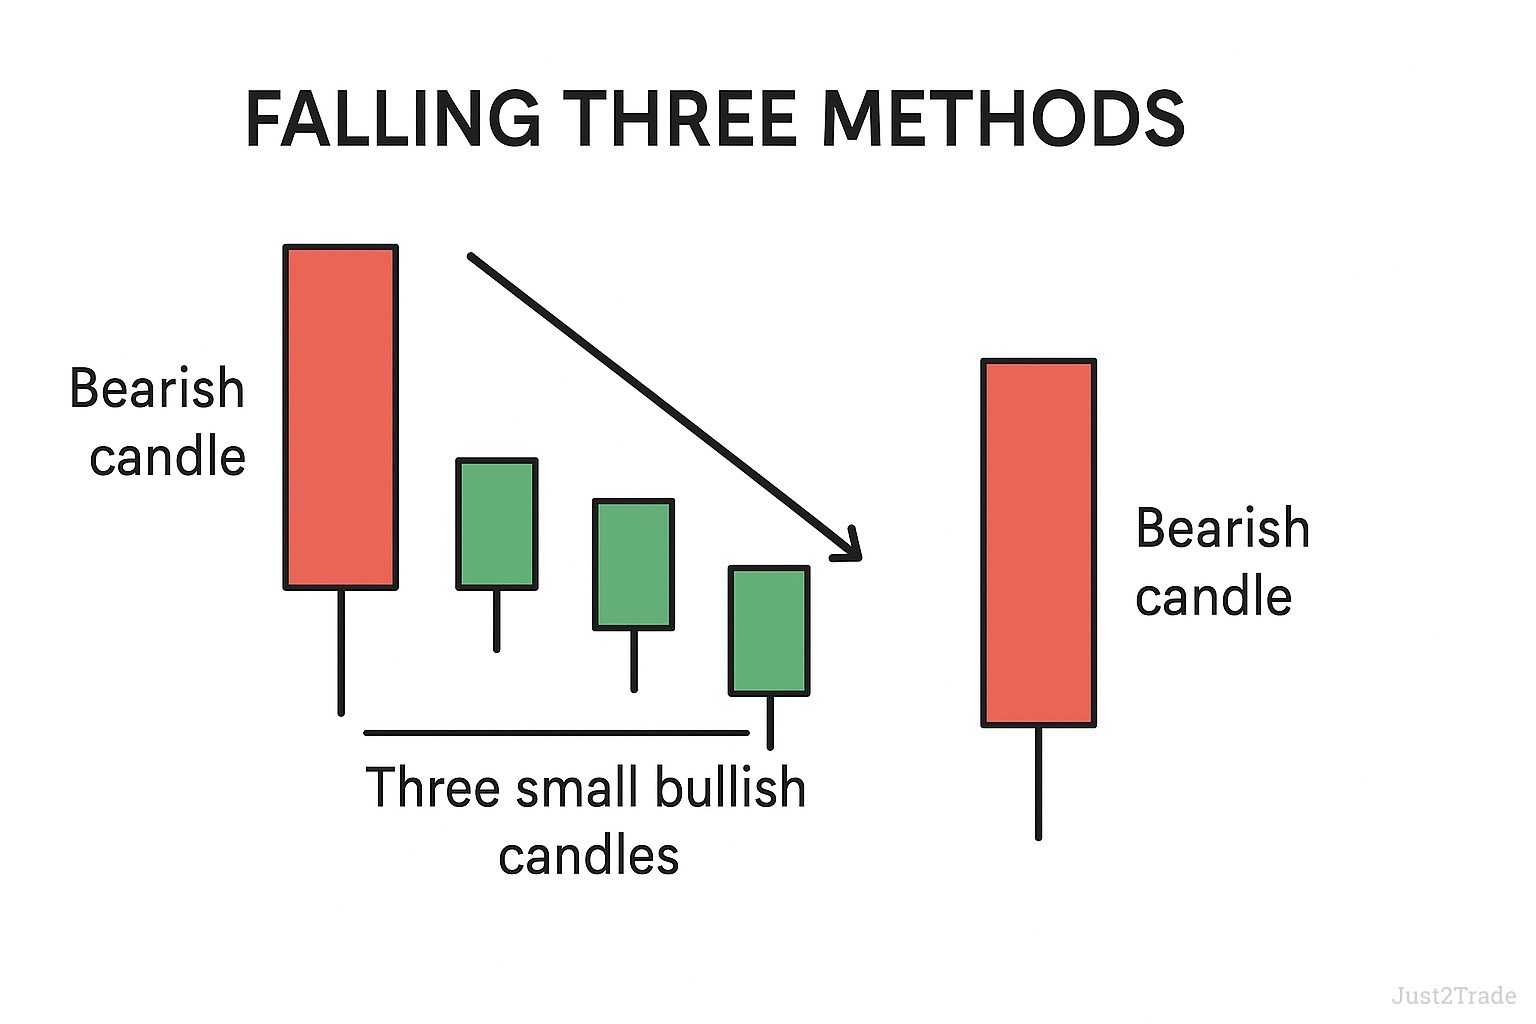
Falling Three Methods
Falling Three Methods validate downtrends continuing. A bearish candle leads the formation. Three small bullish candles consolidate within. The final bearish candle confirms continuation strongly.
Bears use rallies to add positions. The pattern shows distribution occurring. Support levels often break after completion. Short sellers target these formations.
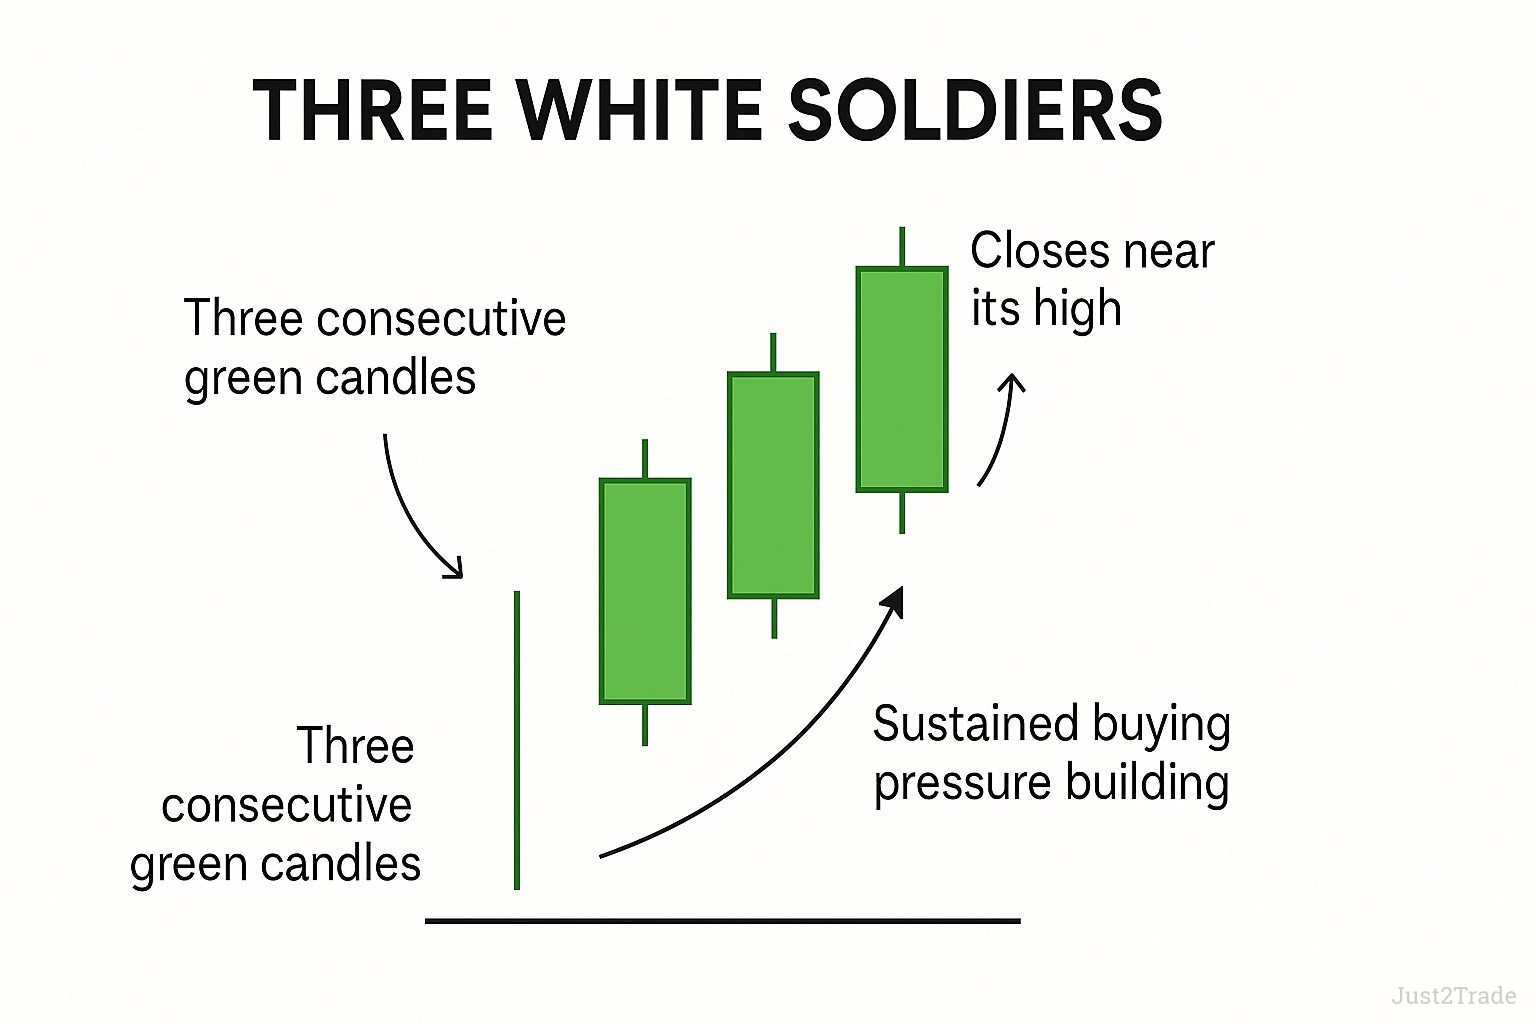
Three White Soldiers
Three White Soldiers march prices higher steadily. Three consecutive green candles appear. Each closes near its high consistently. This shows sustained buying pressure building.
The pattern appears after consolidation typically. It signals new uptrends beginning. Volume should increase progressively ideally. This confirms accumulation occurring.
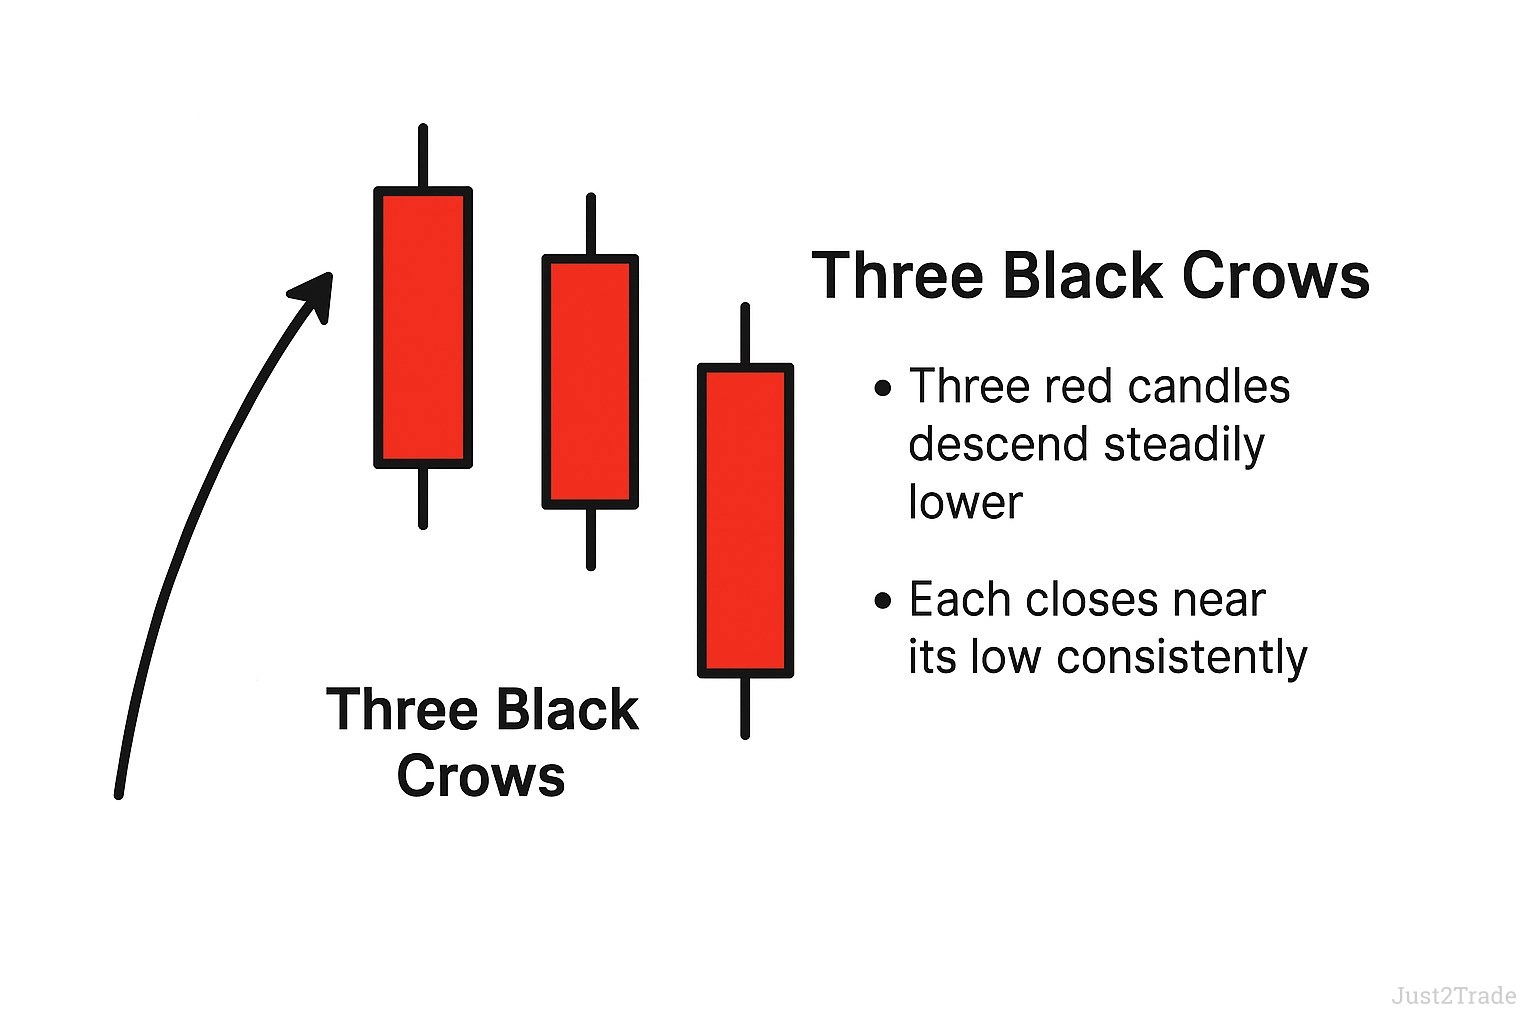
Three Black Crows
Three Black Crows signal bearish continuation strongly. Three red candles descend steadily lower. Each closes near its low consistently. Sellers maintain control throughout.
This pattern often marks major tops. Distribution occurs over three days. Support levels crumble beneath pressure. Downtrends accelerate after completion typically.
Candlestick Pattern Analysis
Successful pattern analysis combines multiple factors intelligently. Never trade patterns in isolation ever. Context determines reliability and profit potential ultimately. Let's explore comprehensive analysis techniques.
Start with the broader trend direction first. Reversal patterns work best at extremes. Continuation patterns confirm existing momentum nicely. Timeframe selection affects pattern validity significantly. Daily patterns carry more weight.
Support and resistance levels enhance patterns dramatically. A Hammer at major support carries weight. Shooting Stars at resistance warn effectively. These confluences create high-probability trades consistently.
Volume confirms or denies pattern signals clearly. Reversals need increasing volume desperately. Low volume suggests weak commitment levels. Watch for volume spikes at pattern completion.
Technical indicators complement candlestick analysis beautifully. RSI divergences strengthen reversal patterns significantly. Moving averages provide trend context clearly. Combine tools for comprehensive analysis always.
Market conditions influence pattern success rates. Trending markets produce reliable signals consistently. Ranging markets create more false patterns. Adapt your filters to conditions accordingly.
The possibility of trend reversal increases at extremes. Oversold bounces create Hammer patterns frequently. Overbought conditions produce Shooting Stars often. These extremes improve pattern reliability considerably.
Example of Trading Based on Candlestick Patterns
Let's examine a real EUR/USD trade scenario. The pair declined for three consecutive days. A Hammer formed at 1.0800 major support. This confluence attracted buyer attention immediately.
The Hammer's lower shadow touched 1.0785 precisely. Its body closed at 1.0815 firmly. Volume increased 40% versus the previous day. These factors suggested potential reversal strongly.
Entry triggered at 1.0820 mechanically. This level cleared the Hammer high. Stop loss placed below the shadow at 1.0780. This risked 40 pips on the trade setup.
The take-profit target sat at 1.0900 resistance. This offered 80 pips potential profit. The 2:1 reward-to-risk ratio justified the trade. Professional traders seek these ratios consistently.
Price rallied immediately after entry. It reached 1.0900 within two trading days. The trade captured the full 80-pip movement. Proper pattern recognition delivered profits efficiently.
Risk management remains crucial always. Never risk over 2% per trade. Use stop losses without exception ever. Let winners run with trailing stops. This approach ensures long-term success.
Consider another example using Three White Soldiers. USD/JPY consolidated near 140.00 support. Three bullish candles appeared consecutively. Each closed near its daily high.
Volume increased progressively through the pattern. The third day saw 50% higher volume. This confirmed strong accumulation occurring. Entry triggered above the third candle.
The pattern projected a 200-pip minimum target. The price reached 142.00 within one week. Trailing stops protected profits effectively. Pattern trading requires patience and discipline.
Conclusion
Mastering candlestick patterns elevates your trading dramatically. These visual tools reveal market psychology instantly. Practice identifying formations on historical charts daily. Consistency builds pattern recognition skills.
Start with single candlestick patterns first. Progress to complex multi-candle formations gradually. Combine patterns with support and resistance always. This comprehensive approach improves success rates significantly.
Demo accounts offer risk-free practice opportunities. Test pattern recognition skills there first. Build confidence before risking real capital. Consistent practice develops pattern recognition abilities naturally.
Remember that these visual formations tell stories. Each pattern reflects trader psychology clearly. Understanding these stories improves trading decisions. Technical analysis becomes more intuitive over time.
FAQs
What does the candle on the chart mean?
Each candle represents price movement during a specific time period. The body shows opening and closing prices while wicks display the highest and lowest prices reached. Color indicates whether price rose or fell.
What do the wicks on candlestick charts mean?
Wicks show price extremes reached but not maintained during the period. Upper wicks indicate selling pressure at highs. Lower wicks reveal buying support at lows. Long wicks suggest volatility and potential reversal points.
What does the candle symbolize?
A candle symbolizes the battle between buyers and sellers during one time period. Green candles show buyer victory with closing prices above opening. Red candles indicate seller dominance with closes below opens.
When did candlestick charts first begin?
Candlestick charts began in Japan during the 1750s. Rice trader Munehisa Homma developed them to track market emotions and price patterns. Western traders discovered this technique in the 1990s through Steve Nison's writings.