Padrão de velas
)
Índice:
O que é um padrão de velas?
Como ler um padrão de velas
Seis padrões de velas de alta
Seis padrões de velas de baixa
Quatro padrões de velas de continuação
Benefícios da utilização de padrões de velas
Conclusão
Perguntas frequentes
A negociação não pode existir sem padrões de velas. Este é um dos componentes mais importantes de uma transação bem-sucedida. Todo o gráfico é essencialmente composto por velas, e os padrões de velas podem ser encontrados em toda parte. Mas, muitas vezes, para os iniciantes, a análise e os modelos de velas podem parecer complicados, mas, na verdade, não são. Neste artigo, explicaremos como analisar um gráfico usando velas, quais sinais as velas podem dar e como as velas são formadas em geral.
O que é um padrão de velas?
As velas (também chamadas de velas japonesas) são uma das formas de intervalo para representar um gráfico de preços. É chamado de intervalo, pois um objeto exibe tudo o que acontece no gráfico durante um intervalo de tempo especificado, correspondente ao período selecionado. Como resultado, cada período do gráfico é representado como um retângulo branco ou preto com elementos adicionais.
Pontos principais:
- Os padrões de velas permitem determinar uma inversão de tendência numa fase inicial ou o ponto de entrada numa negociação.
- Os principais parâmetros de uma vela são o corpo da vela, a sombra e a cor da vela.
- Os padrões de velas podem ser de alta, de baixa ou de continuação.
- Não se pode entrar numa negociação com base apenas nos padrões de velas; os padrões de velas são um complemento a uma estratégia de negociação.
Corpo da vela
O corpo da vela é a distância entre os preços de abertura e de fecho. Se o preço de fecho for superior ao preço de abertura, ou seja, se o mercado tiver subido, o corpo será branco. Se o preço de fecho for inferior ao preço de abertura, ou seja, se o mercado tiver descido, o corpo será preto. Quanto mais alta for a vela em crescimento, mais compradores existem no mercado e mais forte é a procura. Isto indica um crescimento do mercado. Quanto mais baixa for a vela em queda, mais vendedores existem. Isto indica um declínio no mercado.
Pavio/Sombra da vela
A sombra (pavio) é o preço máximo e mínimo para um determinado período. Na maioria das vezes, quanto mais longa a sombra, mais forte é o sentimento do mercado. Em algumas situações, uma sombra pode sinalizar uma mudança na tendência. Por exemplo, se uma vela estava a crescer fortemente, mas começou a cair no final e desenvolveu uma grande sombra superior e um corpo estreito, então, muito provavelmente, as compras dominaram durante a negociação e, no final da sessão, os investidores mudaram o seu ponto de vista. As velas sem sombras são chamadas de “Marubozu”. Uma vela Marubozu preta indica que o preço de abertura da vela correspondeu ao seu máximo e o preço de fechamento correspondeu ao seu mínimo, ou seja, prevaleceu uma tendência de baixa. O “marubozu” branco indica a situação oposta, quando prevaleceu uma tendência de alta.
Cor da vela
As plataformas de negociação geralmente oferecem dois pares de cores - verde e vermelho ou branco e preto. Não há diferença entre esses pares; ambos mostram um aumento ou uma queda no preço. Não é difícil adivinhar que uma vela vermelha e preta indica uma queda no preço, e uma vela verde ou branca indica um aumento. Uma vela vermelha indica que o preço caiu para a unidade de tempo selecionada. Digamos que está a negociar num intervalo de tempo de 5 minutos. Às 11:00, o preço do ativo era de 1000 $, às 11:05, o preço caiu para 995 $. Observe que isso não significa que o preço caiu gradualmente, talvez tenha feito movimentos ascendentes, flutuado, mas no final, após 5 minutos, o preço atingiu 995 $. O mesmo acontece com as velas verdes.
Como ler um padrão de velas
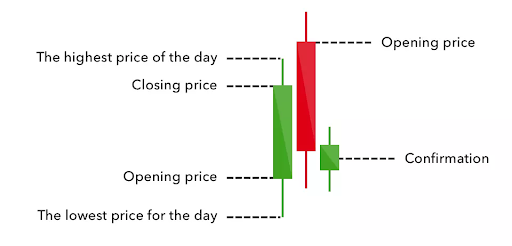
Uma vela diária representa os preços de abertura, alta, baixa e fechamento (OHLC) de um mercado. O corpo real retangular, ou apenas corpo, é colorido com uma cor escura (vermelho ou preto) para uma queda no preço e uma cor clara (verde ou branco) para um aumento no preço. As linhas acima e abaixo do corpo são chamadas de pavios ou caudas e representam a alta e a baixa máximas do dia. Em conjunto, as partes da vela podem frequentemente sinalizar mudanças na direção do mercado ou destacar movimentos potenciais significativos que muitas vezes precisam ser confirmados pela vela do dia seguinte. Assim, os padrões de velas podem ajudá-lo na sua estratégia de negociação, assim como a J2T com as nossas soluções https://j2t.com/solutions/mt5global/.
Seis padrões de velas de alta
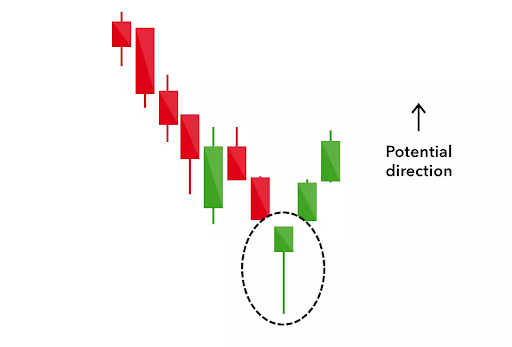
Martelo
Uma vela, conhecida como vela Martelo, cujo corpo é duas ou mais vezes menor do que a sombra inferior. A sombra superior está praticamente ausente. A cor do corpo da vela não importa. Após a formação dessa combinação, pode-se esperar que o preço suba.
)
Martelo invertido
Um padrão igualmente otimista é o martelo invertido. A única diferença é que a sombra superior é longa, enquanto a sombra inferior é curta. Isso indica uma pressão de compra, seguida por uma pressão de venda que não foi forte o suficiente para fazer o preço de mercado cair. O martelo invertido sugere que os compradores logo terão o controle do mercado.
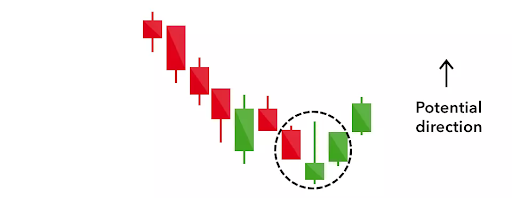)
Engolfamento de alta
Duas velas ficam lado a lado e têm direções (e cores) diferentes. O corpo da vela verde cobre completamente o corpo da vela vermelha, ou seja, absorve-a. Essa combinação indica que a tendência se formará em uma direção de alta.
)
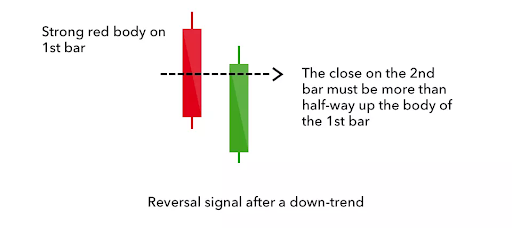
Linha perfurante
A linha perfurante também é um padrão de duas velas, composto por uma vela vermelha longa, seguida por uma vela verde longa.
Normalmente, há uma diferença significativa entre o preço de fechamento da primeira vela e a abertura da vela verde. Isso indica uma forte pressão de compra, já que o preço é empurrado para cima ou acima do preço médio do dia anterior.
)
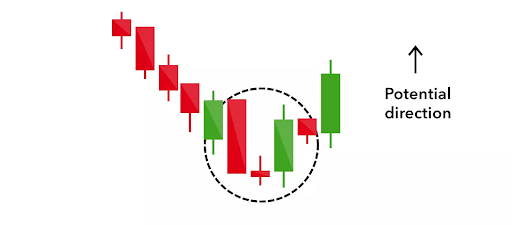
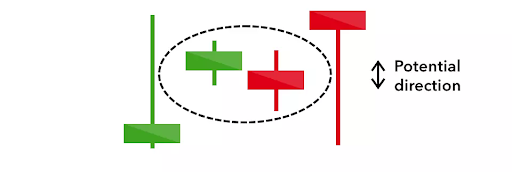
Estrela da manhã
Duas velas ficam lado a lado: a primeira está a cair, a segunda é um «doji» (a vela abriu e fechou ao mesmo preço) e o seu preço de abertura é inferior ao preço de fecho da primeira vela. Em seguida, vem a terceira vela, em alta. A cor do doji não importa. Após a formação dessa combinação, pode-se esperar que o preço suba.
)
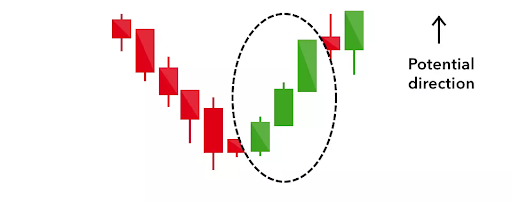
Três soldados brancos
O padrão dos três soldados brancos ocorre ao longo de três dias. Consiste em velas verdes (ou brancas) longas consecutivas com pequenas mechas, que abrem e fecham progressivamente mais altas do que no dia anterior.
É um sinal de alta muito forte que ocorre após uma tendência de baixa e mostra um avanço constante da pressão de compra.
)
Seis padrões de velas de baixa
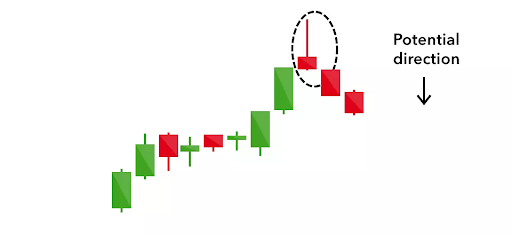
Homem enforcado
Esta vela aparece no final de uma tendência de alta. A vela é vermelha, o corpo é várias vezes menor do que o pavio, o pavio está direcionado para baixo. Tal vela significa que os compradores não tiveram força suficiente para "puxar" a vela para cima (para que ela ficasse verde), os vendedores (vendedores a descoberto) começaram a dominar.
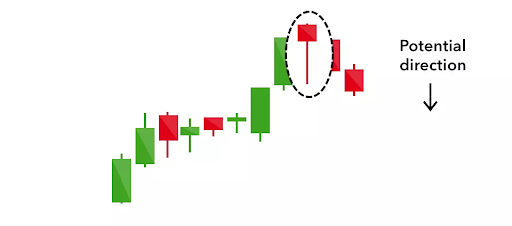)
Estrela cadente
Esta vela é um enforcado invertido, o pavio da vela está no topo, o corpo ainda é várias vezes menor que o pavio. Os compradores puxaram o preço para cima, mas em algum momento as forças dos vendedores começaram a dominar e empurraram o preço para baixo, formando um pavio. Esta vela também pode ser encontrada no início de uma tendência de baixa.
)
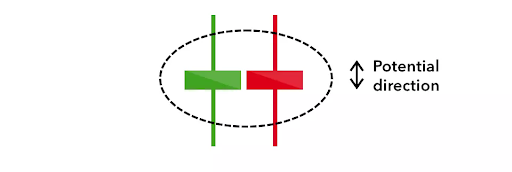
Engolfamento de baixa
A primeira vela é verde, a segunda é vermelha. A vela vermelha é maior do que a verde (tanto abaixo como acima); parece cobrir a vela verde. Também fala sobre as forças predominantes dos vendedores.
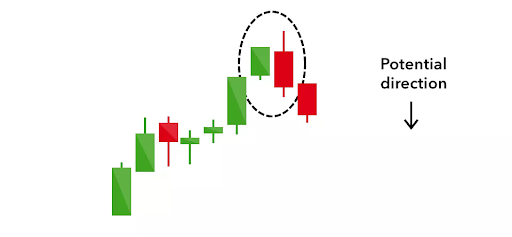)
Estrela da tarde
Este padrão nos gráficos de velas consiste em três velas, a primeira é verde, a segunda é verde curta (possivelmente com pavios) e a terceira é vermelha. A segunda vela reflete a luta pelo domínio entre compradores e vendedores, e a terceira vela vermelha indica a vitória dos vendedores.
)
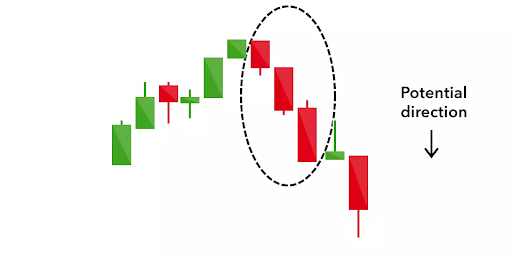
Três corvos pretos
O padrão consiste em três velas vermelhas sem pavios. Elas mostram o início de um movimento descendente confiante, e a ausência de pavios mostra que os compradores não tiveram força suficiente para elevar o preço, nem mesmo temporariamente.
)
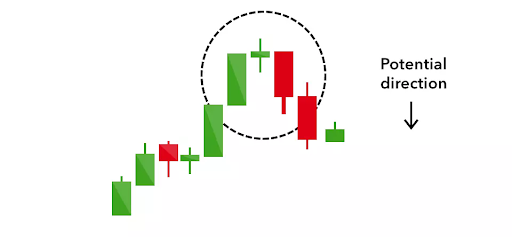
Nuvem escura
O padrão consiste em três velas, a primeira é de alta, a segunda é de baixa e é maior em tamanho do que a primeira, a terceira é de alta curta. Este padrão mostra a intenção confiante dos vendedores de puxar o preço para baixo.
)
Quatro padrões de velas de continuação
As velas que não refletem o domínio dos compradores ou vendedores são chamadas de padrões de continuação. Elas podem ajudar os traders a identificar um período de descanso no mercado, quando há indecisão do mercado ou movimento neutro dos preços.
Doji
O padrão Doji aparece quando os preços de abertura e fechamento coincidem. Essa vela refletirá a luta entre compradores e vendedores, que no final das contas não leva a lucro para nenhuma das partes. Embora a vela Doji em si não reflita a superioridade de nenhum dos lados, ela pode ser frequentemente encontrada em outros padrões, como a estrela da manhã de alta e a estrela da noite de baixa.
)
Pinhão
O padrão spinning top é um pouco semelhante ao Doji, a vela tem sombras na parte superior e inferior e um corpo pequeno. Normalmente, esse padrão indica uma batalha entre uma tendência de alta e uma tendência de baixa, e a vela após o spinning top pode definir a tendência. Se houver uma vela verde, a tendência é de alta; se for vermelha, a tendência é de baixa. Isso mostrará qual lado venceu após lutarem entre si.
)
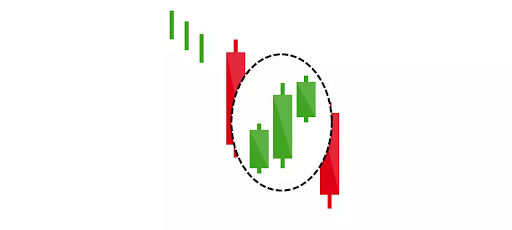
Três métodos em queda
Este padrão pode ser confuso para um trader inexperiente; ele sinaliza uma continuação da tendência atual, seja de alta ou de baixa. O modelo consiste em uma vela vermelha longa, três pequenas verdes e o modelo também fecha com uma vela vermelha longa. As velas verdes estão dentro das velas vermelhas. Isso sugere que os touros em algum momento quiseram reverter o mercado, mas sua força não foi suficiente e os ursos novamente assumiram o controle.
)
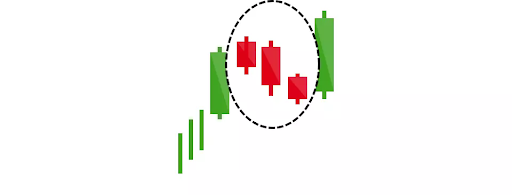
Três métodos ascendentes
O modelo oposto, tudo é igual ao dos «três métodos de queda», só que a tendência é de alta, entre duas velas verdes longas há três vermelhas, sem ultrapassar os limites das verdes. Este padrão nos gráficos de velas reflete um domínio de curto prazo dos ursos, mas os touros logo retomam o controle do mercado.
)
Benefícios da utilização de padrões de velas
Os padrões de velas são uma representação visual dos movimentos de preços nos mercados financeiros, oferecendo uma rica variedade de informações para os traders. A sua utilização proporciona vários benefícios importantes:
- Melhor compreensão do mercado: os padrões de velas iluminam a interação das forças de oferta e procura dentro de um período de tempo específico. Eles retratam o sentimento do mercado, o momentum e as potenciais reversões, fornecendo informações valiosas sobre a ação dos preços.
- Identificação precoce de tendências: reconhecer padrões familiares permite que os traders antecipem tendências potenciais antes que elas se manifestem totalmente. Essa vantagem inicial pode ser crucial para entrar em posições em pontos de entrada favoráveis ou sair antes de quedas significativas nos preços.
- Confirmação das decisões de negociação: os padrões de velas podem validar estratégias e sinais de negociação existentes. Por exemplo, um padrão de alta que surge após uma tendência de baixa pode confirmar uma potencial ruptura e aumentar a confiança numa ordem de compra.
- Gestão de risco: certos padrões de velas podem indicar potenciais reversões ou consolidações de preços. Reconhecer esses padrões permite que os traders ajustem suas posições ou até mesmo saiam das negociações para minimizar as perdas.
- Maior eficiência de negociação: Ao compreender os padrões de velas, os negociadores podem avaliar rapidamente as condições do mercado e identificar oportunidades potenciais sem depender exclusivamente de indicadores técnicos complexos.
- Apelo visual e compreensão intuitiva: O padrão de velas é visualmente apelativo e fácil de compreender, tornando mais fácil para os traders compreenderem a dinâmica do mercado e interpretarem a ação dos preços.
- Versatilidade em todos os mercados: os padrões de velas podem ser aplicados em vários mercados financeiros, incluindo ações, forex, commodities e criptomoedas, oferecendo uma linguagem universal para compreender o movimento dos preços.
Conclusão
Embora os padrões de velas sejam uma ferramenta poderosa, é essencial lembrar que eles não são infalíveis. Eles devem ser usados em conjunto com outras análises técnicas e fundamentais para tomar decisões de negociação informadas.
Perguntas frequentes
Qual é o padrão de velas mais3 fiável?
Todos os padrões de velas japonesas são fiáveis quando usados em conjunto com análises fundamentais e técnicas.
Um gráfico de velas é diferente de um gráfico de barras?
Os gráficos de velas e os gráficos de barras mostram a movimentação dos preços, mas os gráficos de velas fornecem uma representação visual mais detalhada, tornando-os melhores para identificar padrões e o sentimento do mercado. Os gráficos de barras são mais simples e concisos.
A análise de padrões de velas realmente funciona?
A análise de gráficos de velas é parte integrante da negociação e, sem dúvida, deve ser utilizada, mas também não devemos esquecer a análise fundamental e técnica.
Os padrões de velas podem ser usados para prever pontos de viragem do mercado?
Para determinar uma inversão de tendência, é necessário basear-se não apenas nos padrões de velas, mas também em outros aspetos, como movimento médio dos preços, liquidez, desequilíbrio e outros atributos da análise técnica.