DAX 40 Technical Analysis: Mastering Chart Patterns and Trading Strategies
Why Technical Analysis Works Exceptionally Well for DAX 40
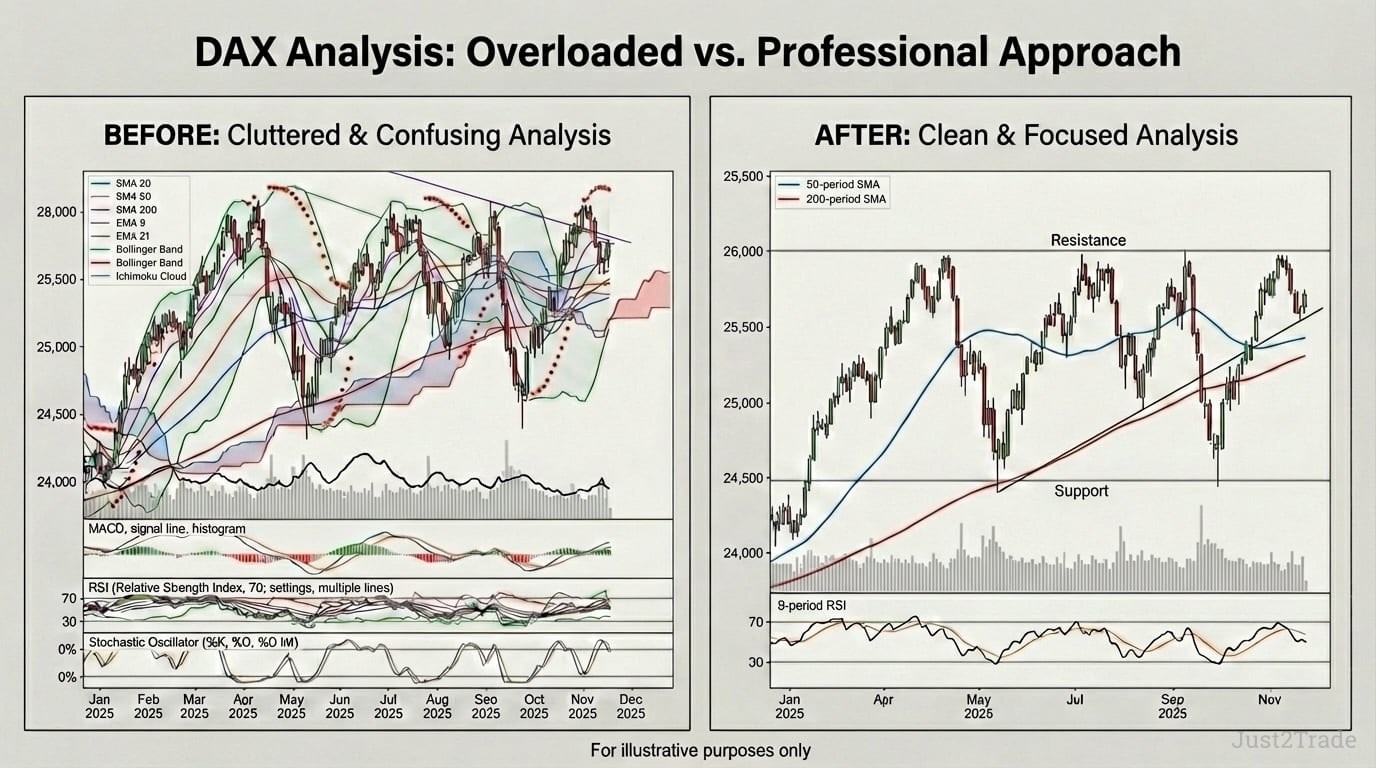
Essential Technical Indicators for DAX 40 Trading
High-Probability Chart Patterns for DAX 40
Support and Resistance Mastery on DAX 40
Complete DAX 40 Trading Strategies
Advanced Technical Analysis Concepts for DAX 40
Risk Management and Position Sizing for DAX Trading
Common Mistakes and How to Avoid Them
Conclusion: Integrating Technical Analysis for DAX Success
Frequently Asked Questions
Technical analysis is arguably the most powerful toolkit for trading DAX 40 index successfully. Germany's flagship benchmark – 40 blue-chip companies tracked on the Frankfurt Stock Exchange via the Xetra platform – responds remarkably well to chart patterns, German 40 technical indicators, and price action strategies. Whether you favour DAX 40 day trading strategies during the European session or DAX swing trading over multi-day setups, this guide covers optimised indicator settings, high-probability formations, complete German index trading strategies, and the risk management discipline that separates profitable traders from the rest.
Key Takeaways
- DAX 40's high liquidity on Xetra creates clean, reliable technical signals
- MACD (8-17-9 intraday), RSI (9-period), and the 20/50/200 moving average trio form the essential indicator toolkit
- Head and shoulders, double tops/bottoms, and triangle patterns appear frequently on DAX charts
- Three complete strategies – trend following, mean reversion, and breakout – cover any market condition
- Risk management and position sizing determine long-term survival more than any indicator ever will
Why Technical Analysis Works Exceptionally Well for DAX 40
Not every market responds equally to technical analysis. The DAX 40 happens to be one of Europe's most technically "clean" indices – and there are structural reasons for that.
The index is a performance index with dividend reinvestment, traded on the Xetra electronic platform between 09:00 and 17:30 CET. That concentrated session compresses institutional activity into a tight window, creating strong volume-driven moves that technical analysis captures reliably. In January 2026 alone, average daily Xetra trading volume reached €7.86 billion – up from €5.68 billion the previous year. DAX also shows strong constituent correlation with European economic data releases (ECB decisions, German PMI, ZEW sentiment), which creates sharp directional moves that technical tools capture effectively.
Liquidity and Clean Price Action
Think of liquidity as the engine behind reliable DAX price action trading. On thinly traded instruments, patterns break down because a single large order can spike price through support or resistance without genuine market participation. The DAX doesn't suffer from this problem. With SAP alone generating €10.77 billion in Xetra turnover in January 2026, the index constituents produce deep order books and tight spreads.
The result? Candlestick patterns print cleanly, moving average bounces occur at predictable levels, and trend lines hold for extended periods before decisive volume-confirmed breaks. If you've struggled with false signals on less liquid assets, pull up a DAX chart – the difference is immediate.
Institutional Respect for Technical Levels
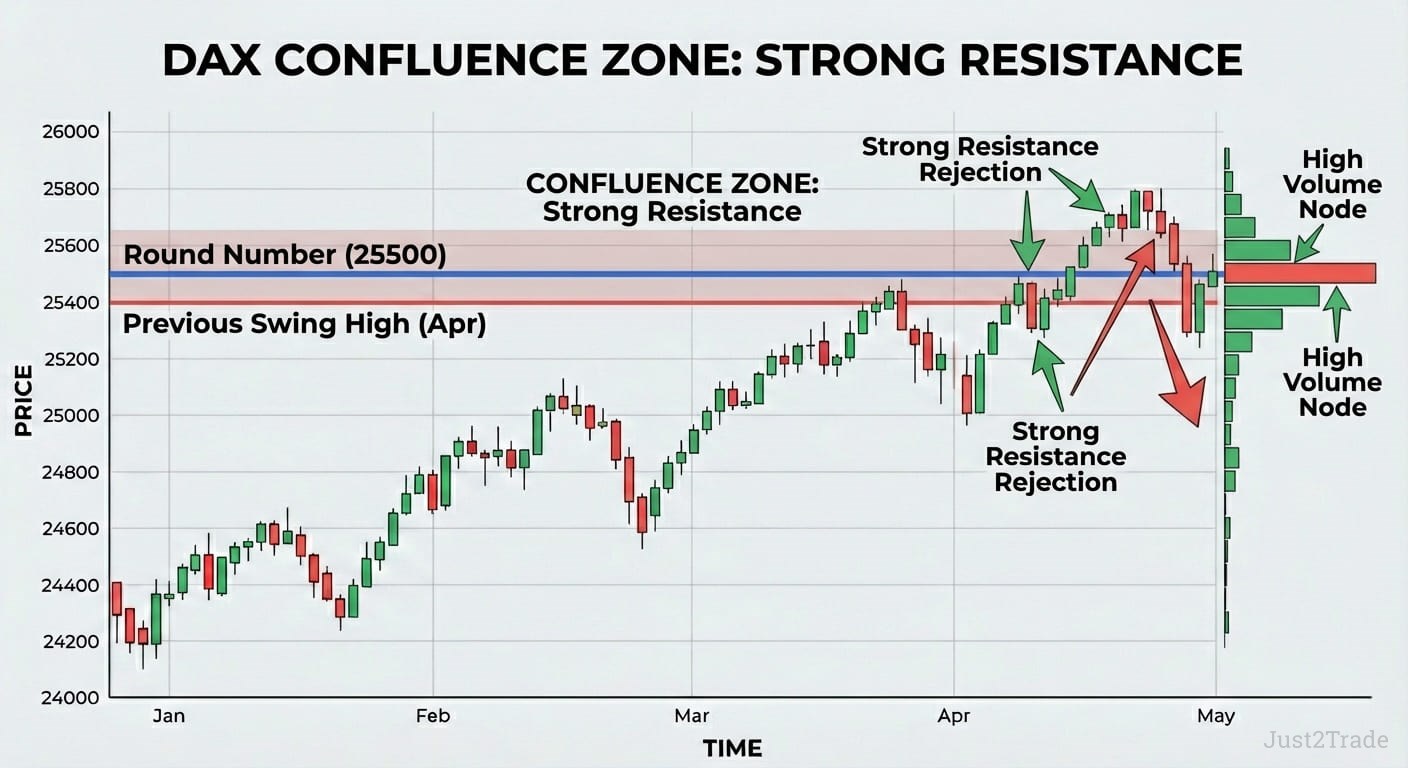
Banks, hedge funds, and proprietary trading firms operating in the DAX rely heavily on technical analysis, applying pattern recognition standards endorsed by the Technical Analysis Society. When major institutional players defend the same support and resistance levels, a self-fulfilling prophecy effect emerges. Round-number psychological levels (24,000, 25,000, 26,000) and previous highs consistently attract concentrated buying or selling pressure.
The DAX reached its all-time high of 25,507.79 on 13 January 2026, then respected that level as resistance during subsequent weeks. That's institutional memory at work – and it makes technical trading on the German index significantly more predictable.
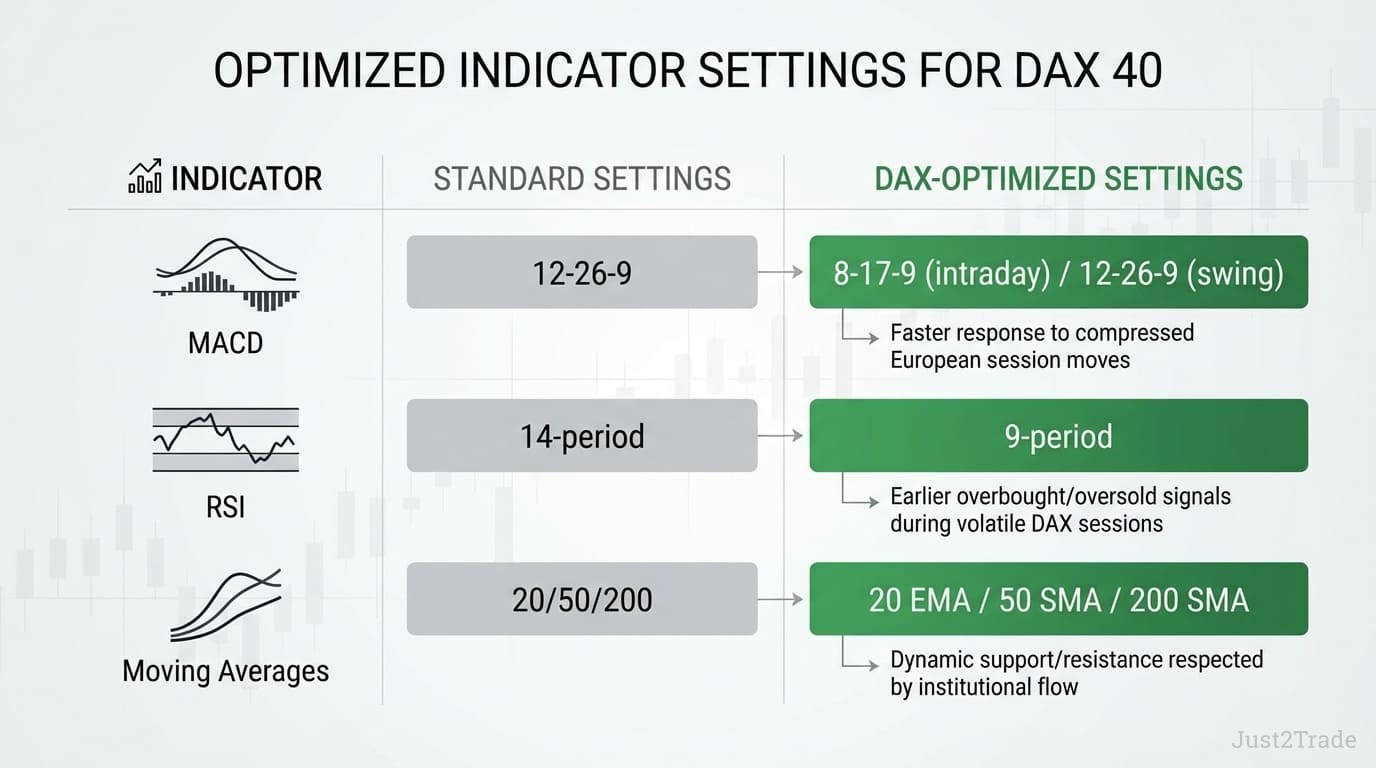
Essential Technical Indicators for DAX 40 Trading
Not all indicator settings work equally well across markets. The DAX's concentrated session and medium-to-high volatility profile reward faster parameter optimisation. Here's the toolkit:
| Indicator |
Standard Settings |
DAX-Optimised Settings |
Rationale |
| MACD |
12-26-9 |
8-17-9 (intraday) / 12-26-9 (swing) |
Faster response to compressed European session moves |
| RSI |
14-period |
9-period |
Earlier overbought/oversold signals during volatile DAX sessions |
| Moving Averages |
20 / 50 / 200 |
20 EMA / 50 SMA / 200 SMA |
Dynamic support/resistance respected by institutional flow |
MACD – Momentum and Trend Identification
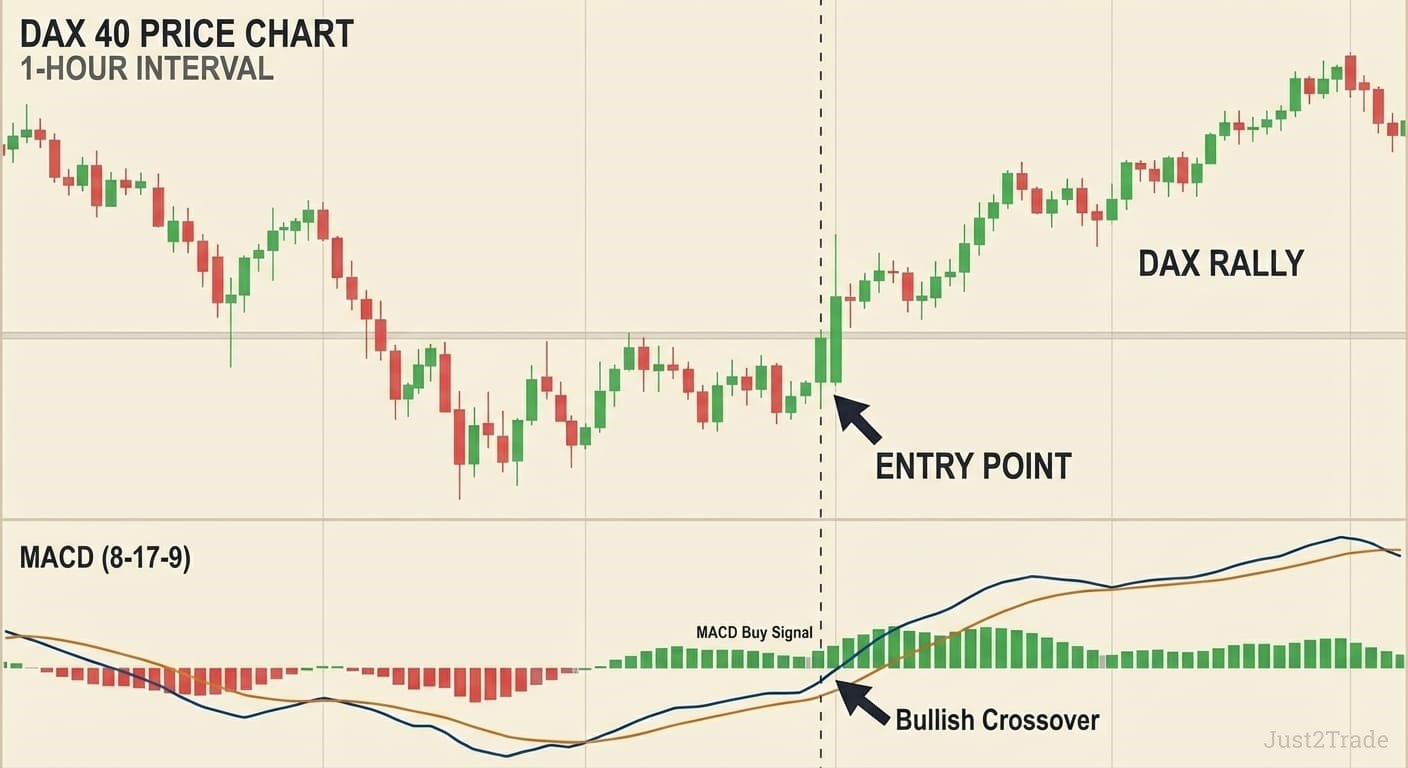
The Moving Average Convergence Divergence (MACD) calculates the difference between a fast and slow exponential moving average, then plots a signal line for crossover triggers. The standard formula uses 12-period EMA minus 26-period EMA with a 9-period signal line.
For DAX intraday trading, I favour 8-17-9 parameters. The European session packs its major moves into roughly eight hours, so faster settings capture momentum shifts before the standard MACD catches up. Three signal types matter most: bullish/bearish crossovers for entries, divergences for reversal warnings, and centerline crosses for trend confirmation.
Practical scenario: DAX trades above 24,800 with MACD crossing bullishly above the signal line. You enter long, trailing stop below the 20 EMA. When MACD crosses bearishly, you exit – potentially capturing several hundred points during a trending session.
RSI – Overbought/Oversold and Divergence Trading
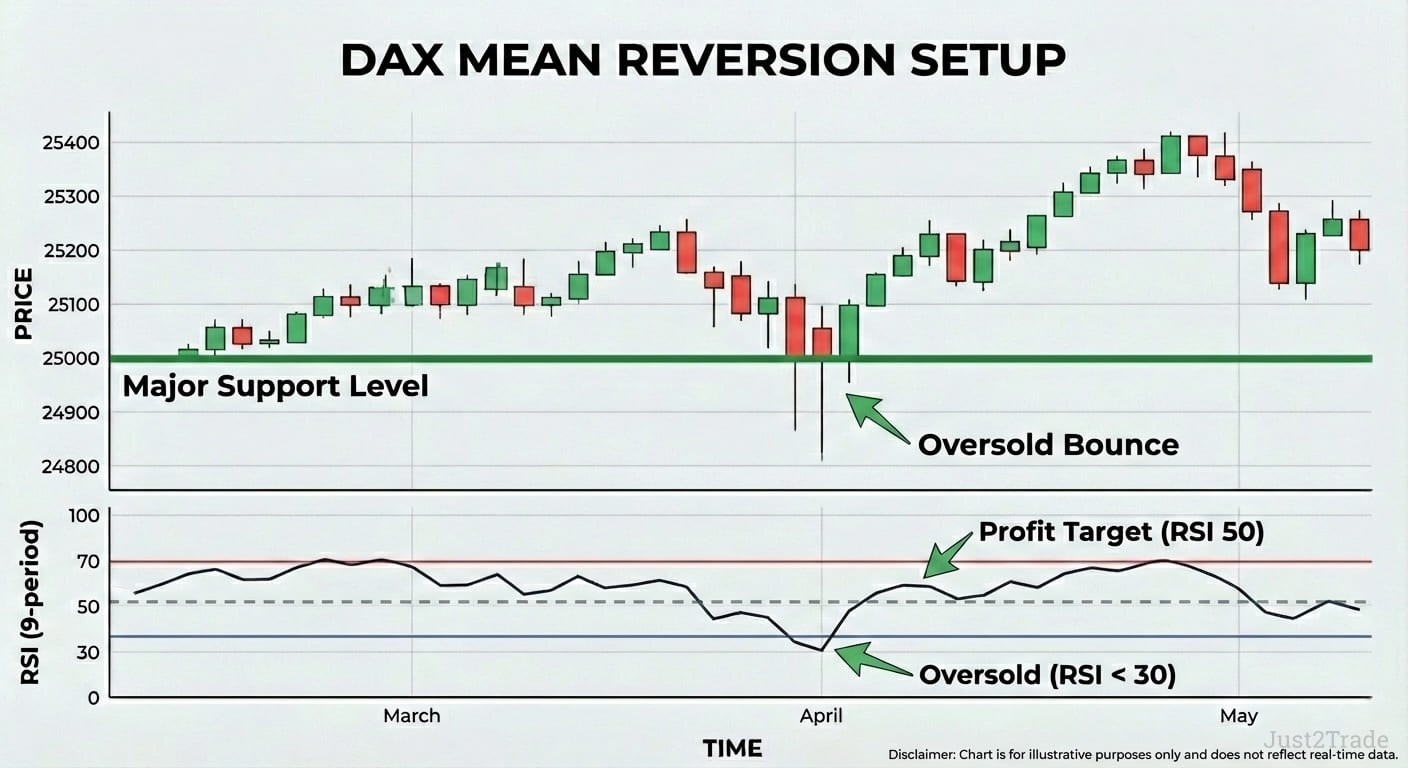
The Relative Strength Index measures momentum using the formula RSI = 100 − (100 / (1 + RS)), where RS equals the average gain divided by the average loss. Readings above 70 signal overbought conditions; below 30 indicates oversold territory.
For DAX 40 chart analysis, a 9-period RSI provides faster signals than the standard 14-period setting. The real edge lies in divergence trading. When DAX price prints a higher high but RSI shows a lower high – that bearish divergence often precedes a meaningful pullback, especially at a known resistance level. RSI divergence combined with support and resistance confluence consistently delivers high-probability reversal signals.
Moving Averages – Dynamic Support, Resistance, and Trend
Moving averages – including Simple (SMA), Exponential (EMA), and Weighted (WMA) types – serve a dual purpose: trend identification and dynamic support/resistance. For DAX technical trading, three periods dominate:
- 20 EMA – short-term trend and trailing stop reference
- 50 SMA – medium-term trend filter and key bounce level
- 200 SMA – the long-term "line in the sand" separating bull from bear territory
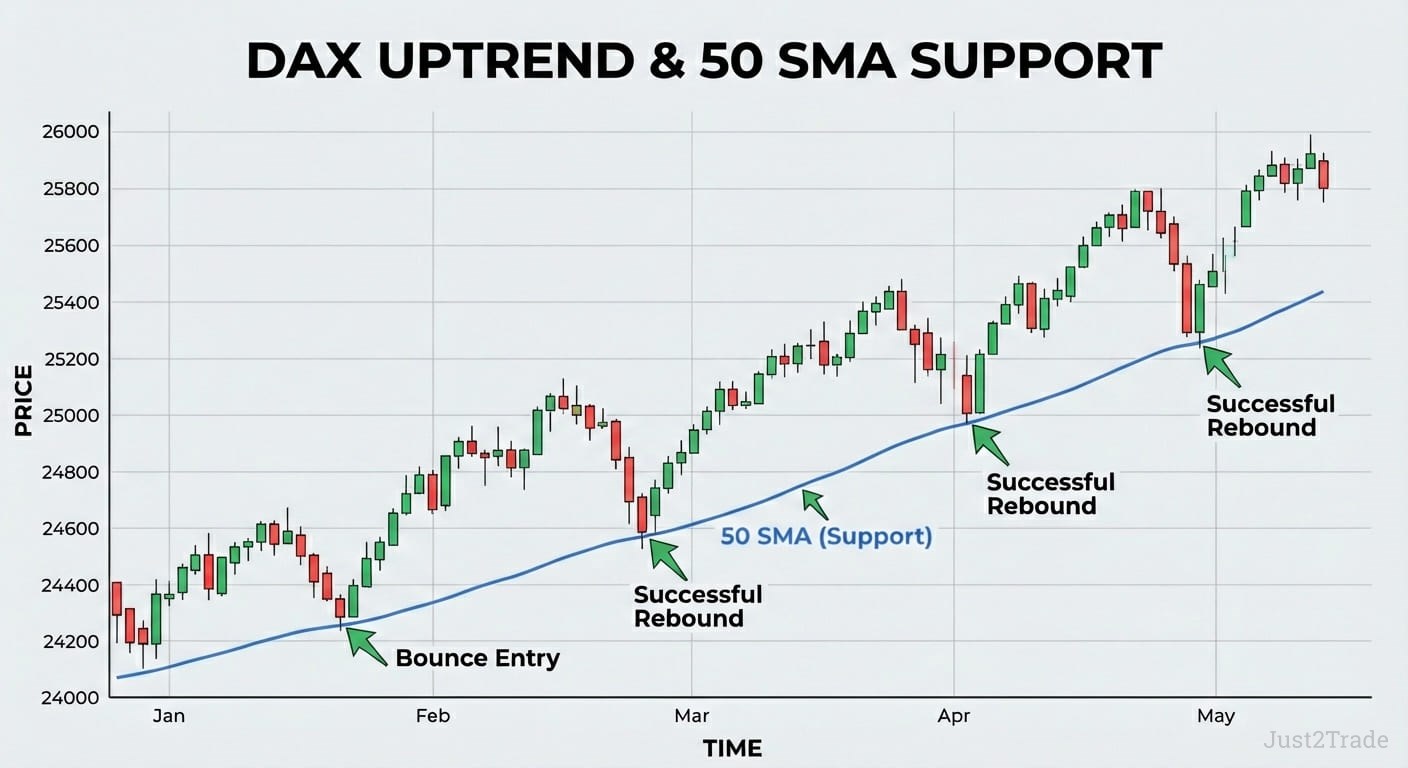
The DAX 200-day moving average currently sits near 24,610, acting as a floor beneath the market. A golden cross (50 SMA crossing above 200 SMA) signals bullish momentum; a death cross warns of sustained weakness. DAX price action historically shows strong respect for major moving averages, creating reliable bounce-trade opportunities whenever the index pulls back to these dynamic levels.
High-Probability Chart Patterns for DAX 40
DAX chart patterns are the visual language of technical analysis. They appear across all timeframes – from 5-minute scalping charts to daily swing setups – and volume analysis, tracked through indicators like On Balance Volume (OBV) and Volume Weighted Average Price (VWAP) using high-quality Xetra data, validates their breakout signals.
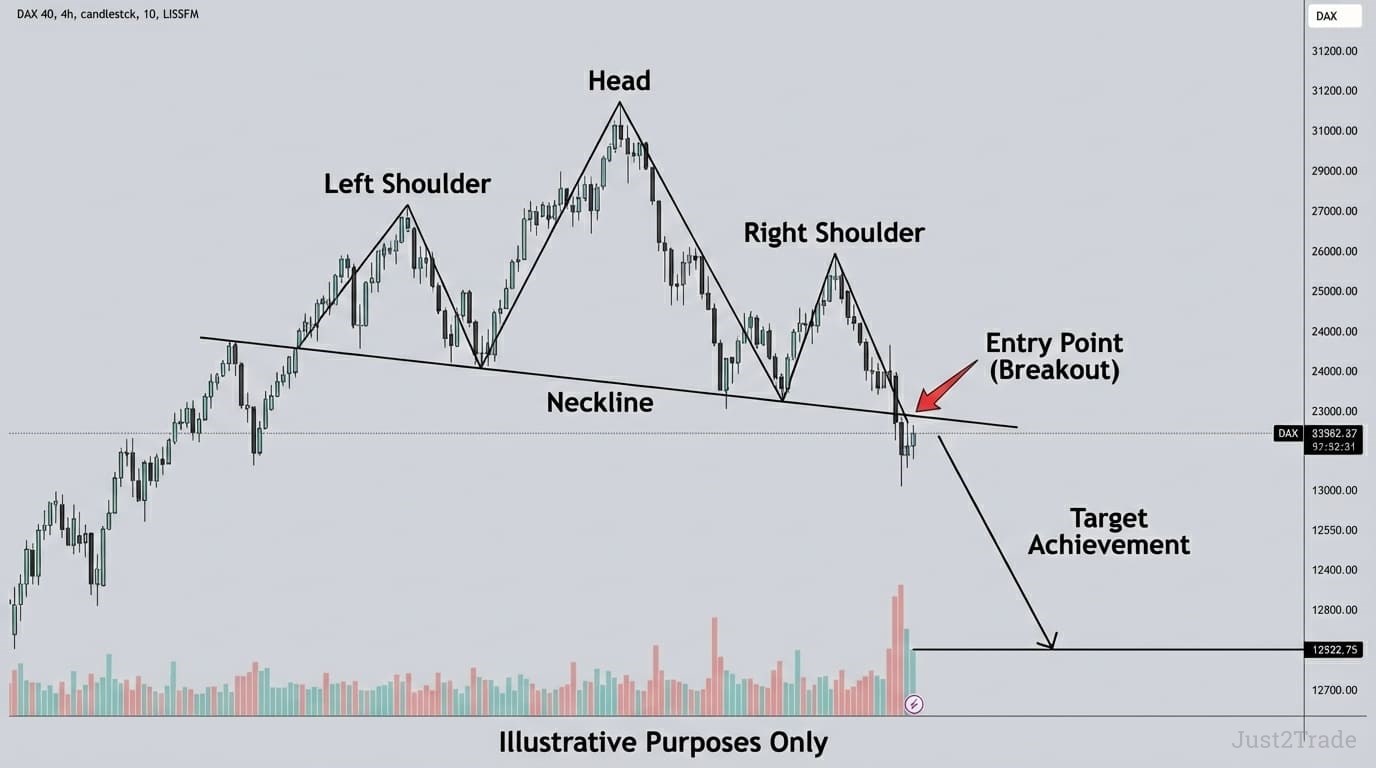
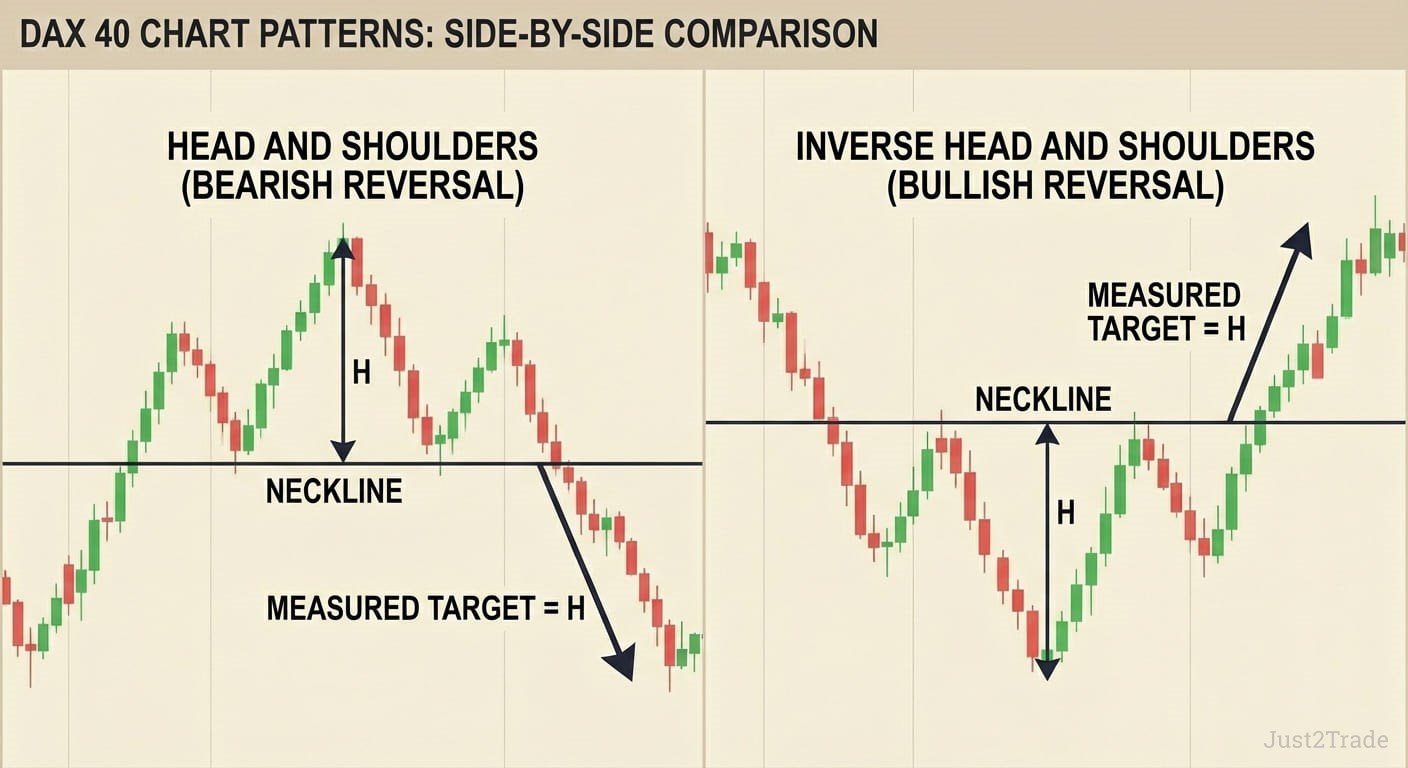
Reversal Patterns – Head and Shoulders, Double Tops/Bottoms
The DAX 40 forms particularly clear reversal chart patterns thanks to its institutional-grade liquidity. The head and shoulders remains the most reliable reversal formation. It consists of three peaks – a higher central "head" flanked by two lower "shoulders" – with a neckline connecting the reaction lows. When price breaks below the neckline on strong volume, the measured target equals the head-to-neckline distance projected downward.
Double tops and double bottoms form at major support and resistance levels. A double top signals bearish reversal when price fails twice at the same resistance; a double bottom signals bullish reversal after two tests of support hold.
Continuation Patterns – Triangles, Flags, and Wedges
When DAX consolidates mid-trend, continuation chart patterns signal imminent resumption:
- Ascending triangles – flat resistance with rising lows; typically break bullishly
- Symmetrical triangles – converging trend lines; break in the direction of the prior trend roughly 65% of the time
- Bull/bear flags – brief pullbacks against the trend; tight flags with declining volume produce the strongest breakouts
- Rising/falling wedges – gradual convergence against the trend direction; wedge breaks carry strong momentum
Target calculation follows the measured-move principle: project the pattern's height from the breakout point.
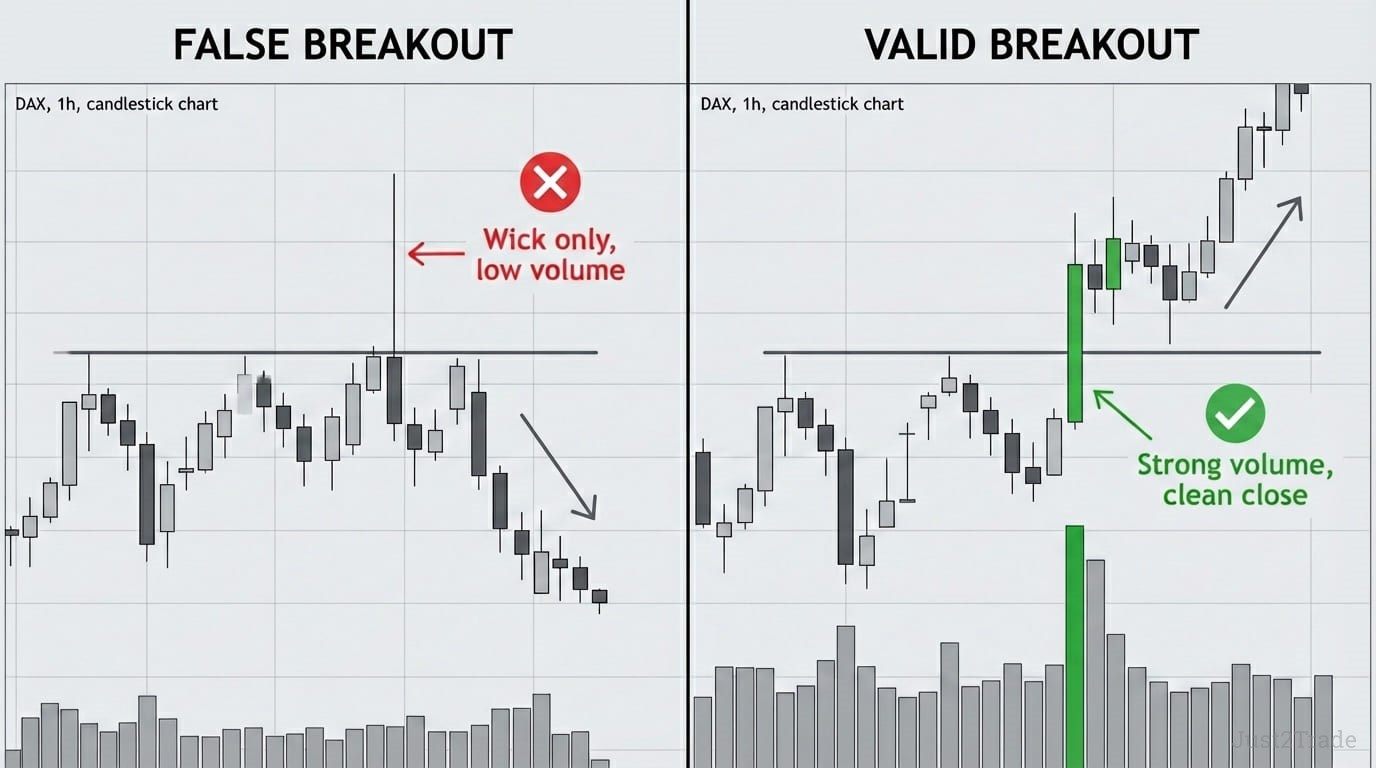
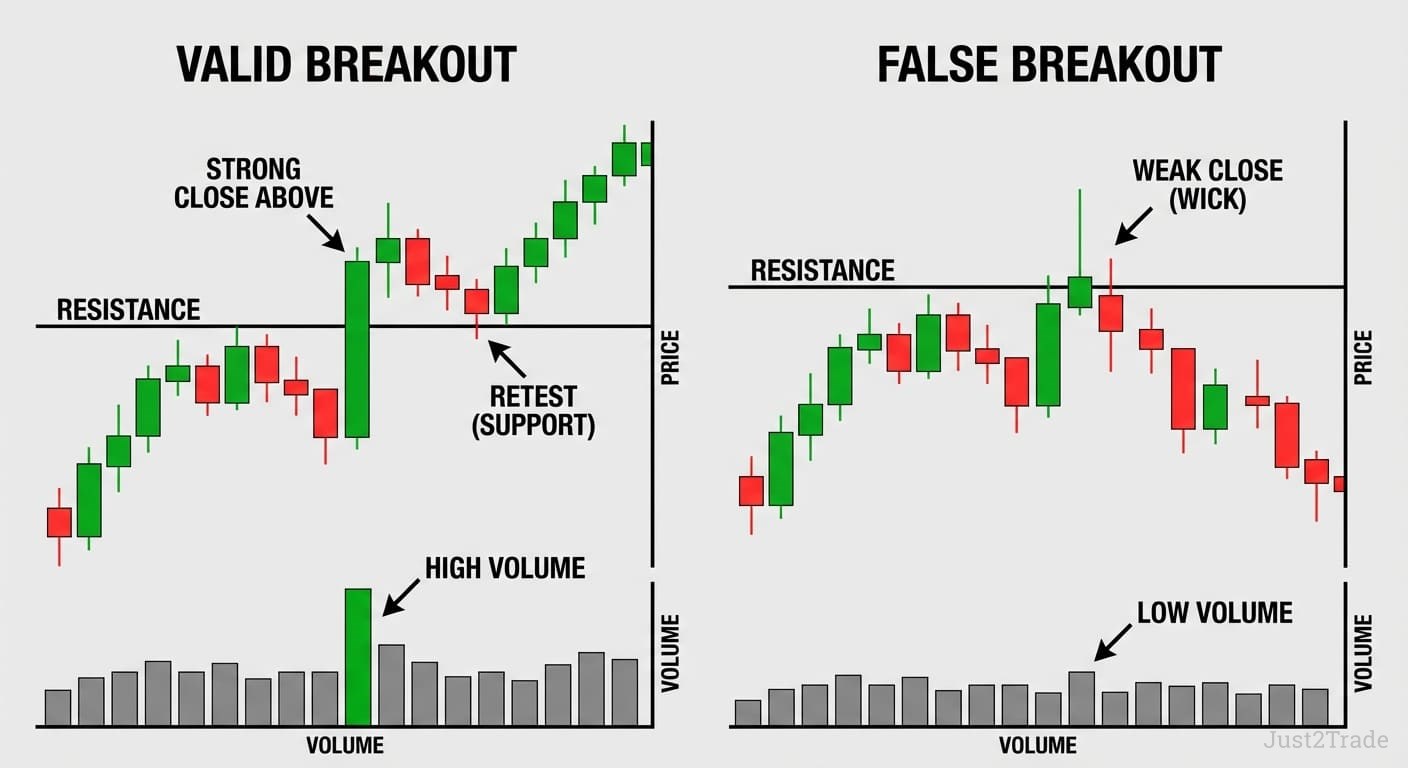
Pattern Confirmation and False Breakout Avoidance
False breakouts plague pattern traders, and the DAX is no exception during low-volume pre-market hours. Three confirmation filters dramatically improve success:
- Volume confirmation – valid breakouts occur on volume at least 50% above the 20-period average; OBV rising into the breakout confirms genuine participation
- Close vs. wick – a candle must close beyond the pattern boundary, not merely spike through with a wick
- Retest entry – wait for price to break, pull back to the broken level (role reversal), then enter on a confirming candlestick pattern
Support and Resistance Mastery on DAX 40
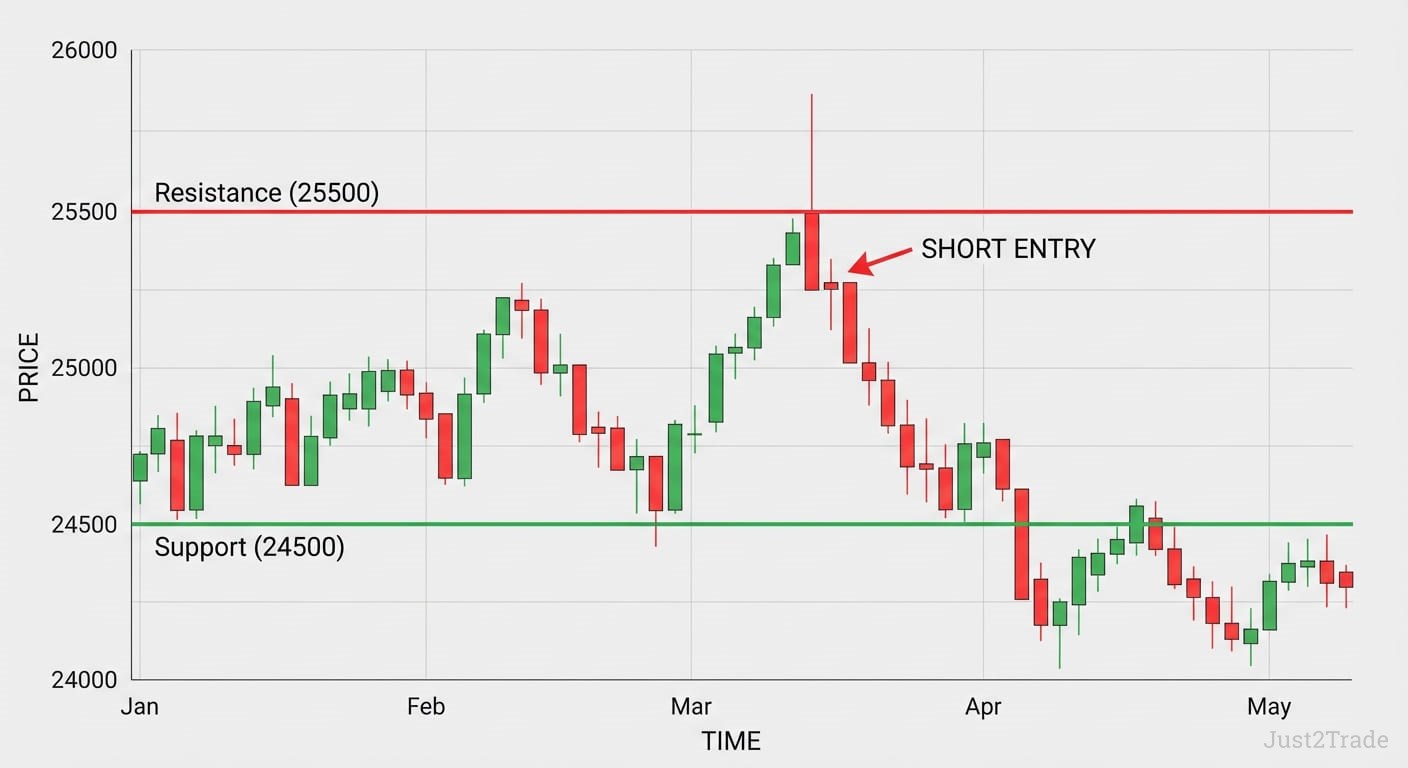
If technical analysis has a single foundational concept, it's DAX support resistance levels. Every indicator, every pattern, every strategy ultimately revolves around price zones where buyers and sellers concentrate.
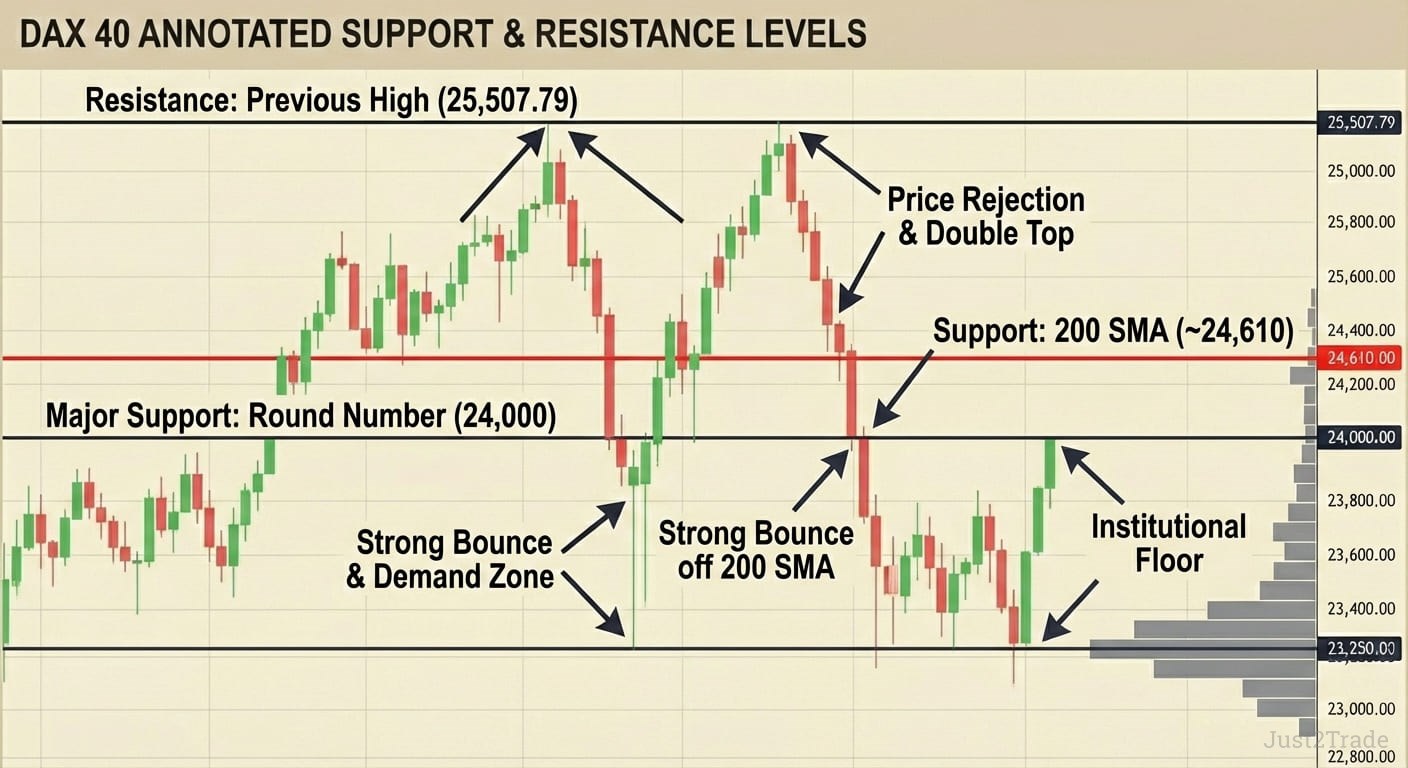
Identifying High-Probability Support and Resistance Levels
The strongest levels form where multiple sources converge:
- Horizontal levels – previous swing highs and lows
- Trend lines – constructed by connecting two or more swing highs (descending resistance) or swing lows (ascending support); validated when price touches the line at least three times. Steeper trend lines are less sustainable; the DAX respects well-drawn trend lines particularly on higher timeframes, and volume-confirmed breaks signal potential reversals
- Round numbers – psychological magnets like 24,000 or 25,000 (which the DAX cleared in January 2026)
- Volume profile nodes – price levels where the highest volume traded historically
- Fibonacci retracement levels – especially 38.2% and 61.8%
When a round number aligns with a previous high, a trend line, and a volume node, you've found a confluence zone – the highest-probability reaction point on the chart.
)
Trading Bounces at Support and Resistance
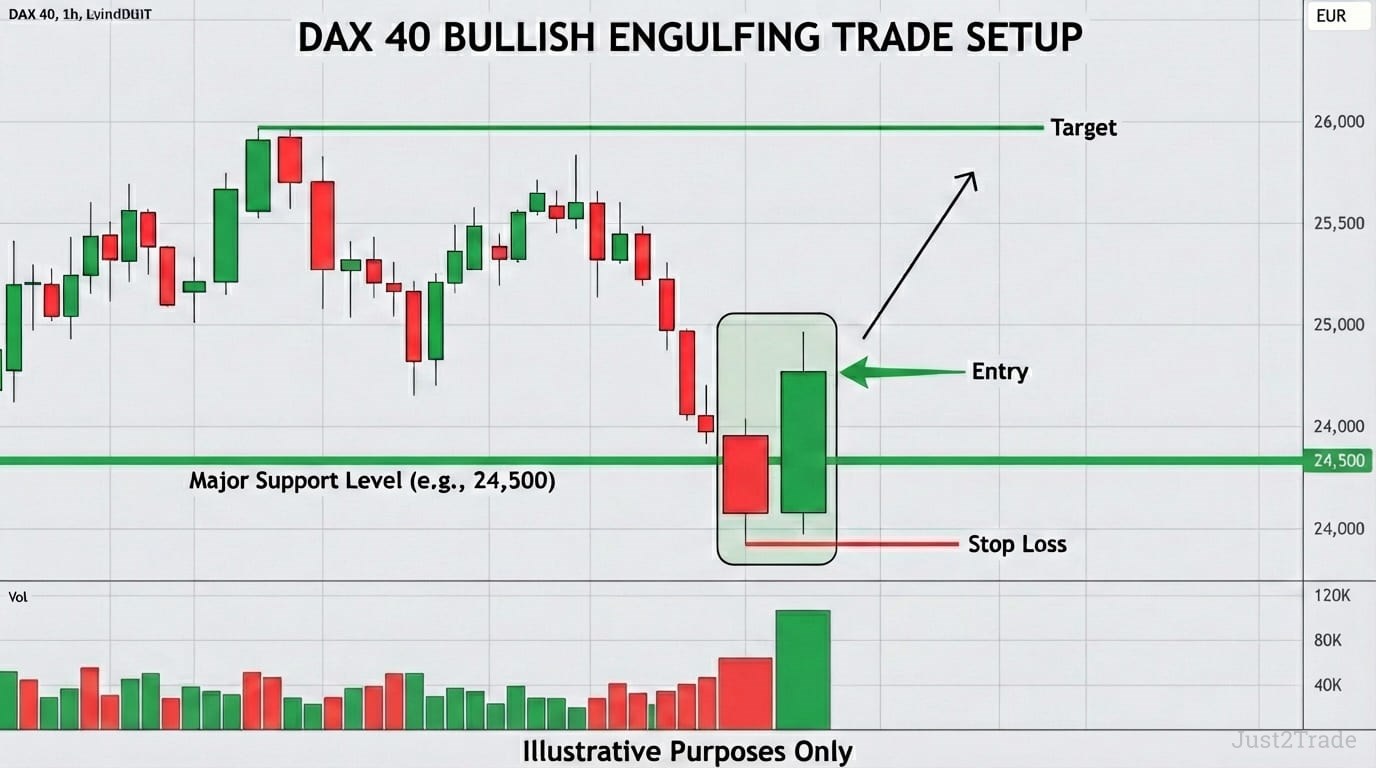
Bounce trading at major levels offers a high win rate when you trade selectively. The setup requires: price arriving at a pre-identified strong level, a candlestick pattern confirming rejection, and ideally an RSI reading near or below 30 for longs. These Japanese-origin reversal candlestick patterns – hammer, bullish engulfing, doji – work on all DAX timeframes from 5-minute to daily charts, though confirmation from the next candle and supporting volume increases reliability. Continuation patterns like rising three methods signal that the trend will resume after brief consolidation.
Place your stop loss beyond the level – roughly 20-30 points past the wick low – and target the next significant level. Risk no more than 1% per bounce trade; this position sizing guideline keeps losses manageable while the high win rate compounds returns over time.
)
Breakout Trading and False Breakout Avoidance
Breakouts through major support and resistance generate the most explosive DAX moves. Valid breakouts feature strong volume participation, while false breakouts fizzle on low volume. After a confirmed break, old resistance becomes new support (role reversal), offering a lower-risk retest entry. The DAX retests broken levels more often than not – patience here pays.
)
Complete DAX 40 Trading Strategies
Theory is useful, but executable strategy frameworks generate returns. Below are three complete systems – each backtested on historical DAX data before live deployment, a non-negotiable requirement for any serious trading strategy. Day trading employs intraday-focused versions of these approaches, using faster indicator settings (5, 9, 13 periods) and requiring sufficient intraday volatility – typically 150+ points of daily range – for profitable execution.
| Feature |
Trend Following |
Mean Reversion |
Breakout |
| Market condition |
Trending |
Ranging / correcting |
Consolidation |
| Win rate |
~40–45% |
~60–65% |
~45–50% |
| Risk:Reward |
1:2 to 1:4 |
1:1 to 1:1.5 |
1:2 to 1:3 |
| Trade frequency |
Medium |
High |
Low |
| Emotional demand |
Patience during drawdowns |
Discipline to fade moves |
Patience waiting for setups |
| Best timeframe |
4H / Daily |
1H / 4H |
1H / 4H |
Trend Following Strategy – Riding DAX Momentum
| Component |
Rule |
| Trend filter |
DAX above 50 SMA (bullish) or below (bearish) |
| Entry trigger |
MACD bullish crossover (8-17-9 intraday / 12-26-9 swing) |
| Stop loss |
Below 20 EMA or most recent swing low |
| Trailing stop |
20 EMA – exit when price closes below |
| Profit target |
Next major resistance, or MACD bearish crossover |
This strategy captures sustained DAX directional moves during trending phases. The 50 SMA keeps you on the right side; MACD provides entry timing; the 20 EMA trailing stop locks in profits while giving the trade room to breathe. Emotional discipline is critical – you must tolerate several small losses for the occasional large winner that makes the system profitable.
Mean Reversion Strategy – Trading DAX Extremes
Enter long when RSI (9-period) drops below 30 at a major support level; enter short when RSI exceeds 70 at major resistance. Target: RSI returning to 50, which typically aligns with the next support/resistance zone. Stop loss: beyond the key level, roughly 25-40 points. The high win rate compensates for the tighter risk-reward ratio, making this approach effective for ranging markets.
)
Breakout Strategy – Capturing Volatility Expansion
Identify chart pattern consolidations (triangles, flags, wedges) on the 1-hour or 4-hour DAX chart. Wait for a volume-confirmed breakout. Enter on the retest of the broken level. Target: the measured move (height of the pattern projected from the breakout). Stop loss: inside the pattern, beyond the opposite boundary. Fewer signals but stronger risk-reward ratios – ideal for patient traders.
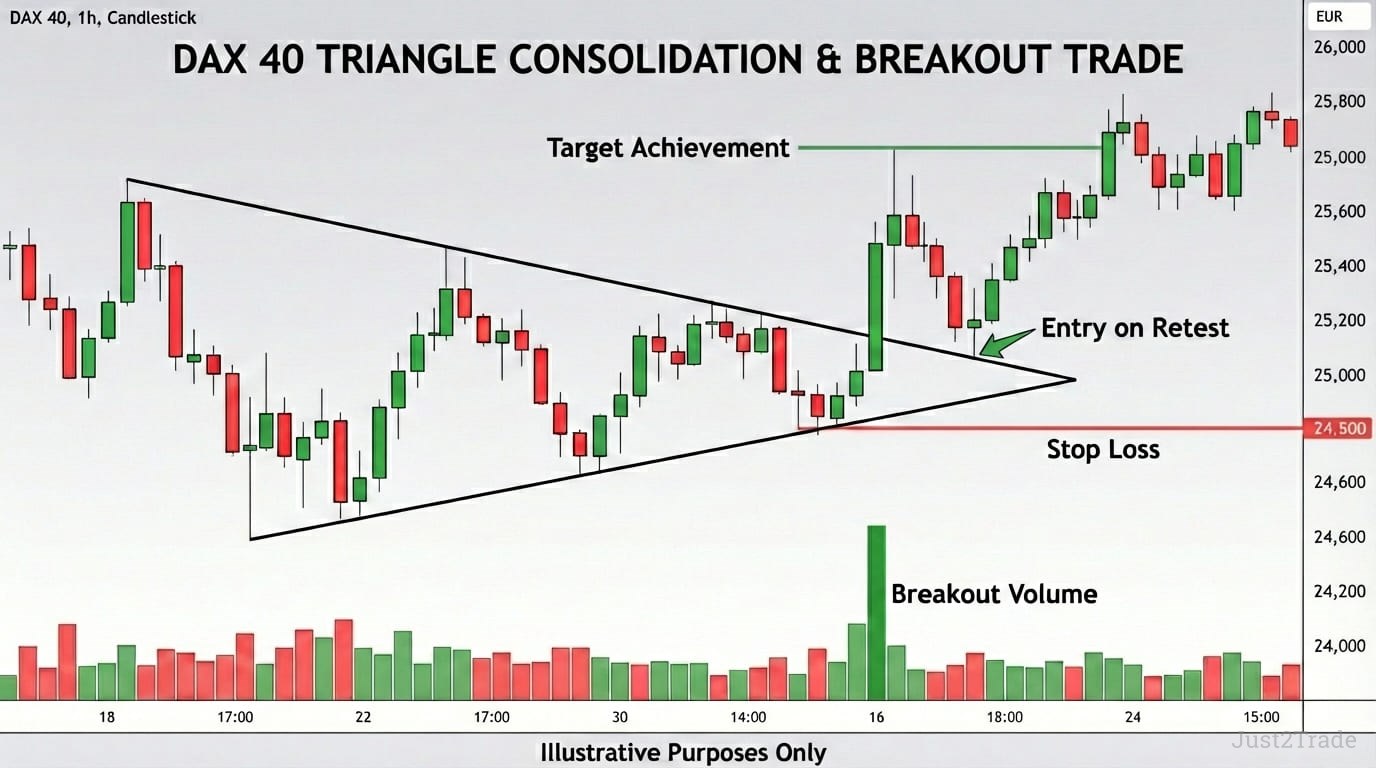)
Advanced Technical Analysis Concepts for DAX 40
Once you've mastered the core indicators and patterns, these advanced techniques – Fibonacci retracement, pure price action, and candlestick pattern mastery for improved entry precision – refine your execution.
Fibonacci Retracement for Precision Entries
Draw Fibonacci retracement from a significant DAX swing low to swing high. The key levels – 23.6%, 38.2%, 50%, 61.8%, and 78.6% – frequently act as pullback support during uptrends, with the 38.2% and 61.8% zones showing the strongest DAX reactions. The 161.8% Fibonacci extension from the 2020-2021 bull market projects a target near 26,318. When a Fibonacci level coincides with a horizontal support zone, the confluence creates an exceptionally high-probability entry.
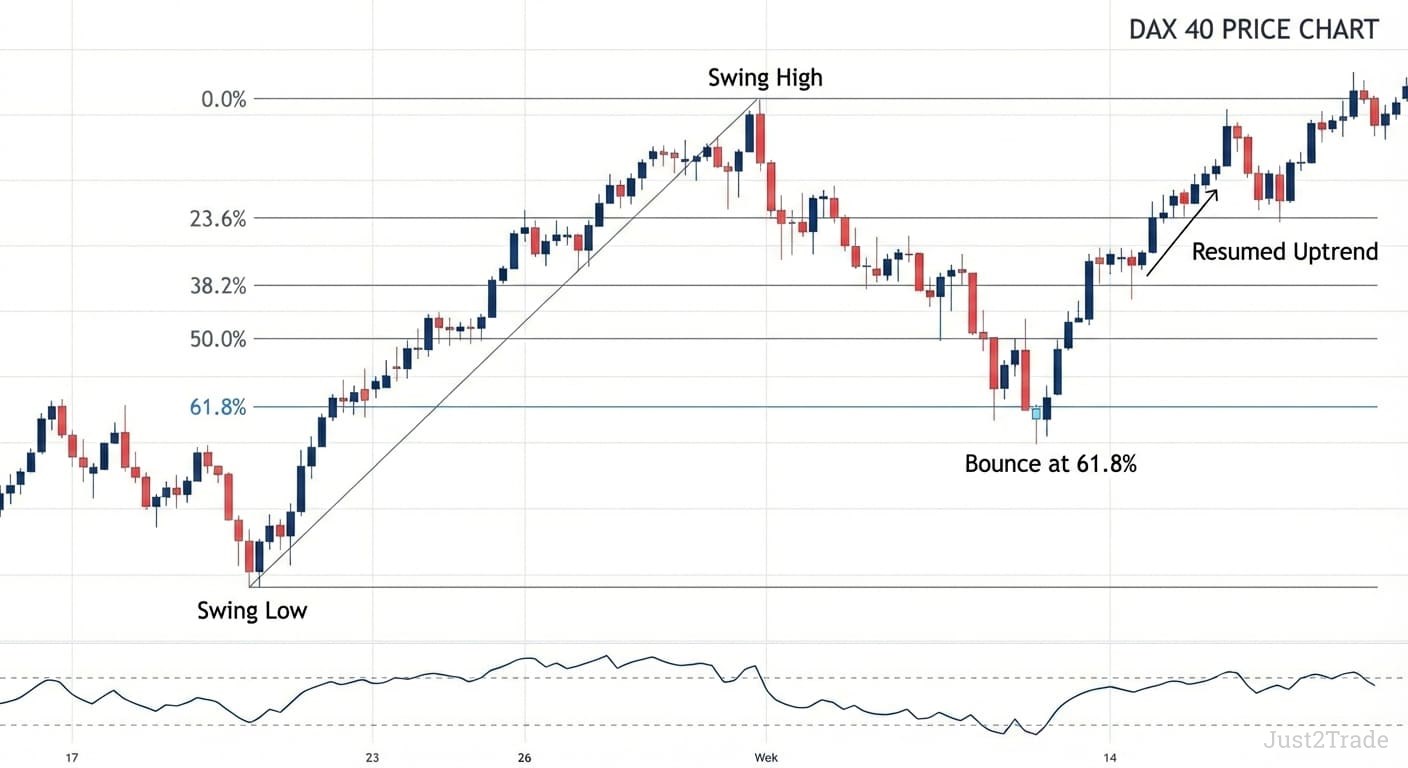)
Pure Price Action Trading
Some professional traders strip their DAX charts entirely of indicators, relying solely on price structure, support/resistance reactions, and candlestick formations. This minimalist approach eliminates indicator lag and forces direct reading of market structure. On DAX's liquid charts, rejection wicks at resistance, engulfing candlestick patterns sharpening entry precision at support, and inside-bar breakouts produce clean setups.
)
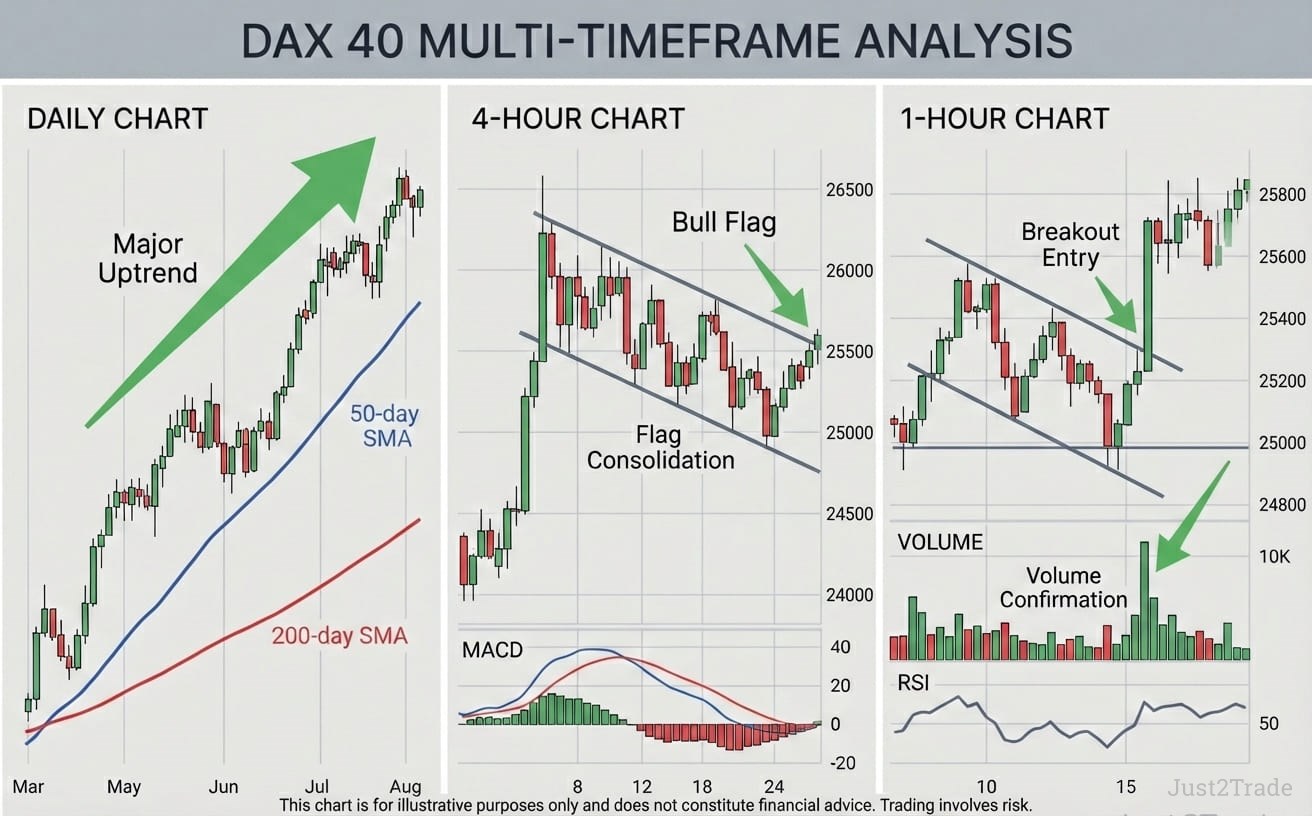
Multiple Timeframe Analysis
Professional DAX traders rarely analyse a single timeframe in isolation:
- Daily chart – identify the dominant trend direction
- 4-hour chart – find pattern formations and structural levels
- 1-hour chart – time your precise entry
When all three align – daily uptrend, 4-hour bull flag, 1-hour breakout – the probability of success increases dramatically. This timeframe confluence is perhaps the single most important skill for consistent profitability.
)
Risk Management and Position Sizing for DAX Trading
You can master every indicator in this article, but without proper risk management, one bad trade erases weeks of gains. This is doubly true when trading DAX via Contracts for Difference (CFDs), where leverage up to 1:20 applies for EU retail traders on major indices. CFDs offer distinct advantages – you can trade both directions (long and short), use fractional position sizes, and avoid stamp duty – but leverage amplifies losses equally. DAX futures technical analysis follows the same principles; the FDAX contract traded on Eurex is the institutional benchmark for German equity index derivatives.
Position Sizing Calculations
The formula is straightforward:
Position Size = (Account Balance × Risk %) / Stop Distance in Points
| Account Size |
Risk % |
Stop Distance |
Position Size (lots) |
| €10,000 |
1% |
50 points |
2.0 |
| €10,000 |
1% |
100 points |
1.0 |
| €25,000 |
1% |
50 points |
5.0 |
| €25,000 |
2% |
100 points |
5.0 |
Never risk more than 1-2% per trade. This single rule ensures no individual loss threatens your account.
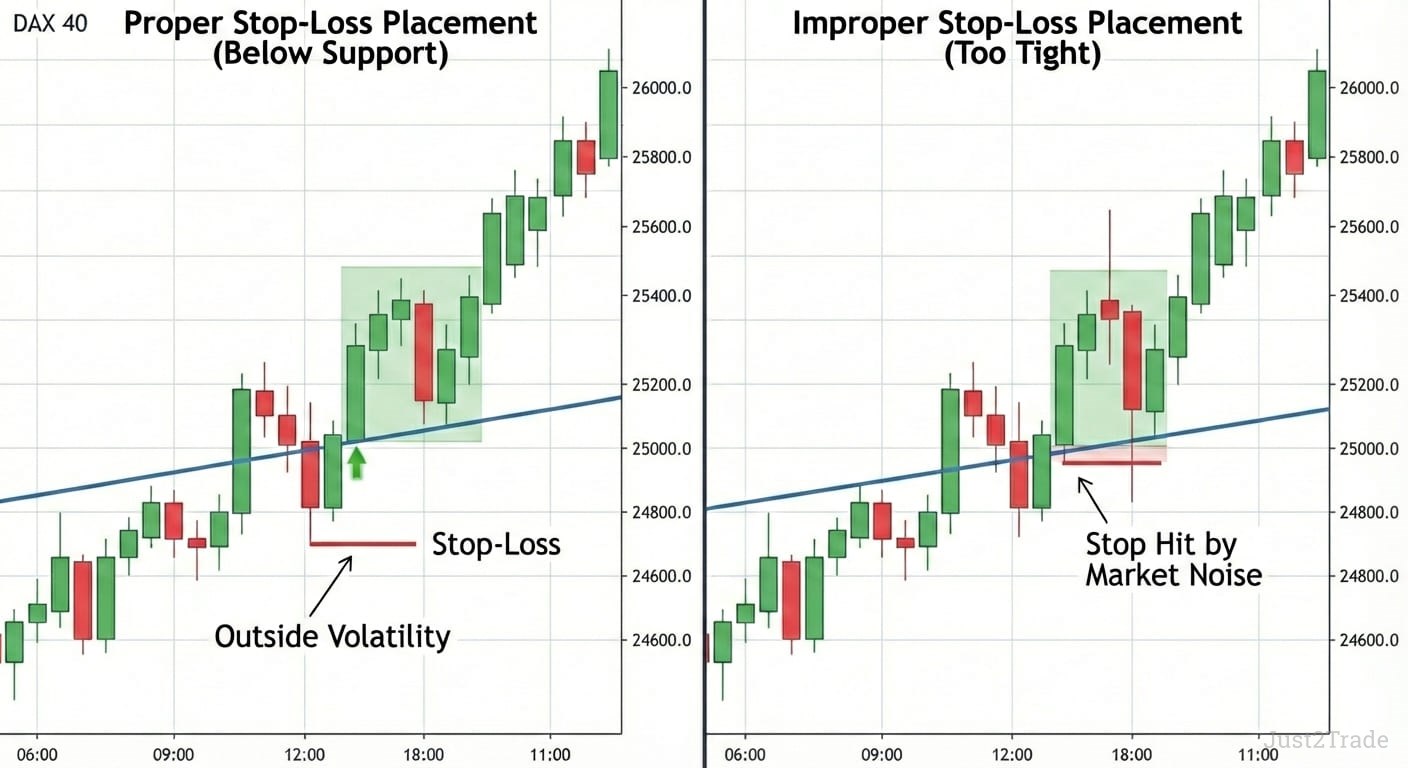
Stop Loss Placement and Management
Technical analysis should determine your stop location. Place stops beyond the relevant support or resistance level – beyond the pattern boundary, beyond the recent swing low, or use a volatility-based approach: 1.5× the Average True Range (ATR) on the 14-period setting provides a data-driven stop distance that adapts to current DAX conditions. The DAX typically fluctuates within a daily range of 150-300 points, so stops tighter than 30-40 points get caught by normal noise.
Three stop management approaches: initial fixed stop (set and forget), breakeven stop (move to entry after 1:1 move in your favour), and trailing stop (follow the 20 EMA or a fixed ATR multiple below price).
)
Common Mistakes and How to Avoid Them
Overtrading and Forced Setups
The DAX delivers plenty of opportunities during the European session – you don't need to force setups during quiet pre-market hours. Limit yourself to 2-3 high-quality trades per session. Create a checklist: does the setup align with the higher timeframe trend? Does it occur at a significant level? Is there volume confirmation? If any answer is "no," wait.
Ignoring Proper Risk Management
Technically skilled traders blow accounts because they size positions on conviction rather than calculation. Emotional control is non-negotiable – fear and greed override even the best strategy when discipline falters. Adopt a "risk-first" framework: before analysing the chart, decide your maximum risk per trade. Then let the technical setup and stop distance determine position size. This applies especially when trading leveraged CFD products on the DAX, where a single overleveraged loss can be catastrophic.
)
Conclusion: Integrating Technical Analysis for DAX Success
The DAX 40 is an outstanding vehicle for technical trading. Its concentrated liquidity on Xetra, institutional respect for key levels, and clear trending behaviour during the European session make it one of the most technically responsive indices in the world.
Summary: Your DAX Technical Analysis Roadmap
- Master core indicators – MACD, RSI, and moving averages with DAX-optimised settings
- Recognise chart patterns and confirm them with volume analysis
- Draw and respect trend lines across multiple timeframes
- Combine tools for confluence rather than relying on any single signal
- Manage risk religiously – 1-2% maximum per trade, always
- Practise on a demo account, backtest strategies on historical data, then scale gradually
Start by practising these concepts risk-free. Backtest the three strategies outlined above on historical DAX data. Gradually transition to live trading with small position sizes. The market isn't going anywhere – but your skills will compound with every session.
This article is for informational purposes only and does not constitute financial or investment advice. Trading DAX 40 via CFDs and futures involves significant risk. Always consult a certified professional before making financial decisions.
FAQ
-
-
What is technical analysis and why does it work for DAX 40?
Technical analysis evaluates price and volume data to forecast future movements. It works particularly well for DAX 40 because the index's high liquidity on Xetra – averaging €7.86 billion daily in January 2026 – produces clean patterns that respond predictably to established technical methods during concentrated European trading hours.
-
Which technical indicators are most effective for DAX trading?
MACD with optimised settings (8-17-9 intraday), RSI at 9-period for faster signals, and the 20 EMA / 50 SMA / 200 SMA trio form the core toolkit. These indicators identify trend direction, momentum shifts, and dynamic support/resistance levels specific to DAX volatility.
-
How do I identify high-probability support and resistance levels on DAX?
Focus on confluence zones where multiple sources align: horizontal swing highs/lows, psychological round numbers like 25,000, volume profile nodes, trend lines with three or more touches, and Fibonacci retracement levels. The more sources converging at one price, the stronger the level.
-
What are the most reliable chart patterns for DAX 40 trading?
Head and shoulders tops/bottoms are the most dependable reversal patterns, while bull flags and ascending triangles provide the strongest continuation signals. Always confirm with volume – valid DAX breakouts show volume at least 50% above average.
-
How do I set appropriate stop losses for DAX trades?
Place stops beyond the relevant support or resistance level, allowing 30-50 points of buffer for normal DAX volatility, or use 1.5× ATR for a volatility-adaptive approach. Let chart structure determine stop placement, then calculate position size accordingly.
-
How can I use MACD effectively for DAX trend identification?
Use 8-17-9 MACD for intraday DAX trading and standard 12-26-9 for swing trades. Enter on bullish crossovers when DAX is above the 50 SMA, and watch for divergences between price and MACD as early reversal warnings near known support and resistance.
-
How can I avoid overtrading and improve my DAX trading discipline?
Limit yourself to 2-3 trades per session and use a checklist: trend alignment, level significance, volume confirmation, and proper risk-reward. If all criteria aren't met, skip the trade. The DAX provides ample opportunities for patient traders – quality always beats quantity.