Pola Bendera - Apa Itu dan Cara Kerjanya
Pola Bendera Daftar Isi: APA ITU POLA BENDERA? BAGAIMANA POLA BENDERA BEKERJA JENIS-JENIS BENDERA YANG PERLU DIPERHATIKAN APA YANG TERJADI S...
02.10.2025 04.00
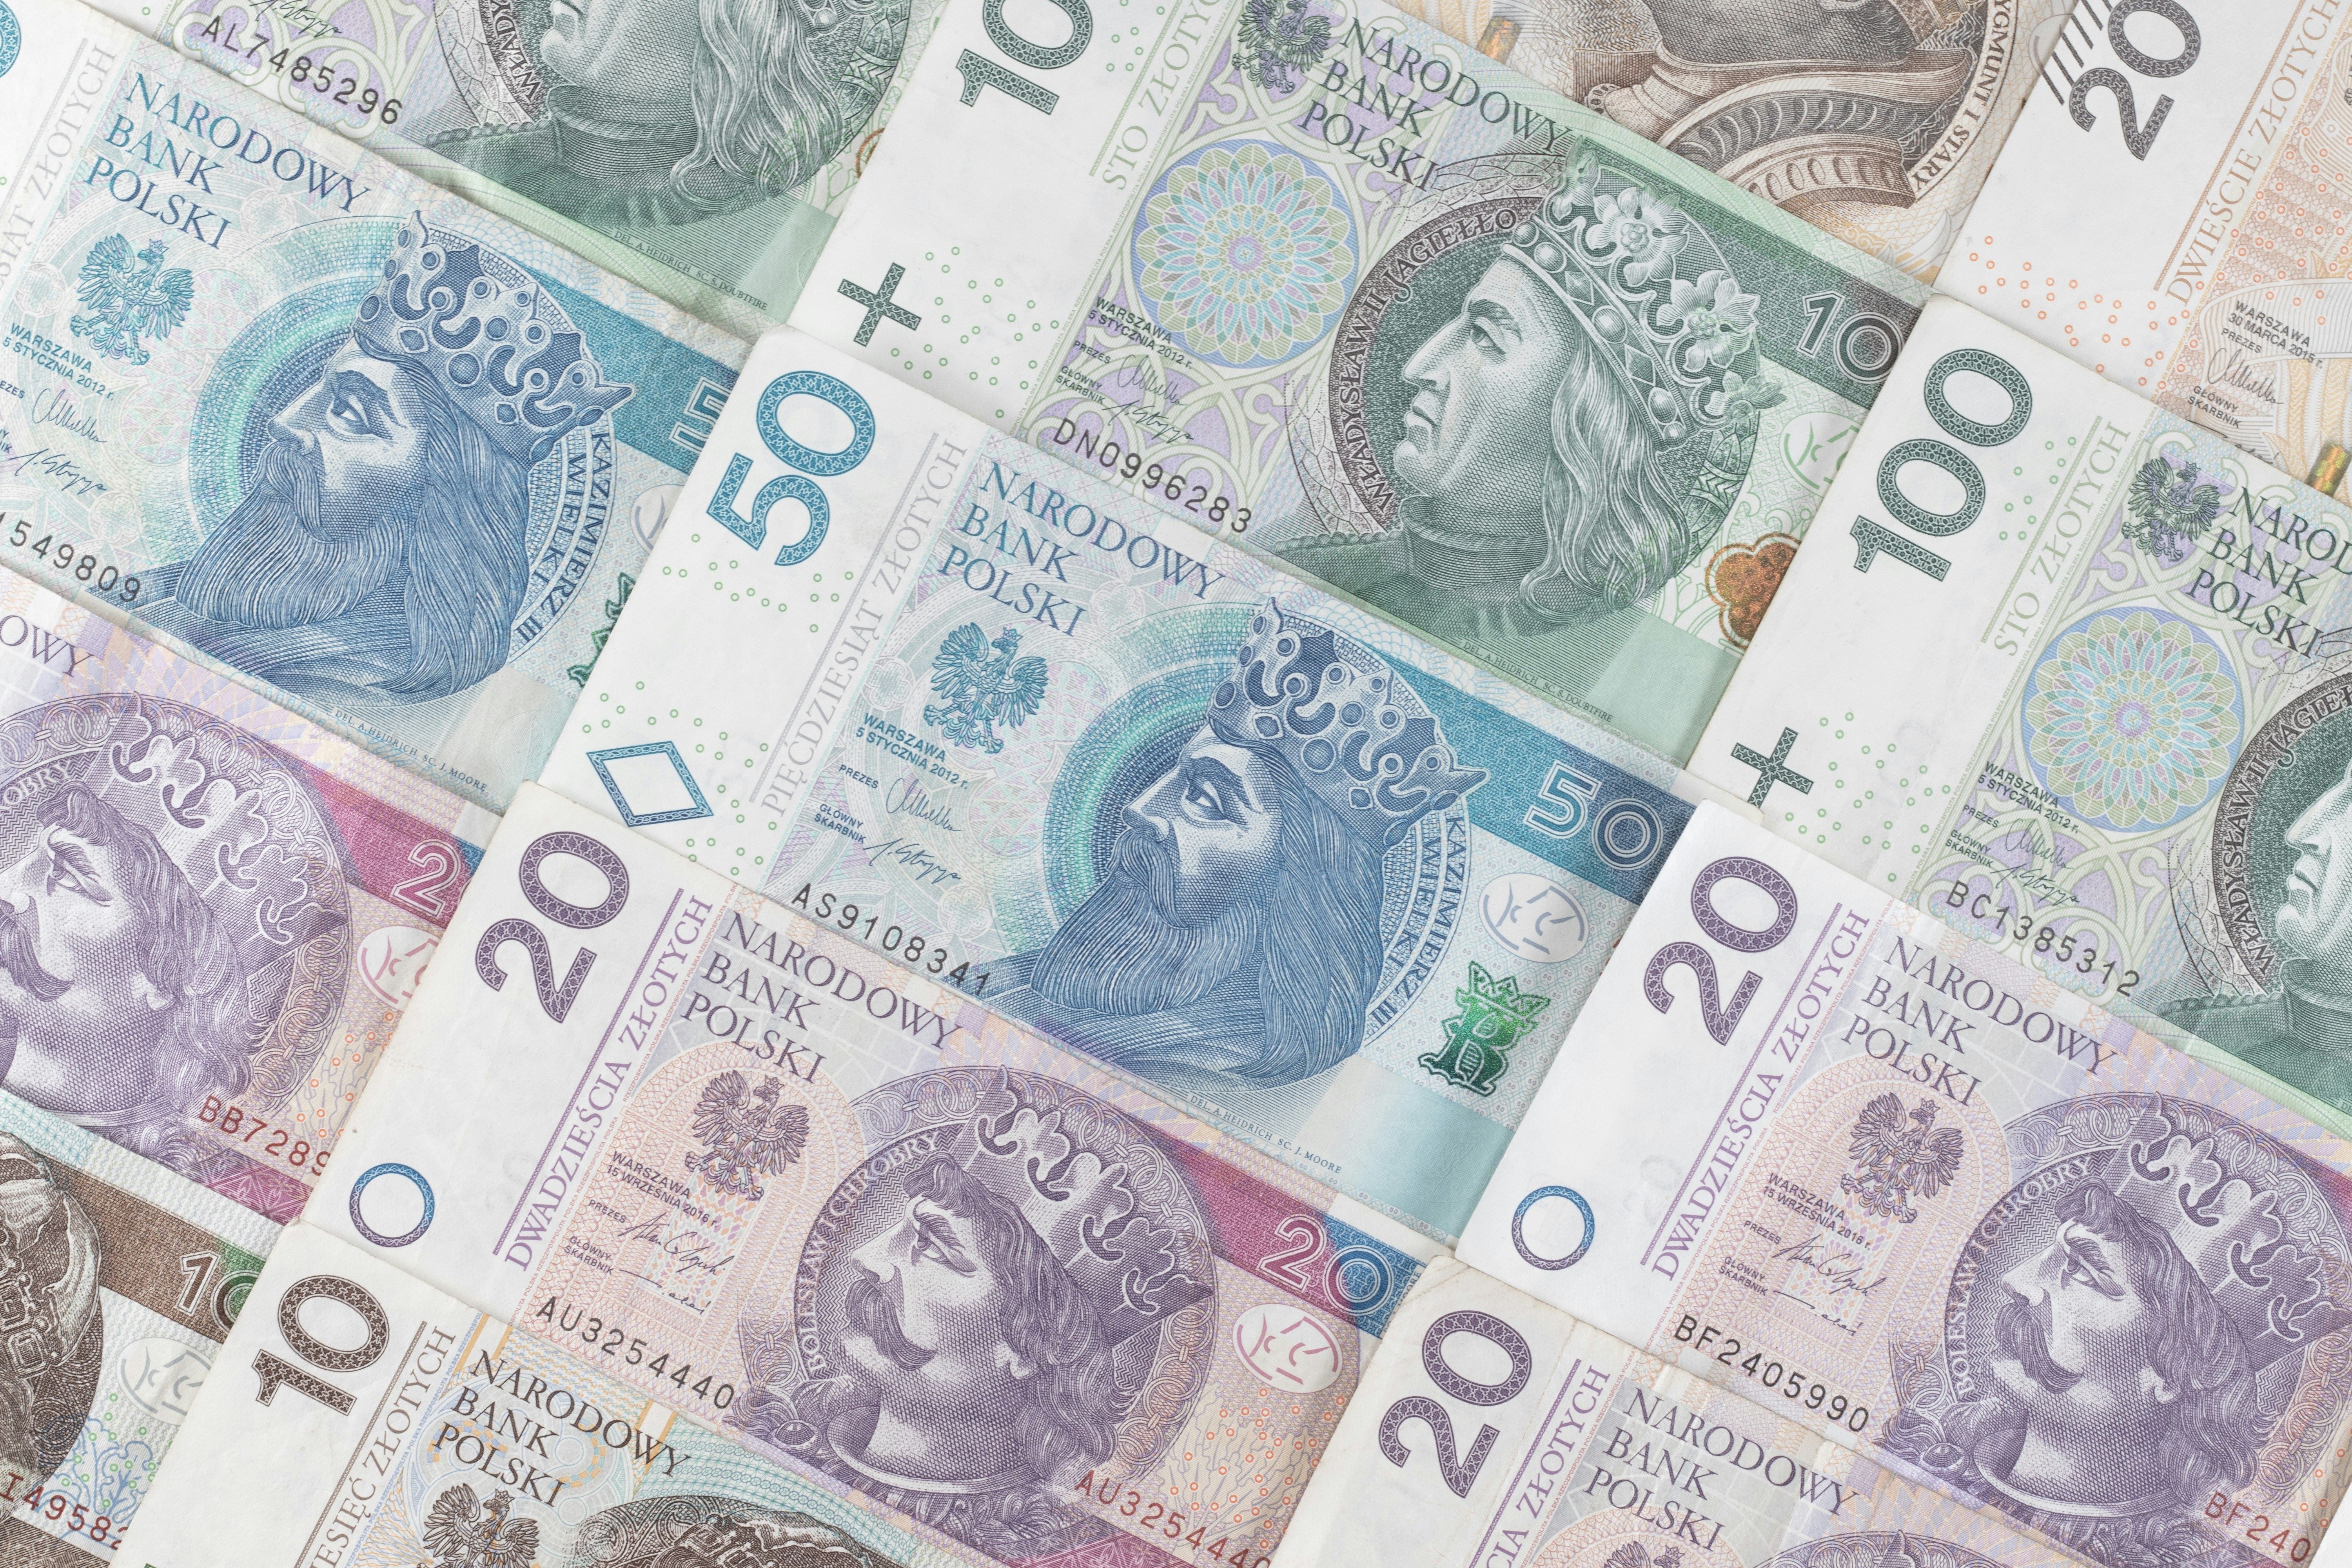
DKK ke PLN: Prakiraan dan Prediksi Krone Denmark ke Zloty untuk Tahun 2025 dan Selanjutnya
Ramalan DKK ke PLN: Ramalan Kadar Pertukaran Mata Uang Krone Denmark ke Zloty Polandia Ramalan nilai tukar Krone Denmark kini semakin mendapat...
11.09.2025 03.36
Prakiraan Euro ke Zloty untuk tahun 2025, 2026, 2027, 2028 - 2030: Prediksi EUR ke PLN
Prediksi Euro terhadap Zloty untuk Tahun 2025 – 2028 Tetap mengikuti dinamika pasar valuta asing yang fluktuatif sangat penting bagi para peda...
27.05.2025 03.07
Prakiraan USD ke JPY untuk tahun 2025, 2026, 2027, 2028–2030: Prediksi Harga Dolar ke Yen
Perkiraan USD/JPY untuk Tahun 2025 dan Seterusnya Daftar Isi Poin Penting Ringkasan Perkiraan Nilai Tukar USD/JPY Analisis Teknikal USD/J...
22.05.2025 19.03
Prediksi Harga Perak 2025, Grafik Harga 10 & 20 tahun
Prediksi Harga Perak Daftar Isi APA YANG MENENTUKAN HARGA PERAK? Peramalan Harga Perak 2025 Peramalan Harga Perak 2026 Peramalan Harga Perak...
22.05.2025 01.33
Prediksi Harga Emas 2025 - 2026 - Prakiraan untuk 5, 10 & 20 tahun
Prediksi Harga Emas Salah satu aset paling berharga dan tempat penyimpanan yang aman. Berabad-abad berlalu, tetapi nilainya terus tumbuh karena ...
26.03.2025 16.38
Prakiraan Dolar ke Zloty untuk tahun 2025, 2026, 2027, 2028 - 2030: Prediksi USD ke PLN
Prakiraan Dolar terhadap Zloty 2025 - 2030 Memahami dinamika pasar forex sangat penting bagi investor pemula maupun berpengalaman. Hal ini mem...
08.11.2024 03.53
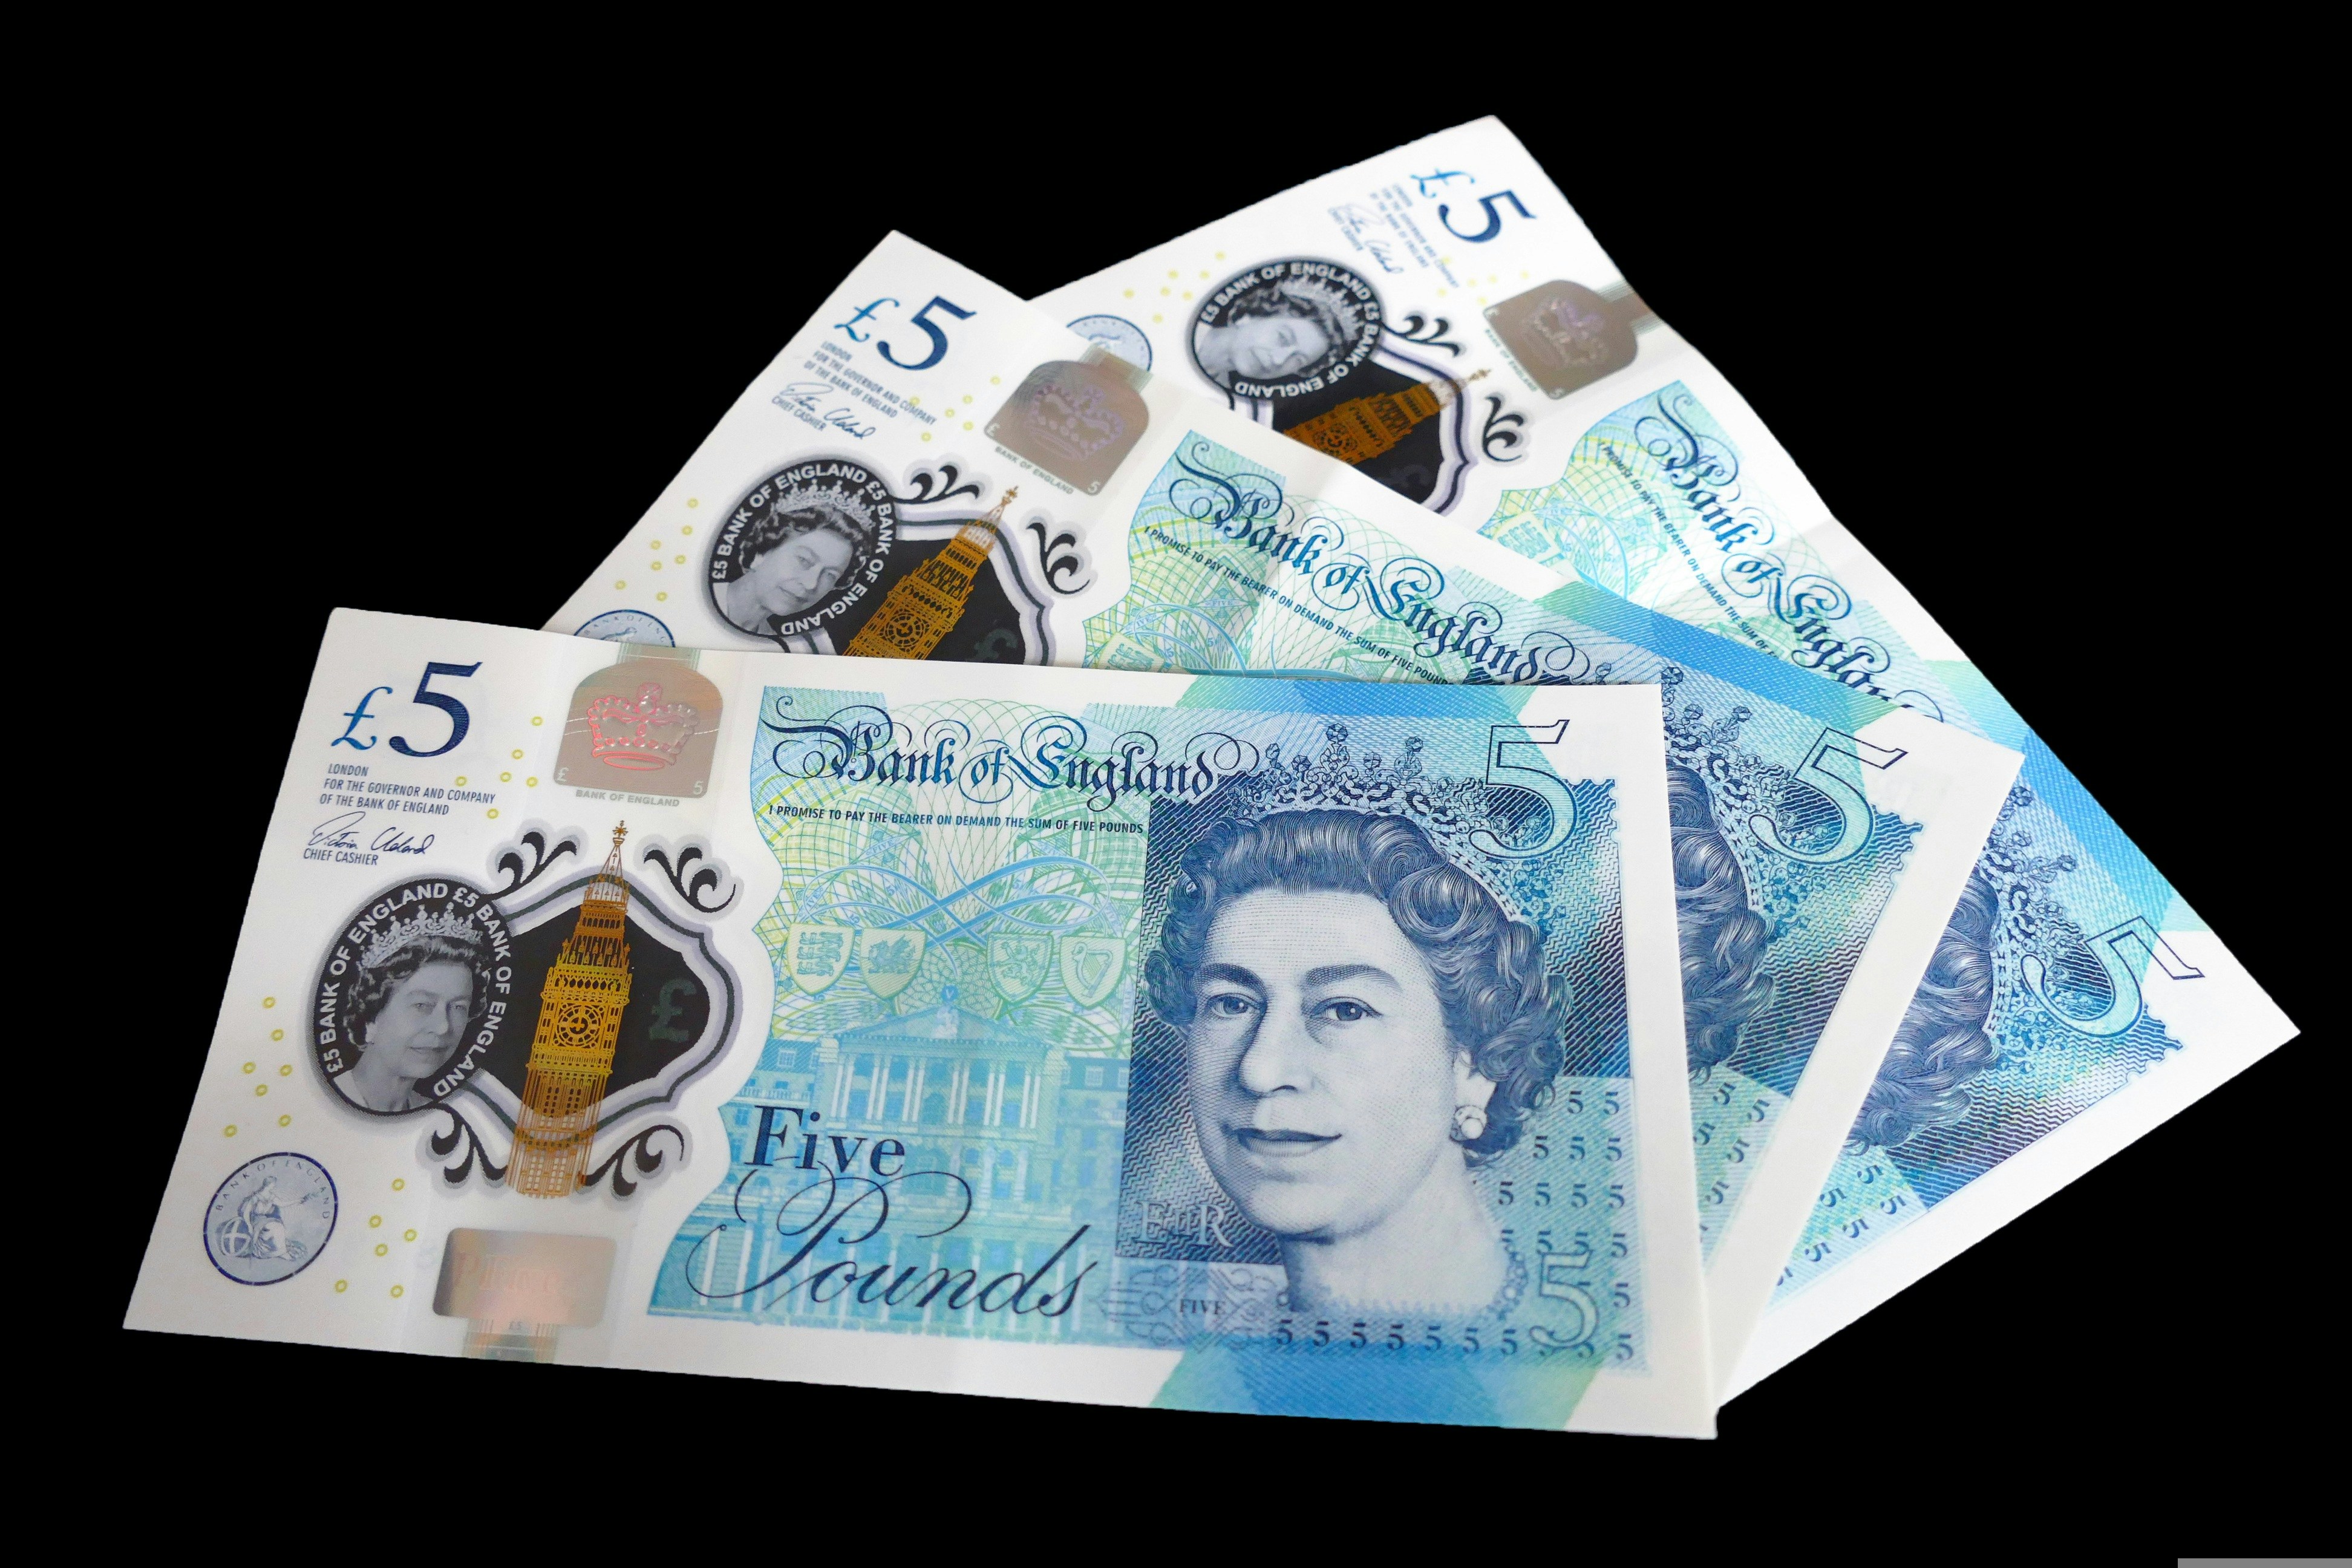
Prakiraan dan Prediksi GBP (Poundsterling Inggris) untuk Tahun 2025 dan Selanjutnya
Proyeksi GBP untuk Tahun 2025 dan Seterusnya Memahami peran pound sterling Inggris sangat penting ketika kita menelusuri proyeksi GBP untuk ta...
22.10.2024 06.20
Harga Rata-Rata Tertimbang Volume (VWAP) - Arti dan Perhitungan
VWAP Daftar Isi: POIN PENTING APA ITU VWAP? PENTINGNYA HARGA RATA-RATA TERTIMBANG VOLUME CARA MENGHITUNG VWAP CARA MENGGUNAKAN HARGA RATA-R...
26.08.2024 17.36
Derivatif - Definisi, Jenis, Pro dan Kontra
Derivatif - Apa Itu? Para pedagang belakangan ini semakin tertarik dengan konsep derivatif. Instrumen keuangan ini dianggap sebagai alat yang ...
24.07.2024 15.12
Prakiraan dan Prediksi Harga Gas Alam untuk Tahun 2025, 2030 dan Selanjutnya
Ramalan dan Prediksi Harga Gas Alam untuk 2025, 2030, dan Masa Depan Ramalan Gas Alam Daftar Isi: Ringkasan Ramalan dan Prediksi Harga Gas Ala...
09.04.2024 00.21
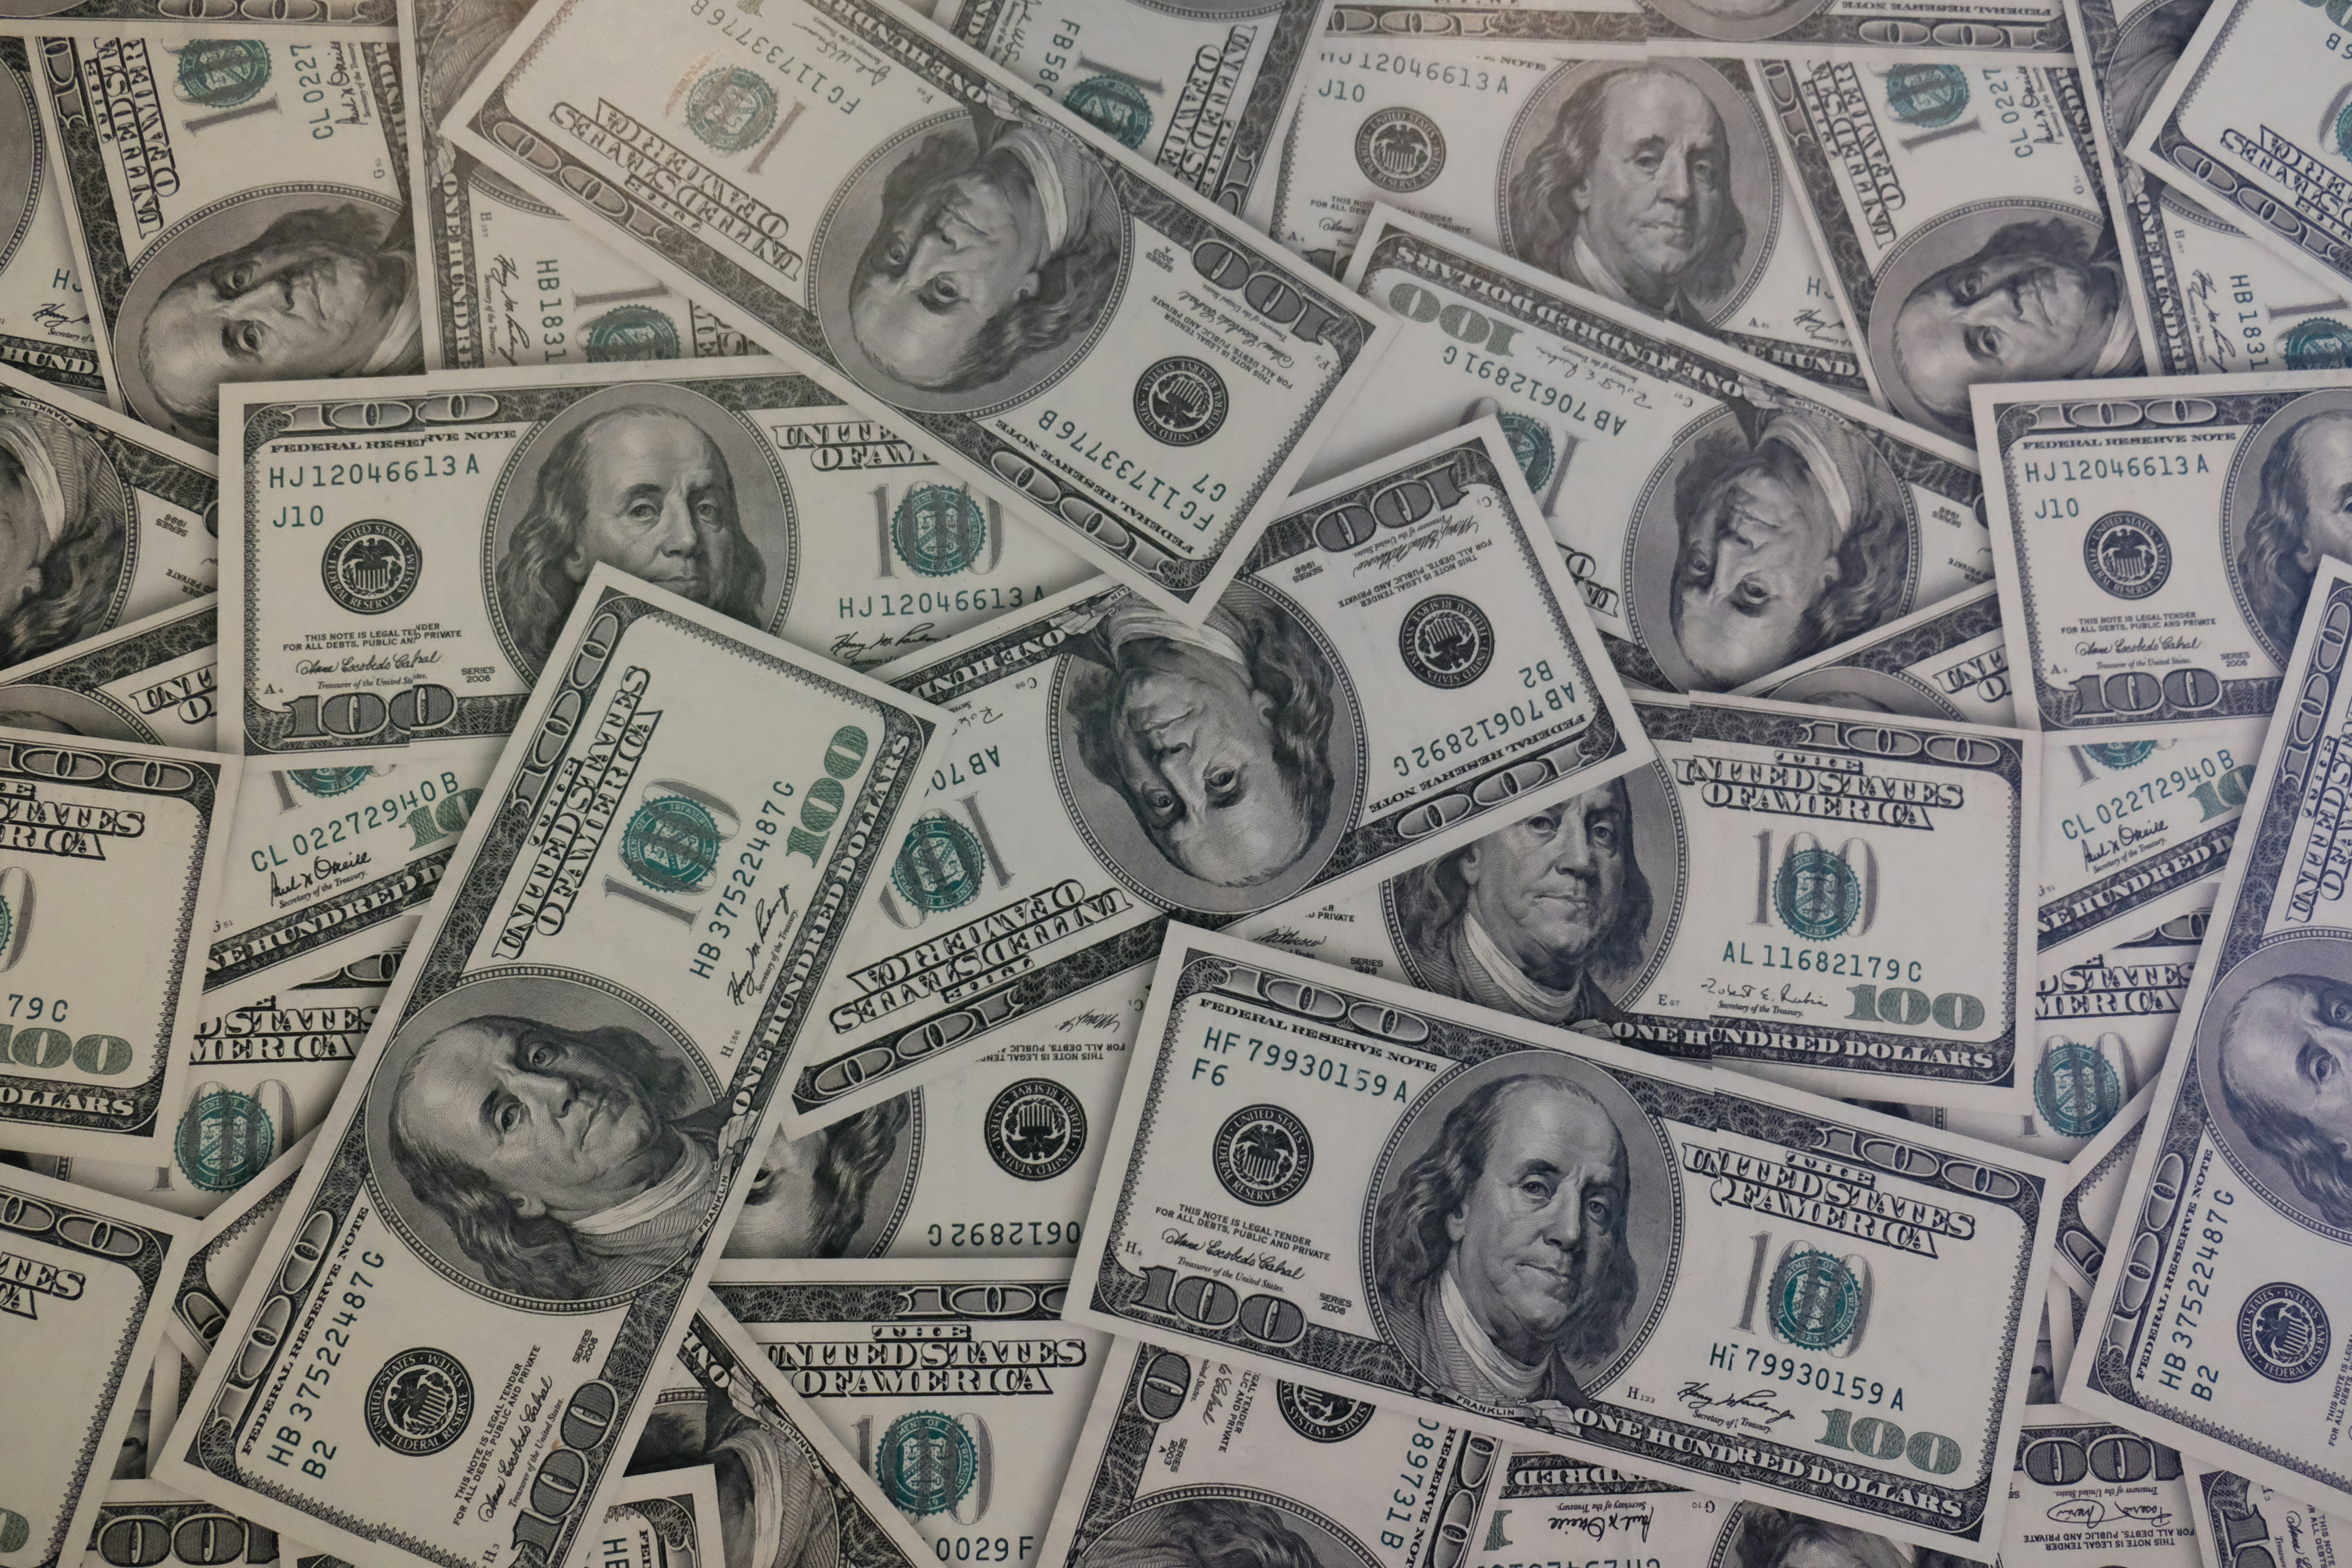
73 / 5.000 Prakiraan dan Prediksi USD (Dolar AS) untuk Tahun 2025 dan Selanjutnya
Prediksi USD untuk Tahun 2025 dan Seterusnya Dolar Amerika Serikat (USD) tetap menjadi salah satu mata uang yang paling banyak digunakan dan d...
10.03.2024 00.35
Cara membeli saham SpaceX pada tahun 2025
Cara Membeli Saham SpaceX pada Tahun 2025 Pada tahun 2023, banyak orang berminat untuk berinvestasi di bidang antariksa dengan membeli saham S...
10.01.2024 22.06
)
EBIT vs. EBITDA: Definisi, Rumus & Cara Menghitung
EBIT vs. EBITDA EBITDA dan EBIT, yang merupakan singkatan dari *earnings before interest, taxes, depreciation, and amortization* (pendapatan s...
14.08.2023 16.19
Apa itu Indikator MACD dalam Perdagangan Saham & Cara Membacanya
Apa itu MACD: Cara Membaca dan Menggunakannya Strategi mengikuti tren yang sukses membutuhkan lebih dari sekadar mengamati pergerakan harga; s...
08.08.2023 18.13
What Is Financial Liquidity: Definition, Formula & Example
Apa itu Likuiditas Keuangan? Dalam bidang keuangan, likuiditas adalah istilah yang sering Anda temui. Likuiditas pada dasarnya adalah ukuran e...
08.08.2023 01.04
Apa itu Saham dan Obligasi: Perbedaan dan Perbandingannya
Saham vs. Obligasi Meraih kemakmuran finansial merupakan aspirasi umum. Setiap orang ingin meningkatkan kehidupan mereka sendiri dan kehidupan...
26.07.2023 10.22
Tempat dan Cara Membeli Obligasi Pemerintah dari Polandia dan Amerika Serikat
Bagaimana Cara Membeli Obligasi Negara? Dasar pendidikan investor Anda haruslah mempelajari cara membeli obligasi. Portofolio yang terdiversif...
24.07.2023 03.22
Arti dan Jenis Lilin Doji: Capung, Batu Nisan, Bintang, dll.
Pola Lilin Doji Apa itu Pola Doji? Ketika trader menganalisis pasar, mereka mengandalkan pola yang terbentuk pada grafik harga, dan lilin doj...
18.07.2023 14.08