Harmoniniai modeliai

Turinys:
PAGRINDINĖS IŠVADOS
KAS YRA HARMONINIAI MODELIAI?
PROBLEMOS, SUSIJUSIOS SU HARMONIKA
HARMONINIŲ MODELIŲ TIPAI
KODĖL HARMONINIAI MODELIAI TOKIE POPULIARŪS FOREX PREKYBOJE?
KAIP PRADĖTI PREKIAUTI SU HARMONINIAIS MODELIAIS
IŠVADA
DUK
Harmoniniai modeliai yra įdomus techninės analizės aspektas Forex prekyboje, siūlantis prekiautojams unikalų būdą nustatyti galimus rinkos apsisukimus naudojant geometrines kainų formacijas. Naudodami Fibonačio koeficientus, šie modeliai padeda prekiautojams tiksliau prognozuoti būsimus kainų pokyčius. Nuo populiaraus drugelio harmoninio modelio iki sudėtingo šikšnosparnio harmoninio modelio - harmoninė prekyba siūlo įvairiapusį priemonių rinkinį rinkos tendencijoms pastebėti.
Šiame straipsnyje mes ištirsime harmoninių modelių privalumus, aptarsime bulių ir meškų harmoninių modelių skirtumus ir pateiksime įžvalgų apie tai, kaip dauguma harmoninių modelių prekiautojų naudoja šiuos modelius. Nesvarbu, ar esate pradedantysis, ar patyręs prekiautojas, šių populiarių harmoninių modelių supratimas gali pagerinti jūsų prekybos strategiją ir rinkos analizę.
PAGRINDINĖS IŠVADOS
- Harmoniniai modeliai naudoja Fibonačio koeficientus, kad pateiktų tikslius ir patikimus prekybos signalus, padedančius prekiautojams atlikti geresnes rinkos prognozes.
- Dažniausiai pasitaikantys modeliai yra šikšnosparnis, krabas, ryklys, ABCD formacija ir kiti.
- Nors ir galingi, harmoniniai modeliai reikalauja kruopštaus atpažinimo ir rizikos valdymo, kad būtų galima efektyviai valdyti rinkos svyravimus.
KAS YRA HARMONINIAI MODELIAI?
Harmoniniai modeliai yra sudėtingi grafikų dariniai, naudojami techninėje analizėje prognozuojant kainų pokyčius akcijų ir Forex rinkose. Šios figūros yra pagrįstos Fibonačio lygiais, kurie grafike signalizuoja apie galimą tendencijos pasikeitimą arba tęsinį. Egzistuoja daugybė harmoninių modelių, kurių kiekvienas pasižymi unikaliomis taisyklėmis ir proporcijomis. Dažnai sutinkami tokie pavyzdžiai kaip Gartlio, Šikšnosparnio, Drugelio ir Krabo figūros.
Tie, kurie žino, kaip parengti harmoninių modelių gali tiksliai nustatyti įėjimo ir išėjimo taškus su minimalia rizika, todėl gali būti pelninga prekyba harmoninių modelių. Nagrinėdami tikslius kainų pokyčius, sukuriančius šiuos modelius, prekiautojai gali veiksmingiau nei kitais metodais numatyti rinkos elgseną. Vis dėlto svarbu atsižvelgti į tai, kad nors harmoniniai modeliai yra veiksmingi įvairiose situacijose, jie nėra visiškai patikimi. Sėkmingai prekybai šiais modeliais būtinas nuolatinis mokymasis ir praktika.
Kas yra Fibonačio seka?
Fibonačio seka - tai skaičių seka, kurioje kiekvienas skaičius yra dviejų ankstesnių skaičių suma, pradedant skaičiais 0 ir 1. Ši seka sukuria "aukso pjūvį" - unikalų skaičių santykį, dažnai pasitaikantį gamtoje, mene, architektūroje ir finansų rinkose. Prekyboje Fibonačio santykiai yra labai svarbūs nustatant galimus palaikymo ir pasipriešinimo lygius, kurie yra labai svarbūs prognozuojant rinkos pokyčius.
Suprasdami ir taikydami Fibonačio sekos principus, prekiautojai gali pagerinti savo prognozių tikslumą ir padidinti prekybos harmoniniais modeliais pelningumą.
PROBLEMOS, SUSIJUSIOS SU HARMONIKA
Nors harmoninių modelių privalumai nusveria jų iššūkius, prekiautojai turėtų žinoti apie pirmuosius. Viena iš pagrindinių problemų - tikslus suderinimas, kurio reikalauja Fibonačio koeficientai. Pavyzdžiui, tokios figūros kaip bulių Gartley ar kitos sudėtingos figūros, siekiant nustatyti galimus kainų pokyčius, labai priklauso nuo tikslių Fibonačio atstatymo lygių, pavyzdžiui, 61,8 % ar 78,6 %. Bet koks nukrypimas nuo šių tikslių matavimų gali lemti netikslias prognozes.
Dar vienas iššūkis - teisingai nustatyti skirtingas modelio dalis, pavyzdžiui, AB ar BC dalį. Neteisingai nustačius šias kojas, galima neteisingai įvertinti palaikymo ir pasipriešinimo lygius, kurie yra labai svarbūs nustatant pelno ir nuostolio tikslus. Tai taip pat gali turėti įtakos sprendimui užimti ilgąją arba trumpąją poziciją rinkoje. Pavyzdžiui, esant meškų modeliui, neteisingai nustatytas D taškas gali klaidingai rodyti tendencijos apsisukimą, todėl prekiautojai gali įeiti į neteisingos krypties poziciją.
Be to, dėl sudėtingos finansų rinkų struktūros gali atsirasti skirtingo laiko ir dydžio dėsningumų. Dėl to gali kilti sunkumų, kai reikia atskirti nedidelį atsitraukimą nuo tęstinės formacijos ar didelio tendencijos pasikeitimo. Todėl prekiautojai gali supainioti trumpą tendencijos apsisukimą su pagrindinės tendencijos tęsiniu ir dėl to patirti potencialių finansinių nuostolių.
Taip pat labai svarbu turėti tikslią diagramų sudarymo platformą, kuri gali efektyviai braižyti Fibonačio tinklelius ir sekas. Neturint tinkamų priemonių, prekiautojams gali būti sunku tiksliai nubrėžti šias geometrines figūras, o tai dar labiau apsunkina modelių analizę.
HARMONINIŲ MODELIŲ TIPAI
Yra daug skirtingų harmoninių modelių. Kiekvienas iš šių modelių gali signalizuoti apie teigiamas arba neigiamas rinkos tendencijas. Panagrinėkime labiausiai paplitusius iš jų.
Gartley
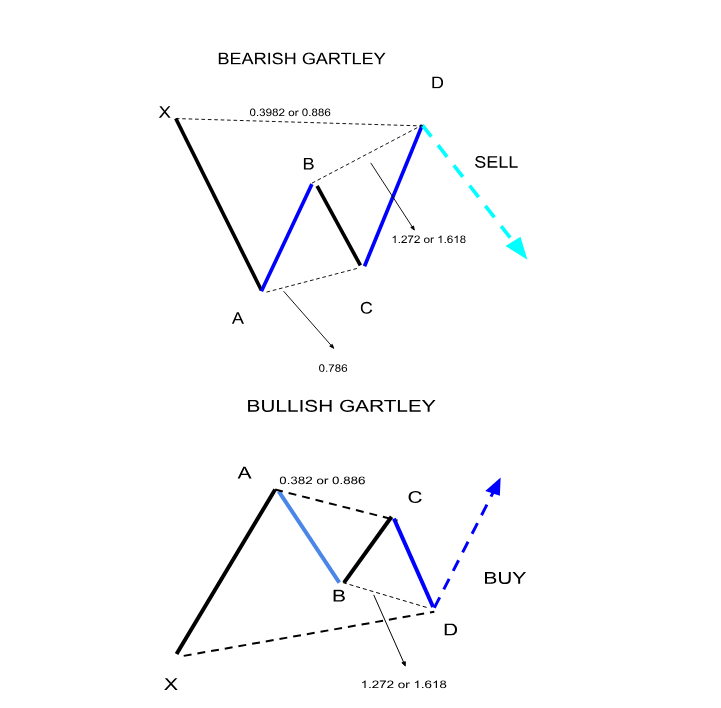
H. M. Gartlio modelis, kurį 1930 m. įvedė H. M. Gartlis, yra svarbus harmoninis diagramos modelis techninėje analizėje. Jis naudojamas galimiems rinkos tendencijų posūkiams nustatyti. Modelis sudarytas remiantis Fibonačio atstatymo lygiais, taip sukuriant vizualinę seką, kurią prekiautojai gali atpažinti. Bulių Gartley figūra primena "M" formą, o tai reiškia, kad pirkimo galimybė yra paskutiniame taške D. Priešingai, meškų Gartley figūra atrodo kaip "W", o tai reiškia, kad pardavimo galimybė yra taške D. Figūrą sudaro penki pagrindiniai taškai: Segmentas AB paprastai atsitraukia 61,8 % XA, BC - 38,2-88,6 % AB, o CD - 78,6 % XA. Suprasdami šiuos atsitraukimo lygius, prekiautojai gali numatyti rinkos apsisukimus ir strategiškai planuoti savo sandorius.
Drugelis
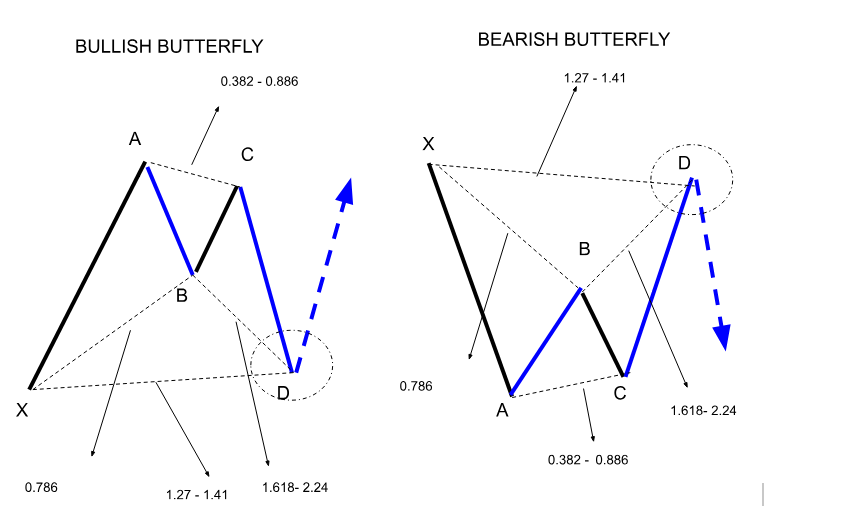
Drugelio modelis yra žymus harmoninis modelis techninėje analizėje, naudojamas prognozuoti galimus rinkos tendencijų apsisukimus. Jį sudaro penki kritiniai taškai (X, A, B, C, D) ir keturios atšakos, kurių kiekviena atitinka tam tikrus Fibonačio atstatymo ir pratęsimo lygius.
Modelis prasideda nuo XA kojos, po kurios seka atsitraukimas iki taško B, paprastai 78,6 % XA judėjimo. Kitas etapas, BC, atsitraukia nuo 38,2 % iki 88,6 % AB. Galiausiai CD tęsiasi nuo 1,618 % iki 2,618 % AB, o tai veda į tašką D. Šis taškas žymi galimą apsisukimo zoną. Šioje zonoje prekiautojai, remdamiesi modelio susiformavimu, nusprendžia pirkti esant bulių scenarijui arba parduoti esant meškų scenarijui.
Drugelio modelis yra vertingas dėl savo gebėjimo išryškinti svarbius posūkio taškus, suteikiant prekiautojams palankias rizikos ir atlygio galimybes, numatant vyraujančių tendencijų pabaigą. Supratus ir nustačius šį modelį, galima patobulinti prekiautojo strategiją, nes bus aiškesni įėjimo ir išėjimo taškai.
Šikšnosparnis
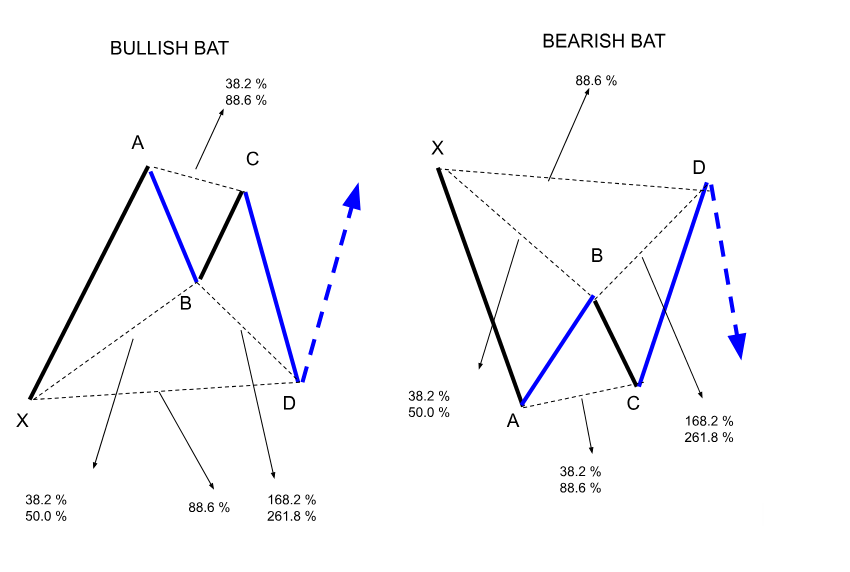
Šikšnosparnio modelis yra harmoningas prekybos modelis, naudojamas nustatyti potencialias prekybos galimybes, kai tendencija trumpam apsisuka prieš tęsdama savo pradinę kryptį. Jį sudaro penki taškai (X, A, B, C, D) ir jis atitinka tam tikrus Fibonačio koeficientus. Šiame modelyje AB atkarpa atsitraukia nuo 38,2 % iki 50 % XA atkarpos, o BC atkartoja nuo 38,2 % iki 88,6 % AB atkarpos. Galutinė CD koja tęsiasi nuo 1,618 % iki 2,618 % AB. Šis modelis išsiskiria tuo, kad gali pasiūlyti įėjimo taškus palankiomis kainomis ilgoms pozicijoms, kai susiformuoja bulių tendencijos, arba trumpoms pozicijoms, kai susiformuoja meškų tendencijos. Šikšnosparnio modelis grafike primena šikšnosparnio sparnus ir suteikia vertingų įžvalgų prekybos strategijoms.
Krabas
Krabas modelis, sukūrė Scott Carney, garsėja savo gebėjimu prognozuoti rinkos apsisukimus. Ši formacija išsiskiria tuo, kad Fibonačio pratęsimas naudojamas potencialiai apsisukimo zonai (PRZ), kurioje numatomas kainų pokytis, nustatyti. Krabo figūra gali būti arba bulių, arba meškų, tai lemia jos išsidėstymas.
Esant bulių "krabo" modeliui, tikimasi, kad rinka pakeis kryptį aukštyn, kai tik baigs formuotis. Savo ruožtu meškų krabo figūra rodo apsisukimą žemyn. Modelio raidą lemia tam tikri Fibonačio koeficientai, iš kurių svarbiausias yra 1,618 XA kojos pratęsimas, naudojamas PRZ nustatyti.
Ryklys
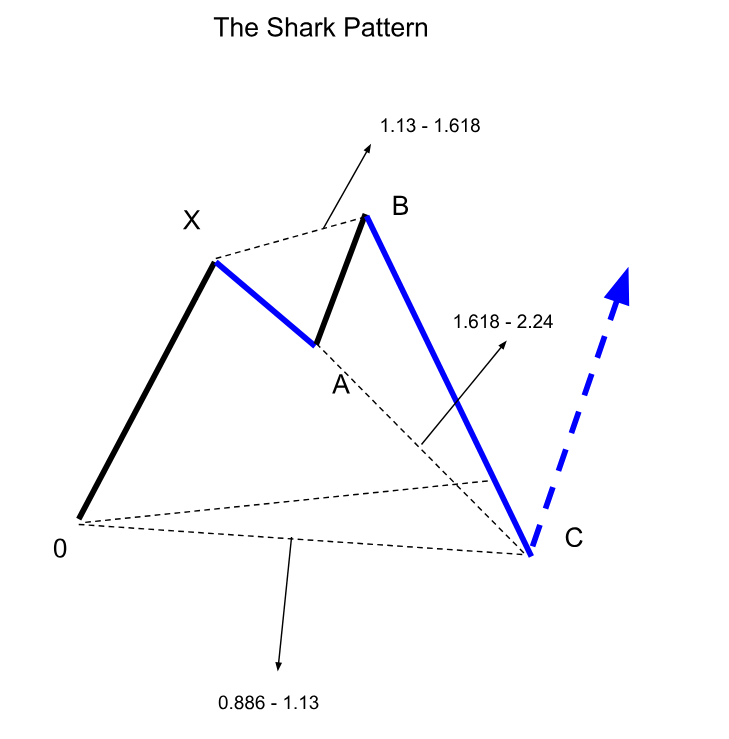
Ryklio raštas išsiskiria iš kitų harmoninių darinių dėl ypatingo žymėjimo būdo, kai naudojami taškai O, X, A, B ir C. Jis sudarytas iš sekos, prasidedančios tašku O, pereinančios į X, A, B ir galiausiai C, taip suformuojant unikalią struktūrą. Prekiautojai, norėdami atpažinti ryklio modelį, naudoja specialius Fibonačio koeficientus: OX turėtų svyruoti nuo 1,13 iki 1,618 XA, o BC - nuo 1,618 iki 2,24 OX. Kainos paprastai apsisuka C taške, kuris paprastai yra įėjimo į prekybą taškas.
Cipras
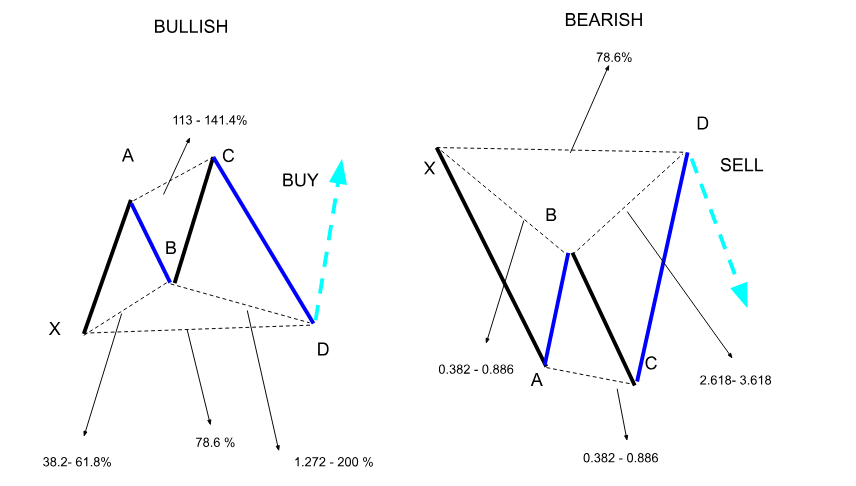
Cypher modelis susideda iš penkių pagrindinių taškų, pažymėtų X, A, B, C, ir D, sukurti unikalią formą, kuri padeda prekybininkams nustatyti galimus apsisukimus. Formacija pradedama nuo XA, tada grįžtama į tašką B, kuris turi būti tarp 38,2 % ir 61,8 % XA. Po to struktūra tęsiasi iki taško C, išsiplėsdama iki 113-141,4 % XA. Galiausiai ji paprastai baigiasi taške D, kuris paprastai būna ties 78,6 % XC atstatymo lygiu.
Šis kainų formavimas gali rodyti teigiamas ir neigiamas rinkos nuotaikas, taip užtikrinant prisitaikymą įvairiose rinkos aplinkose. Prekiautojai ieško įėjimo į prekybą D taške, kur dėl nepastovumo dažnai įvyksta dideli kainų pokyčiai.
ABCD modelis
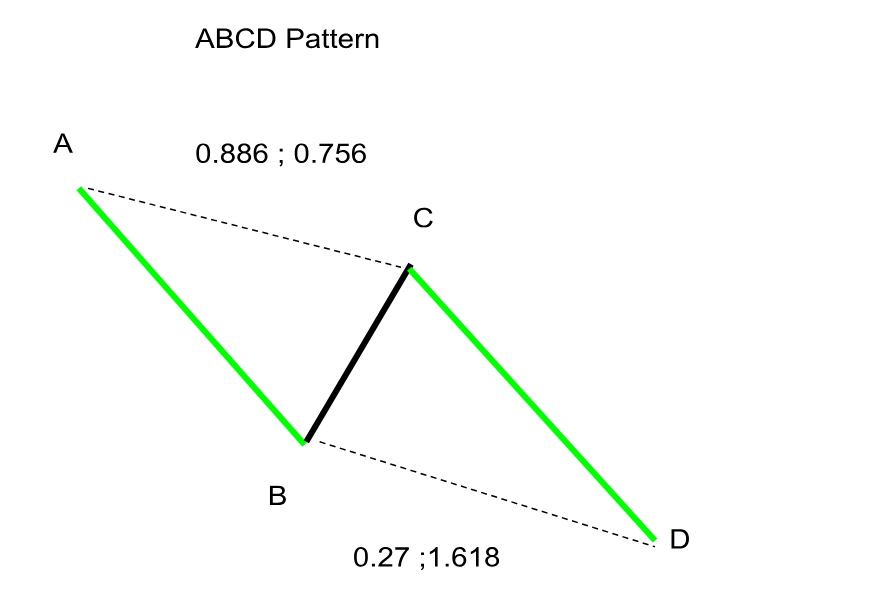
ABCD modelis, žinomas dėl savo aiškios struktūros ir nuspėjamo pobūdžio, laikomas vienu iš paprasčiausių, bet galingiausių harmoninių modelių. Jį sudaro dvi vienodos dalys: impulsyvus judėjimas (AB), po kurio seka korekcinis judėjimas (BC), ir dar vienas impulsyvus judėjimas (CD) priešinga kryptimi nei AB. Šiam modeliui atpažinti prekiautojai paprastai naudoja Fibonačio atsitraukimo koeficientus: BC koja paprastai atsitraukia nuo 61,8 % iki 78,6 % AB kojos, o CD koja paprastai atitinka AB kojos ilgį.
Pagrindinis ABCD modelio bruožas yra Potencialaus apsisukimo zona (PRZ), kurioje, kaip tikimasi, baigsis CD koja, signalizuodama apie galimą apsisukimą. Ši apsisukimo zona, apibrėžta tiksliais Fibonačio koeficientais, suteikia prekiautojams optimalų įėjimo į prekybą tašką.
Giliųjų krabų raštas
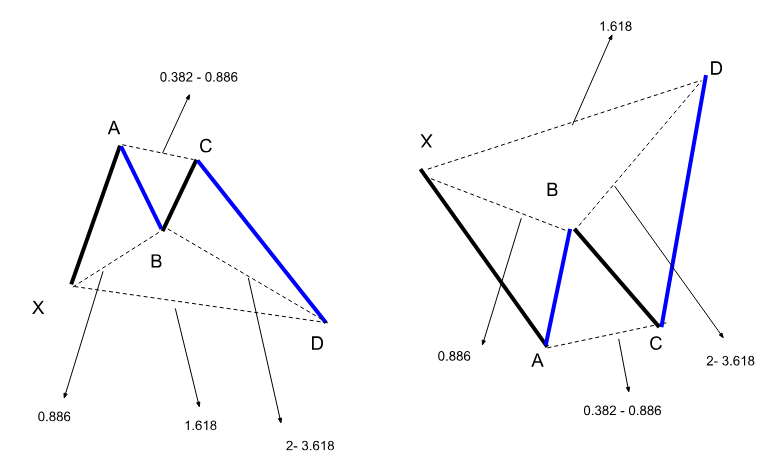
"Deep Crab" raštą sudaro penki taškai: X, A, B, C ir D. Formacija prasideda nuo XA kojos, po kurios seka atsitraukimas iki B taško, kuris turėtų būti 0,886 Fibonači atsitraukimas nuo XA. Tada BC koja tęsiasi iki 0,382-0,886 AB, taip sukurdama sąlygas kritinei CD kojai. CD koja yra labiausiai apibrėžiantis "Deep Crab" bruožas, nes ji tęsiasi iki 2,618-3,618 XA kojos. Šis pratęsimas veda į Potencialaus apsisukimo zoną (PRZ) D taške, kur prekiautojai tikisi potencialaus kainos apsisukimo. Be to, D taškas paprastai laikomas optimaliu laiku įeiti į prekybą.

KODĖL HARMONINIAI MODELIAI TOKIE POPULIARŪS FOREX PREKYBOJE?
Harmoniniai modeliai yra plačiai paplitę Forex prekyboje dėl savo tikslaus ir patikimo pobūdžio. Jie naudoja Fibonačio koeficientus kainų pokyčiams numatyti, todėl prekiautojams suteikia tikslius įėjimo ir išėjimo taškus, todėl lengviau sumažinti galimą riziką. Be to, dėl jų gebėjimo atpažinti galimus pokyčius labai nepastoviose rinkose, tokiose kaip Forex, jie tampa itin vertingomis priemonėmis.
KAIP NUSTATYTI IR NUPIEŠTI HARMONINIUS MODELIUS
Norėdami nustatyti ir nubrėžti harmoningus prekybos modelius, prekiautojai turi atpažinti, ar tai meškų, ar bulių rinka, ir tada nustatyti pagrindinius kainų taškus diagramoje, priklausomai nuo modelio. Kitas žingsnis - taikyti Fibonačio atsitraukimo ir pratęsimo įrankius, kad patikrintumėte modelio koeficientus.
Meškų ir bulių harmoniniai modeliai: Kuo skiriasi?
Meškų harmoniniai modeliai rodo galimą kainos mažėjimą, todėl prekiautojai turi parduoti pozicijas. Priešingai, bulių harmoniniai modeliai rodo galimą kainų kilimą ir skatina prekiautojus pirkti pozicijas.
KAIP PRADĖTI PREKIAUTI SU HARMONINIAIS MODELIAIS
Pradedant prekiauti su harmoninių modelių apima keletą esminių žingsnių.
- Išsilavinimas. Jei galvojate apie prekybą harmoniniais modeliais, kruopščiai supraskite jų teoriją ir aiškiai supraskite jų tipus.
- Pasirinkite strategiją. Atsižvelgdami į savo rinkos perspektyvas, nuspręskite, ar rinksitės meškų, ar bulių strategiją.
- Nustatykite tikslus. Nustatykite aiškius pelno ir nuostolių tikslus, kad sumažintumėte riziką.
- Nustatykite įvažiavimo ir išvažiavimo taškus. Naudokite Fibonačio koeficientus, kad tiksliai nustatytumėte įėjimo ir išėjimo taškus ir užtikrintumėte tinkamą modelio identifikavimą.
- Atidarykite prekybos sąskaitą. Pasirinkite patikimą tarpininkavimo platformą, pavyzdžiui, J2T, kuri suteiks jums visas harmoninio modelio prekybos priemones.
- Praktika demo sąskaitoje. Įgykite patirties ir patobulinkite savo įgūdžius demo sąskaitoje, kad galėtumėte praktikuotis prekiauti be finansinės rizikos.
IŠVADA
Harmoniniai modeliai yra tikslūs įrankiai prognozuoti rinkos judėjimą, naudojant Fibonačio koeficientus, siekiant nustatyti tikėtinas apsisukimo zonas. Pagrindiniai modeliai, tokie kaip Shark, Cypher, ABCD ir Deep Crab, suteikia aiškius įėjimo ir išėjimo signalus. Tačiau, nepaisant to, kad jie populiarūs dėl savo tikslumo, prekiautojai turi išlikti budrūs dėl galimos rizikos, pavyzdžiui, neteisingo identifikavimo ir rinkos svyravimų. Praktikuodamiesi su demonstracinėmis sąskaitomis ir atlikdami išsamią analizę galite sumažinti šią riziką ir pagerinti savo prekybos rezultatus.
DUK
Kas yra harmoniniai modeliai?
Harmoniniai modeliai yra geometriniai modeliai, atsirandantys akcijų rinkos diagramose, kuriuos sukuria Fibonačio sekos. Atpažindami tam tikrus kainų pokyčius ir palaikymo bei pasipriešinimo lygius, jie padeda prekiautojams numatyti tendencijų pokyčius, taip pat siūlo pelno tikslus ir rizikos kontrolę.
Koks yra galingiausias harmoninis modelis?
Daugelis mano, kad Gartley raštas yra įtakingiausias harmoninis raštas. Modelių analizė akcijų rinkoje naudojama siekiant tiksliai prognozuoti tendencijų pasikeitimus, naudojant konkrečius Fibonačio koeficientus patikimiems įėjimo ir išėjimo taškams nustatyti.
Ar harmoninė prekyba tikrai veikia?
Dauguma harmoninių modelių veikia efektyviai, kai jie tiksliai suderinami su Fibonačio koeficientais. Jis padeda nustatyti tendencijos apsisukimus ir nustatyti pelno tikslus, tačiau jo sėkmė priklauso nuo tikslaus modelio atpažinimo ir rinkos sąlygų finansų rinkose.
Koks yra harmonikų modelis ABCD?
ABCD modelis yra paprastas harmoninis modelis, kuriame AB ir CD kojos yra vienodo ilgio, o BC koja atkartoja AB dalį. Jis naudojamas galimiems tendencijos apsisukimams nustatyti ir pelno tikslams nustatyti.
Kokie yra harmoniniai modeliai pradedantiesiems?
Pradedantieji dažnai pradeda nuo paprastesnių modelių, tokių kaip ABCD ir Gartley, kuriuose naudojami pagrindiniai Fibonačio koeficientai ir kuriuos lengviau atpažinti. Šie modeliai padeda suprasti pagrindinius harmoninių modelių analizės finansų rinkose principus.
Kokie yra populiariausi harmoniniai modeliai?
Populiariausi harmoniniai prekybos modeliai yra Gartley, drugelis, šikšnosparnis ir krabų modeliai. Šie modeliai plačiai naudojami dėl jų gebėjimo prognozuoti tendencijų pasikeitimus ir nustatyti tikslius pelno tikslus, naudojant Fibonačio koeficientus akcijų rinkoje.
