Morning Star Pattern: What It Is and How to Trade It
)
The morning star pattern is a classic reversal signal widely used in technical analysis. Found on candlestick charts, this pattern helps traders spot the end of a bearish trend and anticipate a bullish reversal. It consists of three distinct candlesticks and offers a clear visual representation of changing momentum. Traders use the morning star as a key confirmation tool before entering long positions. By understanding this structure, investors can make better trading decisions across various markets including stocks, forex, and commodities. If you're eager to boost your trading confidence, learning the morning star pattern is a solid place to start. A valid morning star formation can appear at any time in trending markets, giving it universal appeal.
Table of Contents
Key Takeaways
What Is a Morning Star Candlestick Pattern?
Trading with the Morning Star Pattern
Morning Star Variations and Related Patterns
Benefits and Limitations
Final Thoughts
FAQs
Key Takeaways
- A morning star pattern is a three-candle bullish reversal pattern.
- It occurs after a downward trend and marks a shift to bullish price movement.
- The second candle reflects market hesitation or indecision.
- Volume and other technical indicators should confirm the pattern.
- This visual pattern is stronger on higher timeframes and near support levels.
What Is a Morning Star Candlestick Pattern?
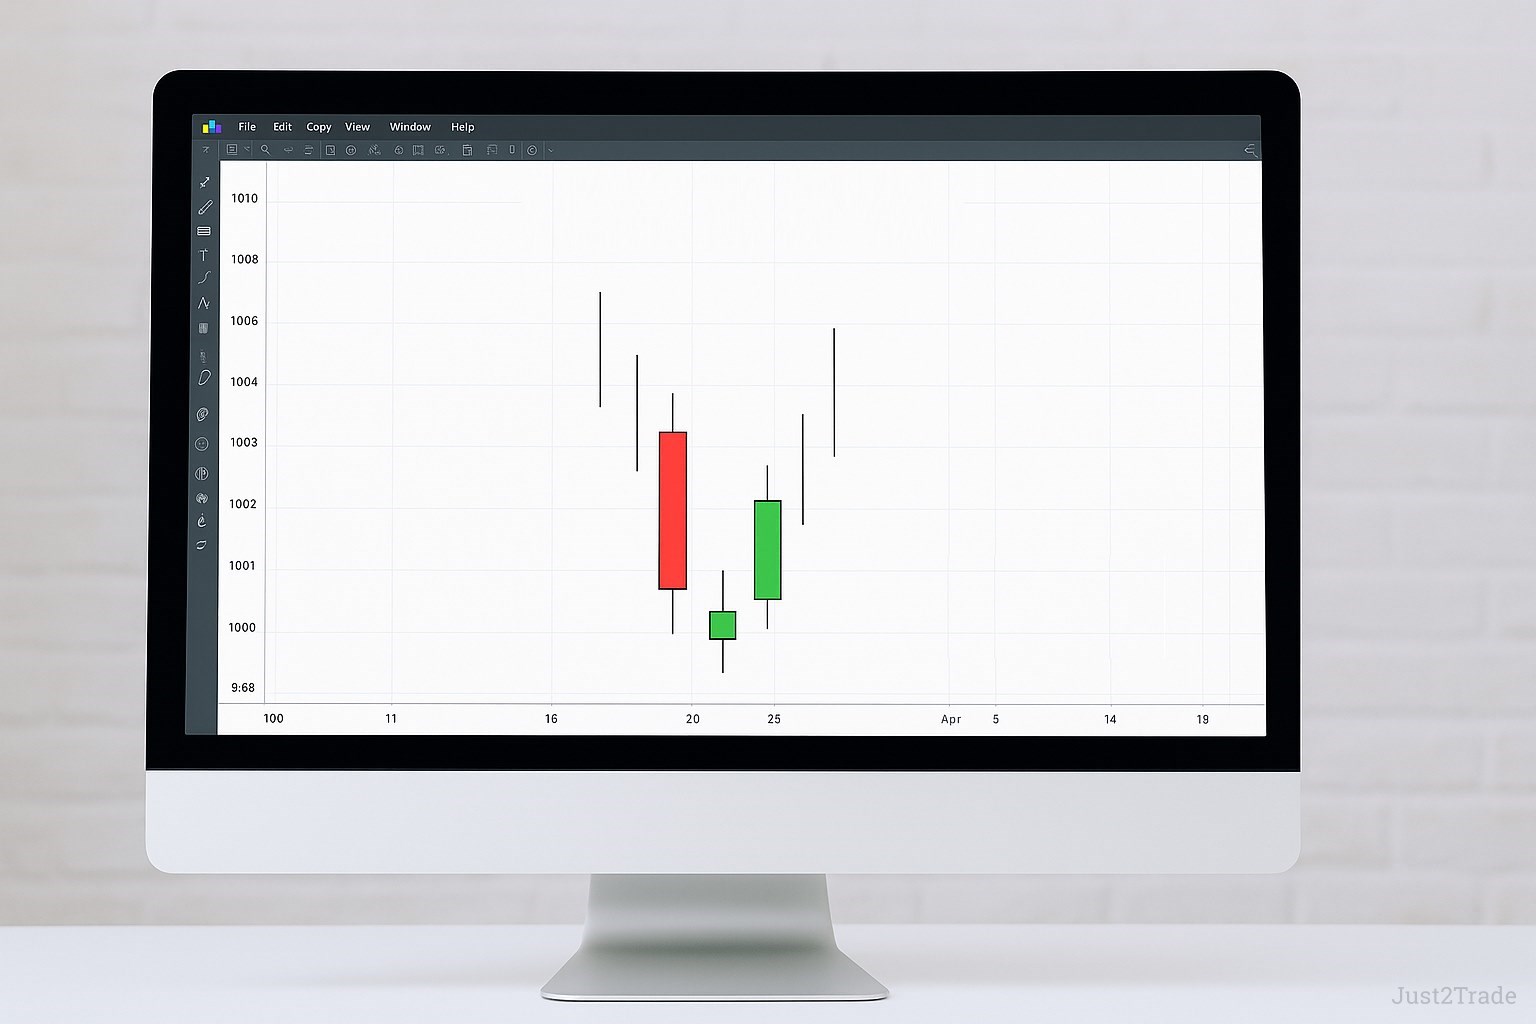
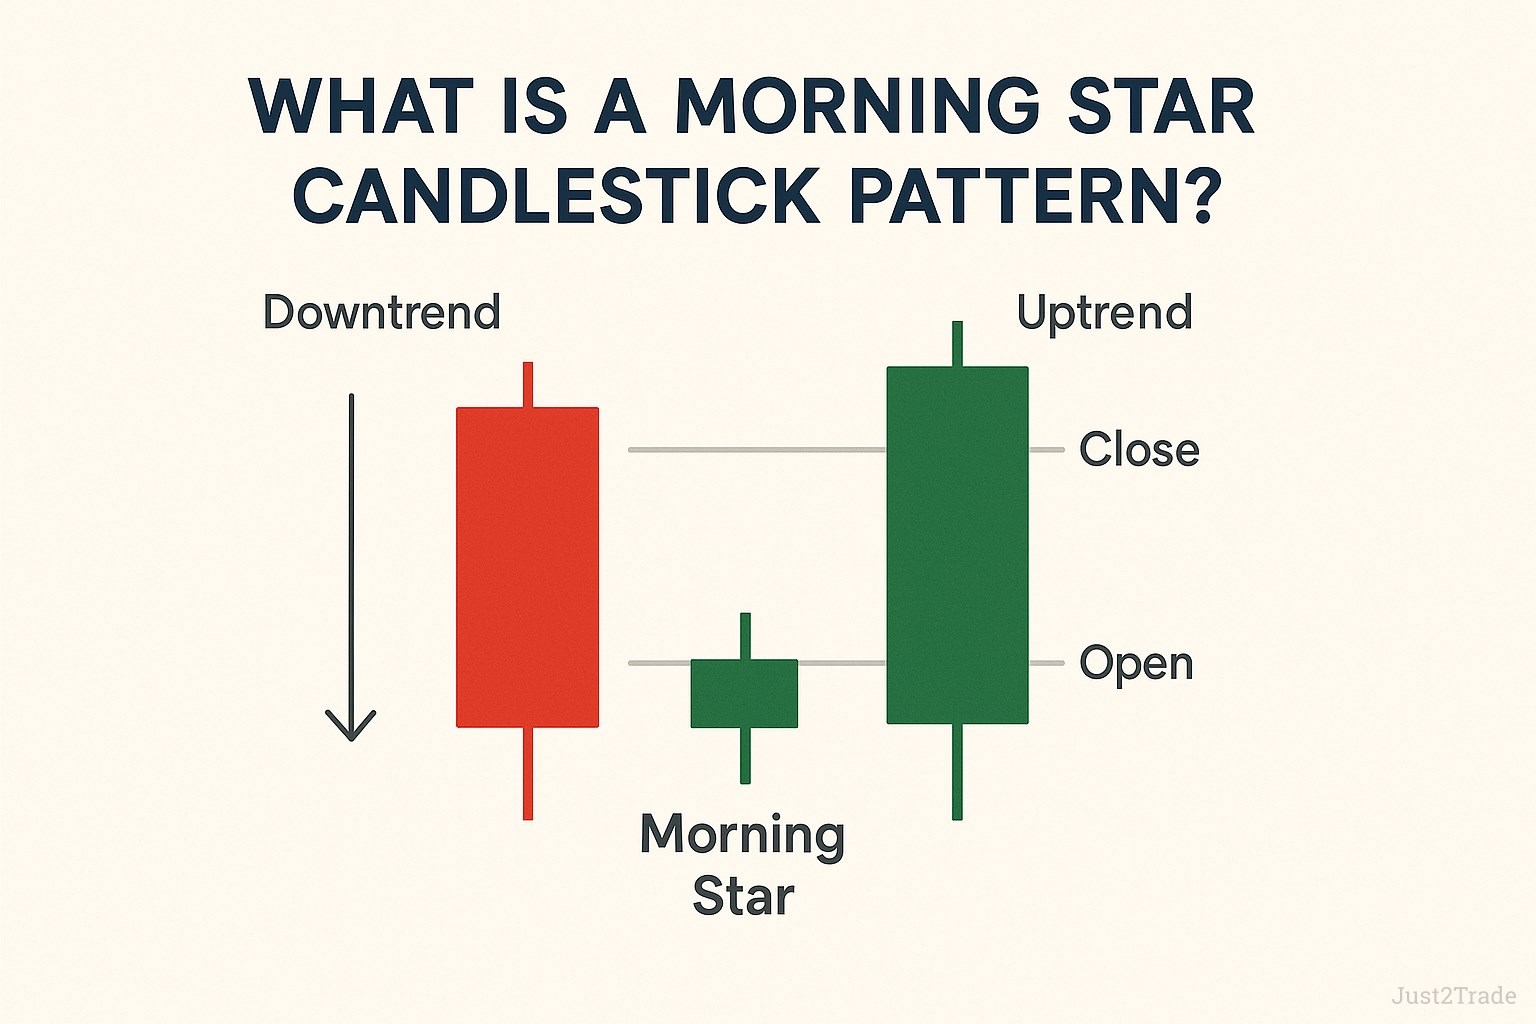
The morning star candlestick pattern is a visual signal used to identify a potential trend reversal from bearish to bullish. This pattern consists of three candles: the first is a long red (bearish) candle that confirms strong selling pressure. The second is a small-bodied candle—often a doji or spinning top—which signifies market indecision and reduced momentum. The third is a long green (bullish) candle that opens with a gap up and closes well into the body of the first candle, confirming a shift to buyer control. The morning star consists of a powerful signal sequence that many traders trust to signal a potential price bottom. This three-candle pattern is viewed by technical analysts as a reliable early indicator of price trend reversals. The morning star typically appears at the bottom of a downtrend and signals the beginning of a bullish movement. It is considered a strong morning star pattern bullish confirmation in both forex and stock markets.
)
When Morning Star Candlestick Patterns Occur
Morning star candlestick patterns can be observed across various financial instruments, including stocks, forex pairs, cryptocurrencies, and commodities. They form on different timeframes, but are more reliable on higher ones such as daily or weekly charts. This increased reliability is due to stronger price action and more significant market participation. In markets with high liquidity and active trading sessions, such as forex and large-cap equities, the pattern stands out more clearly. Traders often monitor for morning star candles after prolonged downtrends, where selling has exhausted momentum. The pattern is especially useful for swing traders and position traders looking for signs of a bottoming structure and a potential upward reversal. The morning star appears when traders least expect it, often following a sharp bearish selloff.
Psychology Behind the Pattern
The morning star pattern reflects a shift in market sentiment and reveals the psychological dynamics between sellers and buyers. The first candle shows that bears are firmly in control, pushing the price downward. The second candle, usually a doji or small candlestick, shows a pause—the selling pressure has weakened, and the market enters a state of uncertainty. This middle candlestick captures the hesitation of both bulls and bears. Finally, the third candle, a large bullish candlestick, confirms that bulls have taken over. It demonstrates that buyer confidence has returned, and a new upward trend may be forming. This psychological shift from fear to optimism is what makes the morning star reversal pattern a powerful bullish signal.
Trading with the Morning Star Pattern
Trading the morning star pattern involves more than simply spotting it on the chart. Traders must wait for the pattern to fully form, with all three candles clearly visible. The third candle’s close above the midpoint of the first candle is essential for confirmation. Additional confirmation tools such as volume spikes and technical indicators like the RSI, MACD, or bullish MACD crossover are often used to strengthen the signal. Traders typically enter long positions on the open of the next candle after the morning star formation is complete. Risk management is key—stop losses should be placed below the low of the pattern, and profit targets should align with resistance levels or a defined risk-reward ratio. This structured trading strategy helps ensure consistency and reduces exposure to false signals. Among various candlestick signals, morning star candles are widely favored for their clarity and reliability.
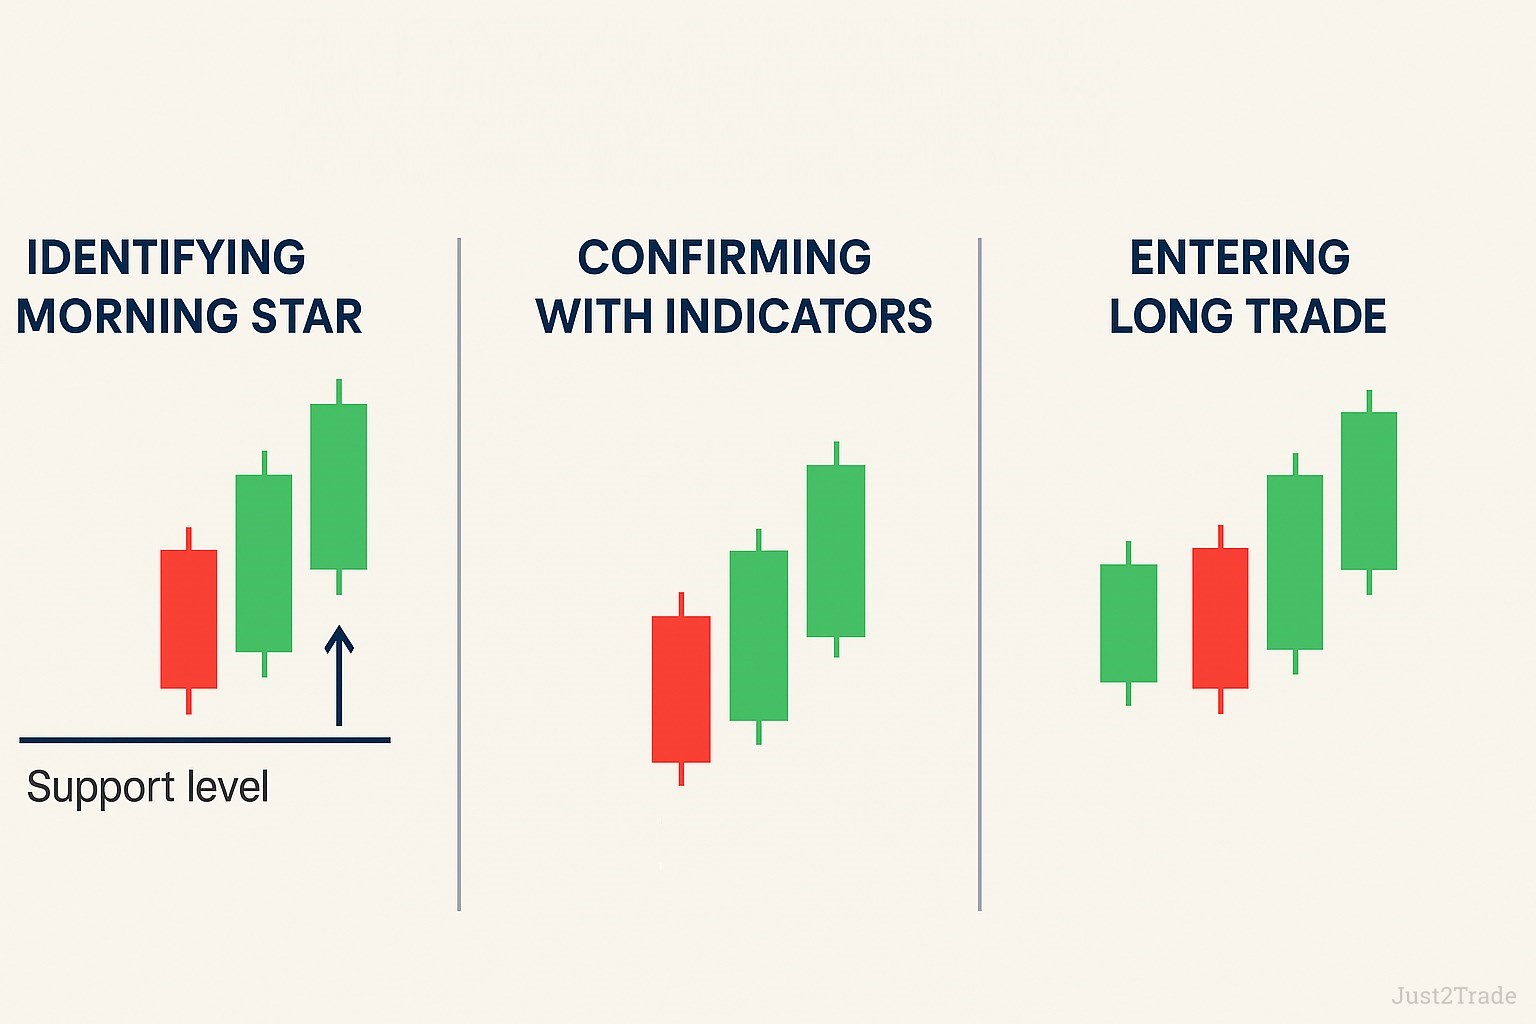
Entry Strategy
A strong entry strategy starts by identifying a valid morning star formation at or near a known support level. Traders should wait for the pattern to complete and for the third candle to close above the midpoint of the first bearish candle. This confirms bullish momentum. To improve accuracy, combine pattern recognition with momentum indicators like the Relative Strength Index (RSI) or MACD. For example, an RSI reading below 30 indicates oversold conditions, and a bullish crossover on MACD enhances the signal. Only enter long trades when both the price and technical indicators suggest a strong reversal. Multiple morning star patterns in a trend may increase the strength of a potential move.
)
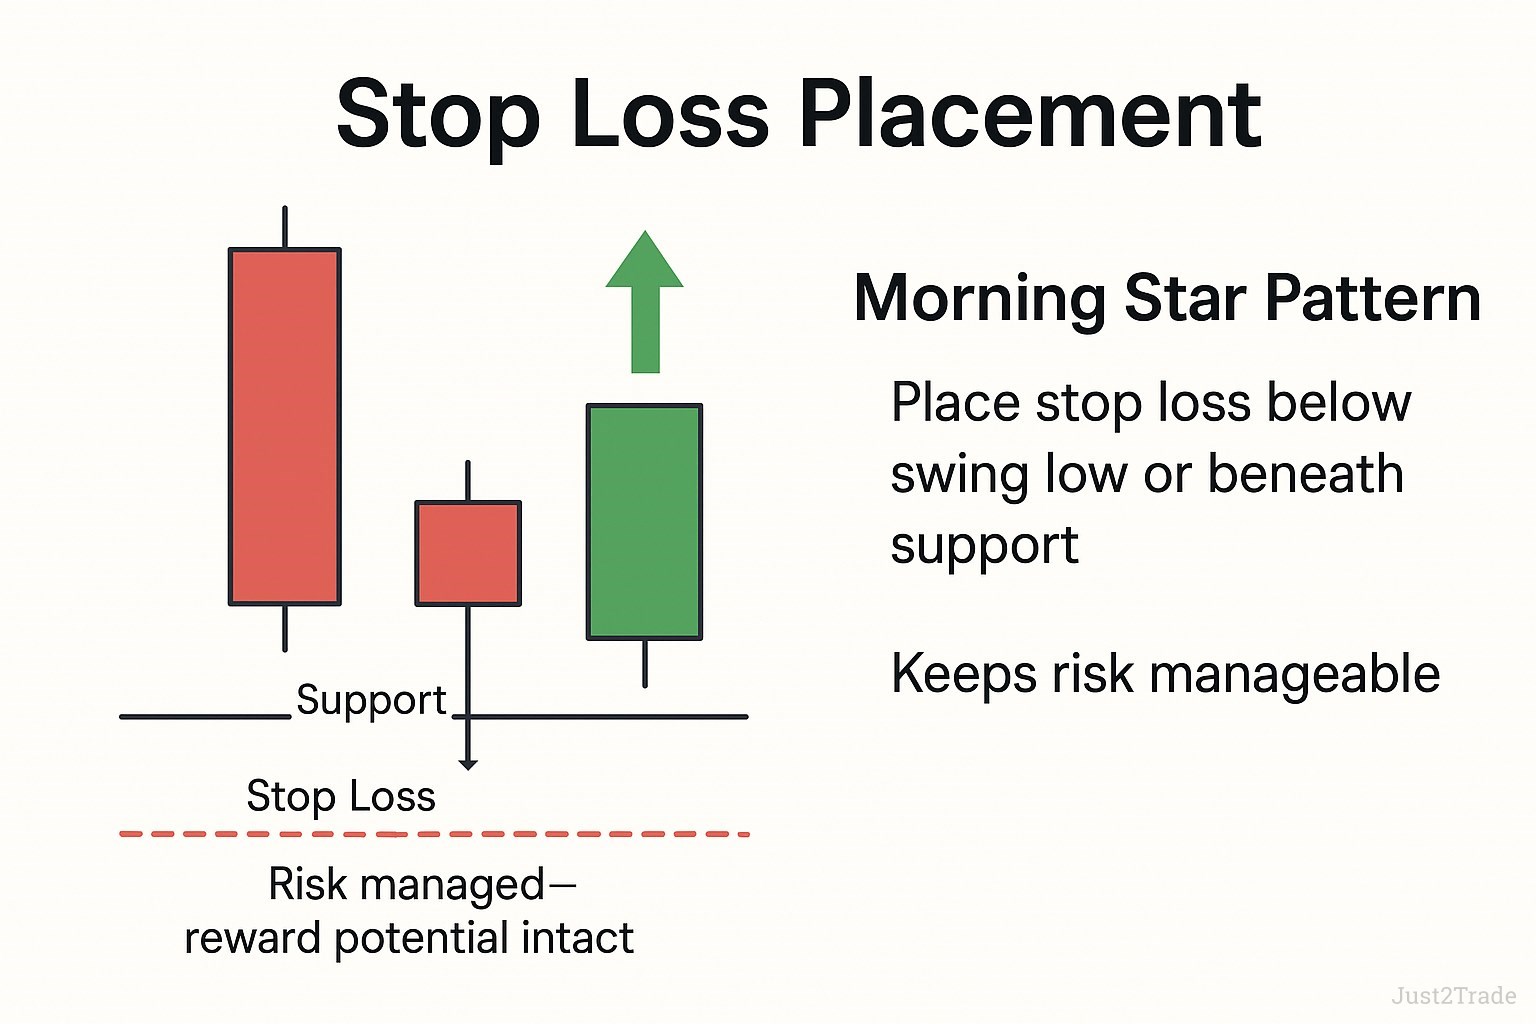
Stop Loss Placement
Proper stop loss placement is critical when trading the morning star pattern. Traders should place their stop loss just below the swing low of the pattern or beneath the nearby support level. This approach protects against deeper retracements and unexpected volatility while keeping risk manageable. Using the pattern's structural low offers a clear technical boundary for risk management.
)
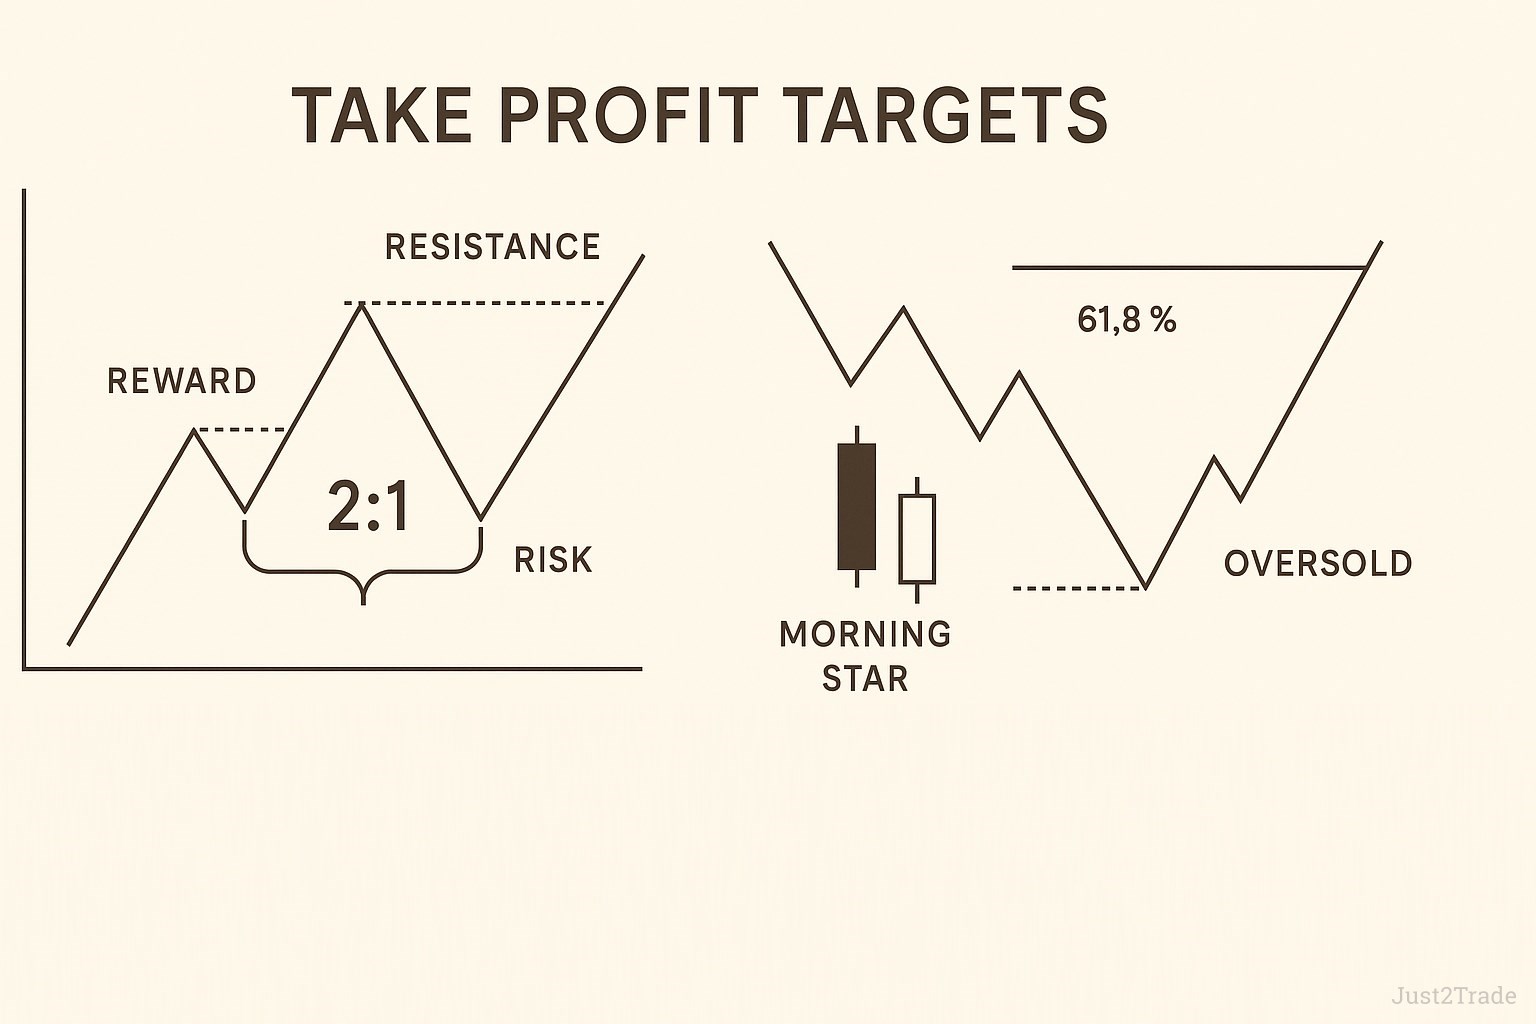
Take Profit Targets
Setting a take-profit target should involve both technical and risk-reward considerations. A commonly used method is the 2:1 risk-reward ratio, which means the potential reward is twice the amount of risk taken. Profit targets are often aligned with resistance levels, Fibonacci retracement zones, or prior swing highs. Identifying logical exit points increases consistency in trade management. Morning star forms that develop alongside oversold indicators can lead to longer price trends, making them ideal for longer-term targets.
)
Morning Star Variations and Related Patterns
The morning star pattern has several variations. One of the most recognized forms is the morning doji star. In this variation, the second candle is a doji, which has little to no real body. This signals even greater market indecision and can indicate a more powerful reversal when confirmed by the third candle. Morning star candlestick patterns with doji tend to attract stronger volume reactions and are often seen as a more reliable setup. In practice, recognizing these variations helps traders avoid misinterpretations and better adapt to changing market conditions. The morning star consists of a clear three-candle structure, and spotting this among other candlestick patterns improves decision-making.
Evening Star Pattern
The evening star pattern is the bearish counterpart to the morning star and indicates a potential reversal from an uptrend to a downtrend. It consists of three candles: a long bullish (white or green) candle, a small-bodied candle (often a doji), and a long bearish (black or red) candle. The final candle opens lower and closes deep into the first candle's body, confirming the reversal. This bearish reversal pattern is a signal for traders to consider exiting long positions or preparing for short setups. Understanding both morning and evening star patterns provides a balanced view of trend reversals.
Benefits and Limitations
The morning star candlestick pattern is praised for its broad applicability and visual clarity. It offers a strong bullish signal and can be applied across multiple markets and timeframes. Its greatest strength lies in its simplicity and the psychological insight it provides into market sentiment. However, like all technical tools, it has limitations. The pattern may produce false signals, especially in sideways or low-volume markets. Traders must avoid relying solely on visual patterns and instead use confirmation tools such as volume, support and resistance analysis, and trend-following indicators. When traders rely too heavily on the pattern alone, they risk missing key market dynamics. Balancing visual clues with experience is critical. Despite limitations, when the morning star reversal pattern is confirmed with strong volume, it remains a favorite among traders.
Pros:
- Easy to recognize;
- Strong bullish reversal signal;
- Works across all markets.
Cons:
- Can give false signals
- Needs confirmation tools
- Less effective on low volume
Final Thoughts
The morning star pattern is a reliable reversal signal in technical analysis, especially when used with complementary indicators and sound trading principles. It is most effective when spotted at the end of a bearish trend, near a support level, and confirmed by rising volume or a bullish MACD crossover. While its structure is easy to identify, successful application requires discipline, risk management, and practice. Use this candlestick pattern as part of a comprehensive trading strategy that includes historical chart analysis, indicator confirmation, and a clear understanding of price action. Always test new strategies on a demo account before applying them in live markets. When morning star candles align with fundamental catalysts, they can mark significant trend shifts.
FAQs
What does the Morning Star candlestick mean?
It signals a potential bullish reversal after a downtrend. It shows weakening selling pressure and growing buyer interest.
Is morning doji star bullish or bearish?
Bullish. The doji indicates indecision, and the next bullish candle confirms reversal.
What are the rules for Morning Star?
Three candles: bearish, small or doji, bullish. Formed after a downtrend. Confirmation needed with volume or indicators.
What is the success rate of the Morning Star pattern?
Success varies by market and timeframe but is generally higher on daily charts with volume confirmation.
How do you trade morning star candles?
Wait for full pattern formation and confirmation. Enter long near support. Use stop loss below swing low. Exit near resistance.