Operating Leverage
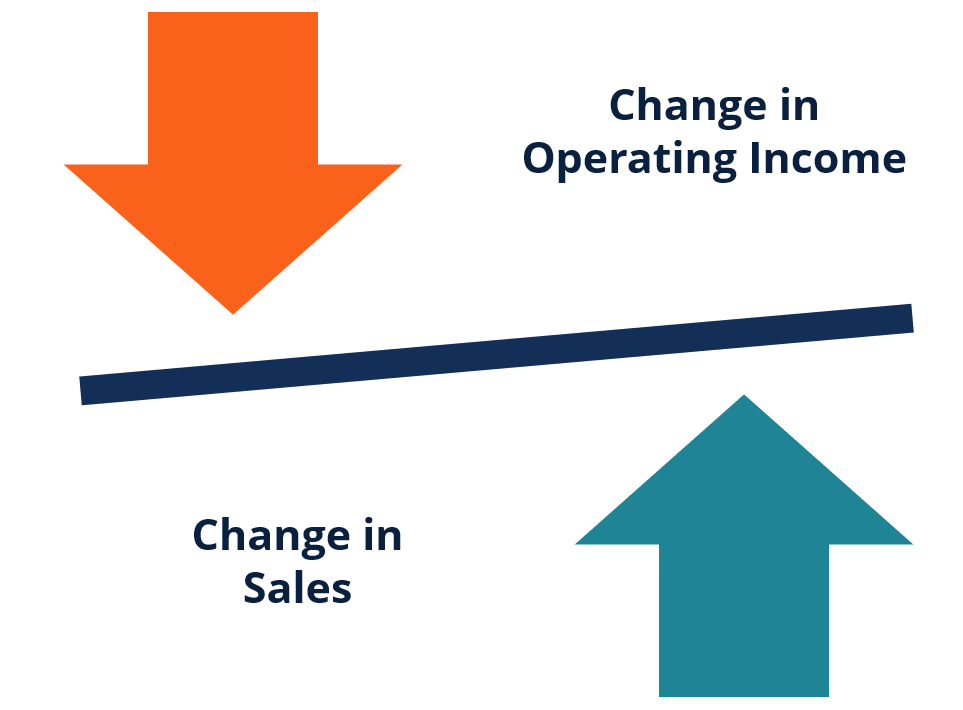
Table of contents:
Key takeaways
What Is Operating Leverage?
Operating Leverage Formula
Operating Leverage Example
Real Company Example: Operating Leverage
What is a Good Operating Leverage?
Bottom Line
FAQs
Many different metrics allow you to evaluate the company's profit or productivity, and efficiency. Operating leverage is one of these metrics. It is a necessary tool for a successful business. In this article, we will give various formulas, and specific examples, and most importantly, we will talk about why operating leverage is needed and how to use it.
Key takeaways
- To calculate operating leverage, divide the Fixed Costs by (Fixed Costs + Variable Costs).
- The higher the operational gearing is, the less stable the business is and the more susceptible it is to the risk of becoming unprofitable during difficult periods, but the faster it increases profit when conditions are favorable.
- The higher the share of constant costs and the lower the share of variable costs are, the greater the operating leverage.
- When the owner knows his operating leverage and what influences it, he can change it - increase it when sales grow and decrease it when they fall.
What Is Operating Leverage?
Operating leverage (or operational gearing) is a metric that allows you to assess the riskiness of a business, as well as the potential for contribution margin growth. Operational gearing is calculated using the formulas we provide below in the article. Operating leverage depends on revenue, contribution margin, and expenses. The type of expenses - fixed or variable - plays a big role. With fixed costs, the operational gearing will be higher, and with variable expenses, it will be lower.
However, it is worth noting that a high or low level does not indicate the profitability or unprofitability of a business; it is not a sign of quality. Constant cost intensity will be different in different companies. Moreover, in some areas, a low fixed-cost intensity will be an advantage, and in others, it will not. But we will talk about this later in the article.
What are Fixed Costs?
Fixed costs are those costs that remain unchanged for a long time. Constant costs include:
- rent of premises or office
- expenses for heating
- lighting of premises
- fixed salaries of employees
- advertising and promotion costs
The amount of such costs practically does not change, therefore they are called fixed.
What are Variable Costs?
Variable costs are unstable, i.e. they change every month depending on the company's needs. Variable costs include:
- costs of materials for production
- piecework (variable) wages
- transportation costs
- electricity costs for the production process
Such costs are difficult to predict 100% since these will be different amounts every month.
Operating Leverage Formula
Operational gearing has several formulas by which you can calculate how much profit will change if revenue increases or decreases.
Operating Leverage Formula 1: Fixed Costs / (Fixed Costs + Variable Costs)
In this formula, we will need the company's fixed and variable costs for several years. In fact, the more constant costs there are, the higher the degree of operating leverage will be. And if there are more variable costs, the degree of operating leverage will be less.
Operating Leverage =
Fixed Costs
(Fixed Costs + Variable Costs)
Operating Leverage Formula 2: % Change in Operating Income / % Change in Sales
This formula can be used when a company has publicly available annual profit reports. For example, ABC Company increased its operating income (EBIT) from $300 to $400, and sales increased from $1200 to $2500. Then ABC Company's operational gearing will be 30%/108% = 28%.
However, this formula has a downside: it does not take into account fixed and variable costs directly, although this has a huge impact on the company and sales.
Operating Leverage =
% Change in Operating Income
% Change in Sales
Operating Leverage Formula 3: Net Income / Fixed Costs
This formula is suitable for a company with a large number of fixed costs. In this formula, we divide net income by constant costs. A high result will show that your business is more dependent on constant costs, which can bring advantages in a stable market, a low result will show less dependence on constant costs, which means your business is more flexible.
Operating Leverage =
Net Income
Fixed Costs
Operating Leverage Formula 4: Contribution Margin or Gross Margin / Operating Margin
This formula calculates operating leverage by dividing either the contribution margin or gross margin by the operating one. A higher result suggests a greater proportion of constant costs in the company's cost structure, implying higher profit potential with sales growth but also greater risk during downturns.
Operating Leverage =
Contribution Margin or Gross Margin
Operating Margin
Operating Leverage Example
Let's say we have two companies, Company A and Company B, both selling widgets.
Company A:
- Fixed Costs: $270,000
- Variable Costs: $180,000
- Sales Revenue: $1 000,000
Company B:
- Fixed Costs: $200,000
- Variable Costs: $270,000
- Sales Revenue: $1 000,000
Company A: Operating Leverage = $270,000 / ($270,000 + $180,000) = 0.6
Company B: Operating Leverage = $200,000 / ($200,000 + $270,000) = 0.42
Company A has higher operating leverage (0.6) than Company B (0.42). For Company A, we can see more constant costs, which means that this company is less likely to adapt to change. When sales increase, Company A will see significant growth, but when sales decrease, the contribution margin loss will also be significant. As for Company B, we see a lower risk/reward profile, so Company B will have a harder time growing revenue, but when sales decrease, the profit loss will not affect the company as much.
Real Company Example: Operating Leverage
Minerals Technologies Inc has an annual contribution margin statement that is publicly available, so we will use their example to look at how operational gearing works. So, the annual report of Minerals Technologies Inc for 2023 shows revenue of $2.17 billion, and for 2022 $2.12 billion. Meanwhile, the operating income of Minerals Technologies Inc in 2023 was $172 million, and in 2022 $214.8 million.
Using a simplified formula for the degree of operating leverage (figures are in millions of dollars):
-
[($2,170 / $2,120) - 1] / [($172 / $214.8) - 1] = 0.023 / -0.12 = 0.191
- ($2,170 / $2,120) - 1 = 0.023 is the percentage change in annual revenue
- ($172 / $214.8) - 1 = -0.12 is the percentage change in the company's annual operating income.
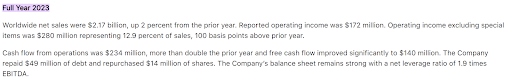)
What is a Good Operating Leverage?
Good operating leverage depends on the company's specialization, namely the amount of fixed and variable costs.
High Operating Leverage Industries
High operating leverage is found in companies with a prevailing number of constant costs. This allows them to earn good profits if sales grow (after all, costs remain virtually unchanged) and prices for products or services are stable. However, companies with high operating leverage are less flexible and adapt worse to changes in the market.
Industries with high operating leverage include manufacturing, energy, telecommunications, transportation, and retail.
In manufacturing, we can highlight aircraft manufacturing, pharmaceuticals, and automobile manufacturing - these areas have high but fixed costs.
As for retail, if the highest costs are fixed, let's say a store has the highest costs due to renting premises, then this business will have high operating leverage.
Low Operating Leverage Industries
Low operating leverage means that the company has a large share of variable costs. This makes the company flexible, but with less profit potential.
Industries with low operating leverage are considered service industries, such as restaurants, hairdressers, consulting. Such industries have more variable costs, but such a business can better adapt to changes.
Also, low operating leverage is found in companies associated with small-scale production, clothing sales, information technology. This doesn’t mean that companies are not profitable; in some cases, low operating leverage is an advantage, for example, if one trend in the market is quickly replaced by another and companies are forced to adjust in a timely manner.
Bottom Line
We hope our comprehensive guide to operational gearing was useful for you and answered all your questions. Operating leverage is an integral part of business analysis that can reveal the strengths and weaknesses of a company.
FAQs
What Does Operating Leverage Tell You?
Operating leverage shows the risks of the company, because if the fixed costs intensity is high, then this company will be more sensitive to changes, and the operational gearing also indicates the growth potential.
What Is the Degree of Operating Leverage (DOL)?
The Degree of Operating Leverage (DOL) measures how much operating income changes in response to a change in sales. It quantifies the impact of constant costs on a company's profitability, showing how sensitive its earnings are to sales fluctuations.
What Are Examples of High and Low Operating Leverage?
Examples of high operating leverage include companies in the telecommunications, transportation, and electric power industries. Examples of companies with low constant cost intensity include IT companies, clothing stores, and some other retail companies.
What is the Difference Between Operating Leverage and Financial Leverage?
Operating leverage measures the riskiness of a business based on fixed and variable costs and changes in operating income and revenue, while financial leverage measures the risks associated with debt financing to increase earnings.
How to Interpret Operating Leverage in Real Life?
High operating leverage means a company's profits are highly sensitive to sales changes – big gains when sales rise, but big losses when they fall. Low leverage is more stable but with smaller potential gains. Think of it like a seesaw – the higher the fixed costs, the more dramatic the swings in profitability.