Slippage in Trading: What It Is, Why It Happens, and How to Minimise It
Slippage is the difference between a trade's expected execution price and the actual price at which the order fills. Market orders carry the highest slippage vulnerability because market orders prioritise speed over price certainty.
Slippage occurs across forex, equities, and futures markets during periods of high volatility or low liquidity. The Financial Conduct Authority (FCA) requires brokers to disclose execution quality data, including slippage statistics, to retail clients.
Table of Contents
Slippage Definition: What Every Trader Should Understand
What Causes Slippage in Trading?
Real-World Slippage Examples
Slippage Across Different Markets
Strategies to Minimise Slippage in Trading
Calculating and Monitoring Slippage
Frequently Asked Questions
Key Takeaways
- Slippage measures the gap between an order's expected price and the actual execution price
- Positive slippage improves execution price; negative slippage worsens it
- Limit orders provide the strongest protection against negative slippage
- Market volatility, low liquidity, and wide bid-ask spreads are the three primary causes
- Slippage tolerance settings allow traders to define the maximum acceptable price deviation
Slippage Definition: What Every Trader Should Understand
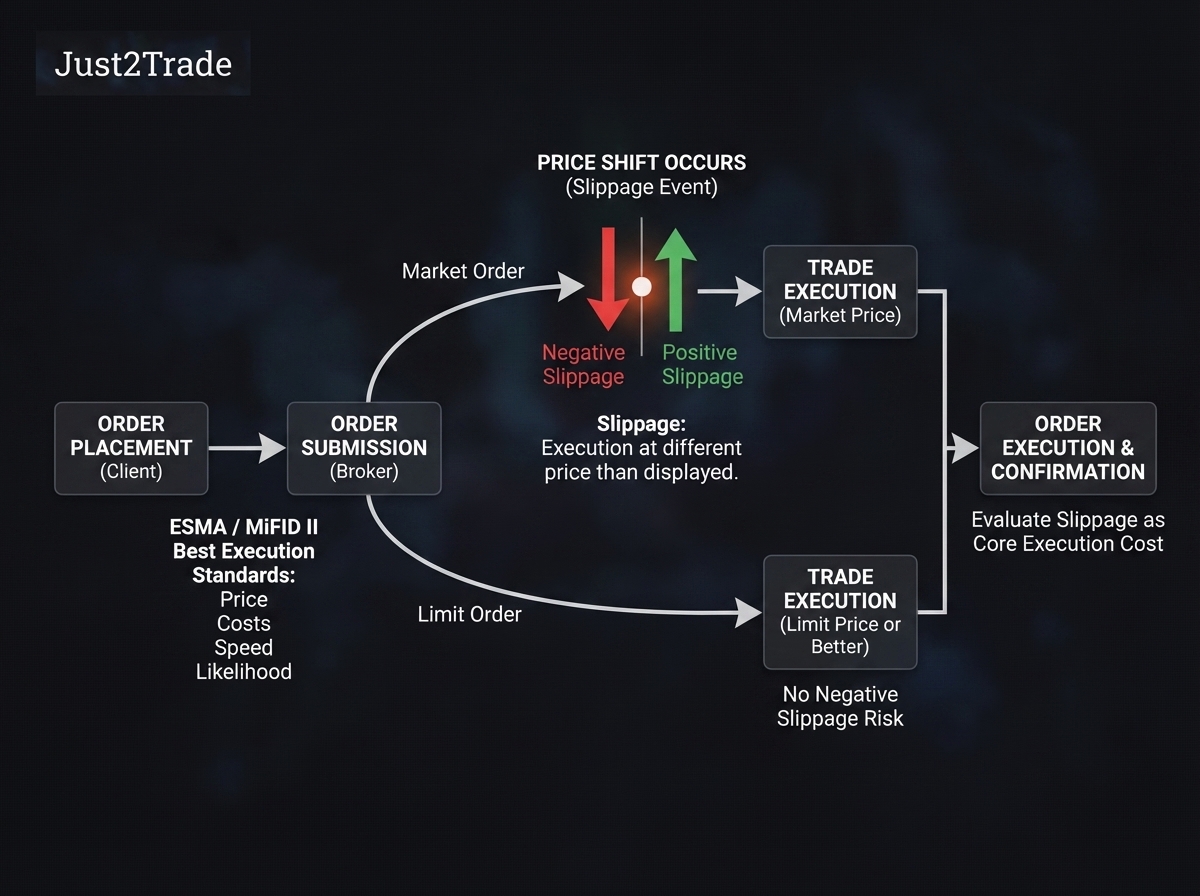
Slippage is a price execution event that occurs when a trade fills at a different price from the price displayed at order submission. The European Securities and Markets Authority (ESMA) mandates best execution standards under MiFID II, requiring investment firms to obtain the best possible result for clients based on price, costs, speed, and likelihood of execution.
Market orders guarantee execution but not price. Limit orders eliminate negative slippage risk by restricting execution to the specified price or better. Traders who want to understand how order types interact with market risks should evaluate slippage as a core execution cost.
)
Types of Slippage: When Price Gaps Work For and Against You
Slippage operates in two directions: positive slippage (also called price improvement) and negative slippage (adverse execution). Price improvement occurs when a buy order fills below the expected ask price or a sell order fills above the expected bid price.
| Attribute |
Positive Slippage |
Negative Slippage |
| Definition |
Execution at a better price than expected |
Execution at a worse price than expected |
| Buy Order Example |
Expected: $50.00; Filled: $49.95 |
Expected: $50.00; Filled: $50.08 |
| Sell Order Example |
Expected: $50.00; Filled: $50.05 |
Expected: $50.00; Filled: $49.92 |
| Impact on Trader |
Reduces cost or increases proceeds |
Increases cost or reduces proceeds |
Types of Slippage by Order Type and Timing
- Market orders accept the best available price at fill. Tip: Reserve market orders for liquid instruments during peak hours.
- Limit orders restrict execution to a specified price or better. Tip: Place limit orders slightly inside the spread to increase fill probability.
- Stop-loss orders convert to market orders when triggered. Tip: Use stop-limit orders or GSLOs for positions held through volatility windows.
Timing-based slippage affects traders during weekend gaps, session opens, and scheduled economic releases.
What Causes Slippage in Trading?
Slippage results from mismatches between order submission timing and available market liquidity at the requested price. The five primary causes, ranked by frequency, affect traders across all markets.
- Market volatility drives the majority of slippage events during high-impact news releases
- Low market liquidity forces orders to fill at progressively worse price levels
- Wide bid-ask spreads increase baseline execution costs
- Order execution delays allow prices to shift before the order reaches the market
- Large order sizes exhaust available volume at the target price
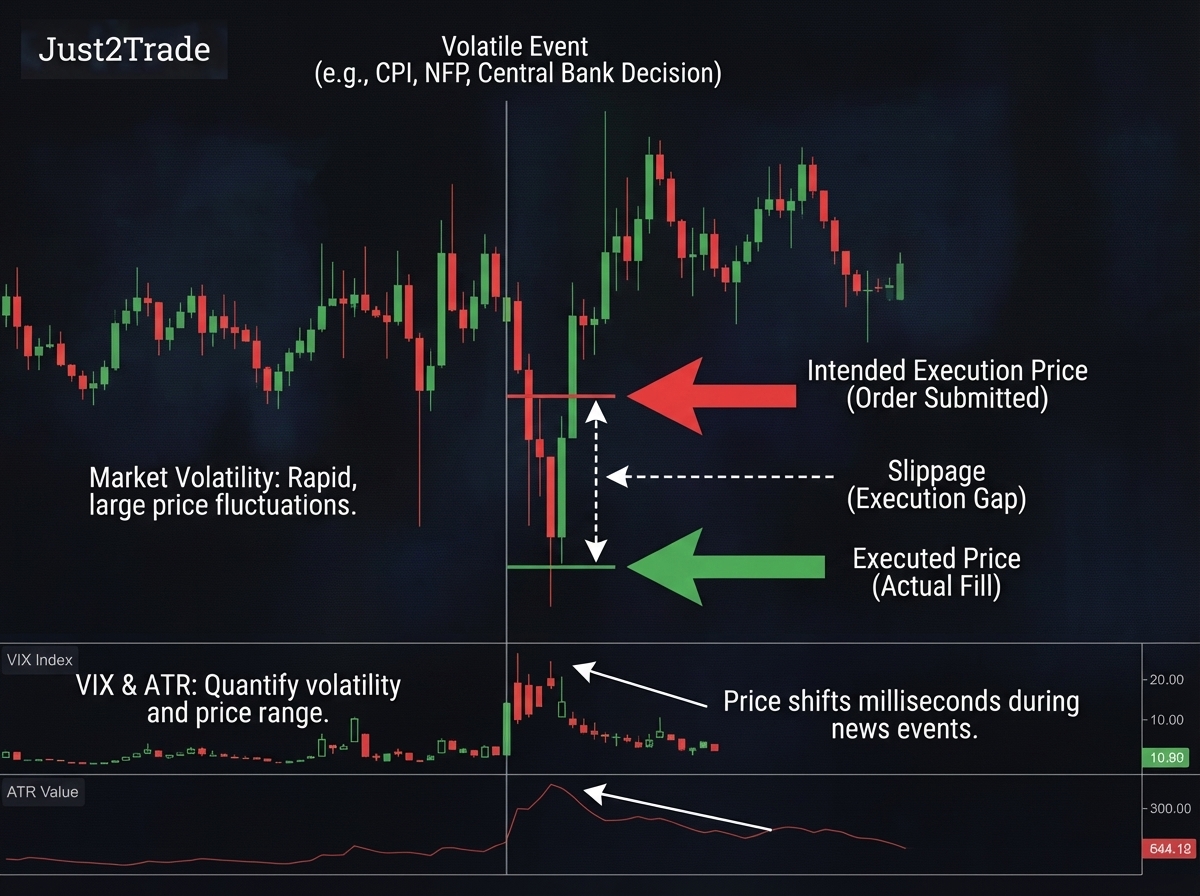
Market Volatility: The Primary Cause
Market volatility measures the rate and magnitude of price fluctuation over a given period. The VIX index quantifies expected equity volatility over 30 days, while the Average True Range (ATR) indicator measures recent price range on any instrument. During central bank decisions, CPI releases, and NFP announcements, prices can shift multiple pips within milliseconds.
)
Liquidity: When There Is No One on the Other Side
Market liquidity represents the ease with which an asset can be bought or sold without significantly affecting price. Order book depth displays cumulative volume at each price level, giving traders a direct measure of market depth.
Warning signs of insufficient liquidity:
- Bid-ask spread exceeds twice its normal session average
- Order book shows fewer than three price levels with meaningful volume
- Average daily volume falls below 50% of the instrument's 30-day average
- Trading occurs outside major session overlaps
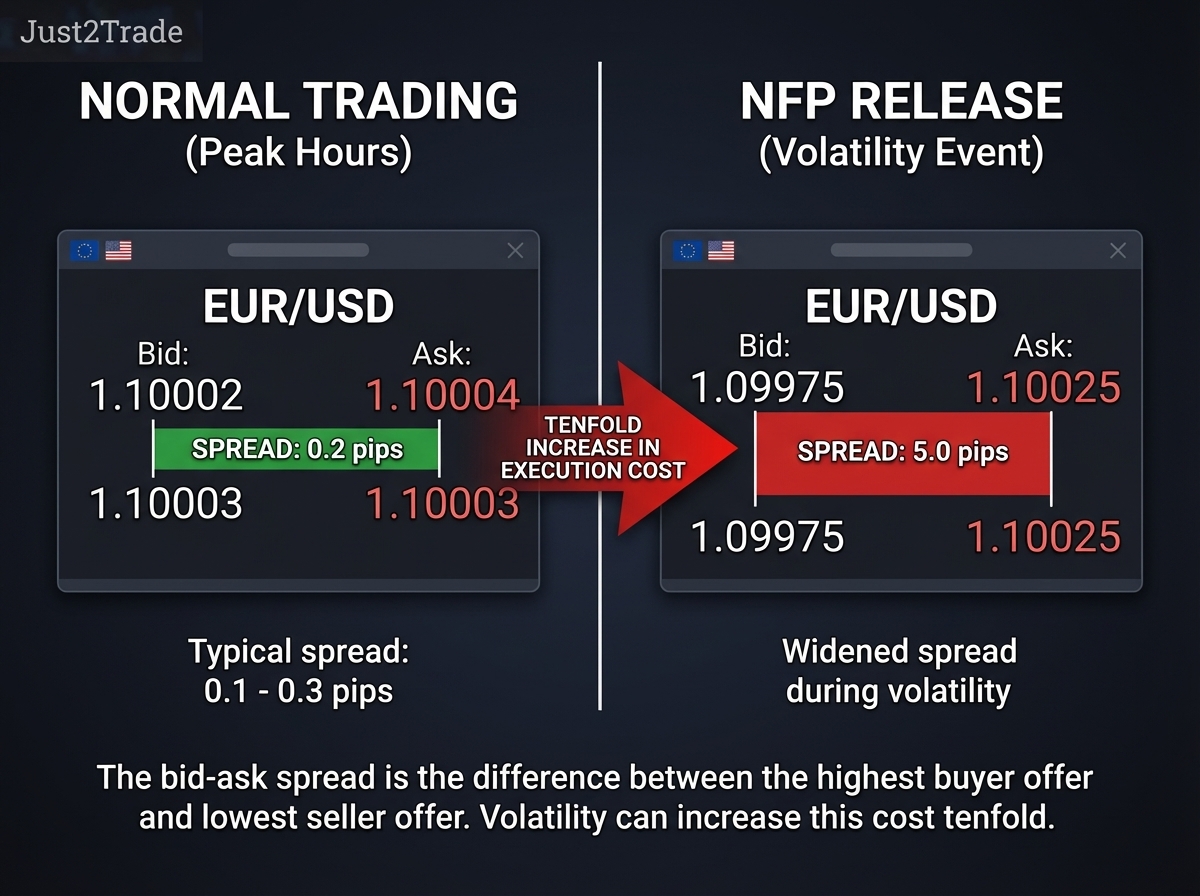
Wide Bid-Ask Spreads and Price Gaps
The bid-ask spread is the difference between the bid price (highest buyer offer) and the ask price (lowest seller offer). EUR/USD typically maintains 0.1 to 0.3 pips during peak hours. During volatility events, the same spread can widen to 3 to 5 pips, increasing minimum execution cost tenfold.
)
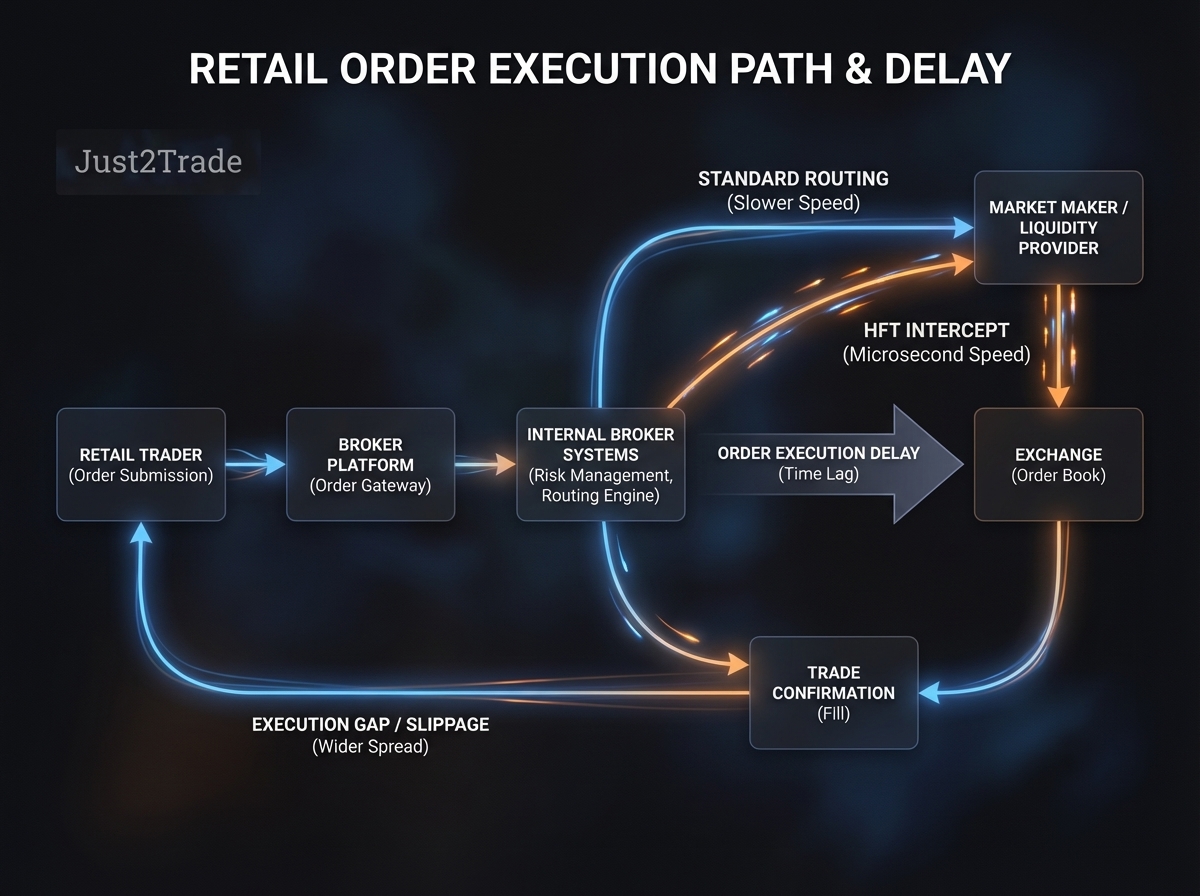
Order Execution Delays and Network Congestion
Order execution delay measures the time between submission and fill. High-Frequency Trading (HFT) firms operate at microsecond speeds, leaving retail traders exposed to wider execution gaps during peak volume.
)
Real-World Slippage Examples
Slippage manifests differently depending on market conditions, instrument type, and order size.
| Market |
Expected Price |
Execution Price |
Slippage |
Cause |
| Forex (EUR/USD) |
1.0850 |
1.0853 |
3 pips |
NFP release caused spread widening |
| Equity (small-cap) |
$12.50 |
$12.67 |
$0.17 (1.36%) |
Thin order book depth |
| Forex (USD/TRY) |
38.250 |
38.310 |
60 pips |
Exotic pair, limited Asian session liquidity |
| Futures (E-mini S&P) |
5,420.00 |
5,420.75 |
0.75 points |
Sell-off after unexpected rate decision |
Catastrophic Slippage: When the Price Gaps Dramatically
Catastrophic slippage occurs during discontinuous price movement where no trading takes place between two levels. The Swiss National Bank's removal of the EUR/CHF floor in January 2015 caused slippage of hundreds of pips on stop-loss orders. Stop-loss orders do not protect against catastrophic gaps because stop-loss orders convert to market orders when triggered. Position sizing and leverage control remain the primary defences.
)
Slippage Across Different Markets
Slippage varies across forex, equity, and futures markets based on liquidity, trading hours, and execution infrastructure. CME Group operates centralised futures exchanges with standardised order books, reducing slippage through transparent market depth.
| Attribute |
Forex |
Stocks |
Futures |
| Typical Slippage |
0.1 to 3 pips (majors) |
$0.01 to $0.50 (large-cap) |
0.25 to 1 tick (liquid contracts) |
| Key Risk Period |
News releases, session gaps |
Market open, earnings |
Contract expiry, circuit breakers |
| Main Mitigation |
Limit orders, peak hours |
Limit orders, liquid stocks |
Limit orders, front-month contracts |
| Liquidity Profile |
Deepest for major pairs |
Deep for blue chips |
Deep on CME standardised contracts |
Slippage in Forex: Currency Pair Considerations
Forex slippage is measured in pips. A pip equals 0.0001 for most pairs and 0.01 for yen pairs. For more on how the forex market operates across global sessions, liquidity dynamics are central to execution quality.
Lowest slippage risk (major pairs):
- EUR/USD, GBP/USD, and USD/JPY maintain the deepest liquidity, with spreads as tight as 0.1 pips during London/New York overlap
- USD/CHF and AUD/USD carry moderately deep liquidity outside major sessions
Highest slippage risk (exotic pairs):
- USD/TRY and EUR/PLN experience significantly higher slippage due to limited market depth
- USD/ZAR carries thin order books outside local session hours
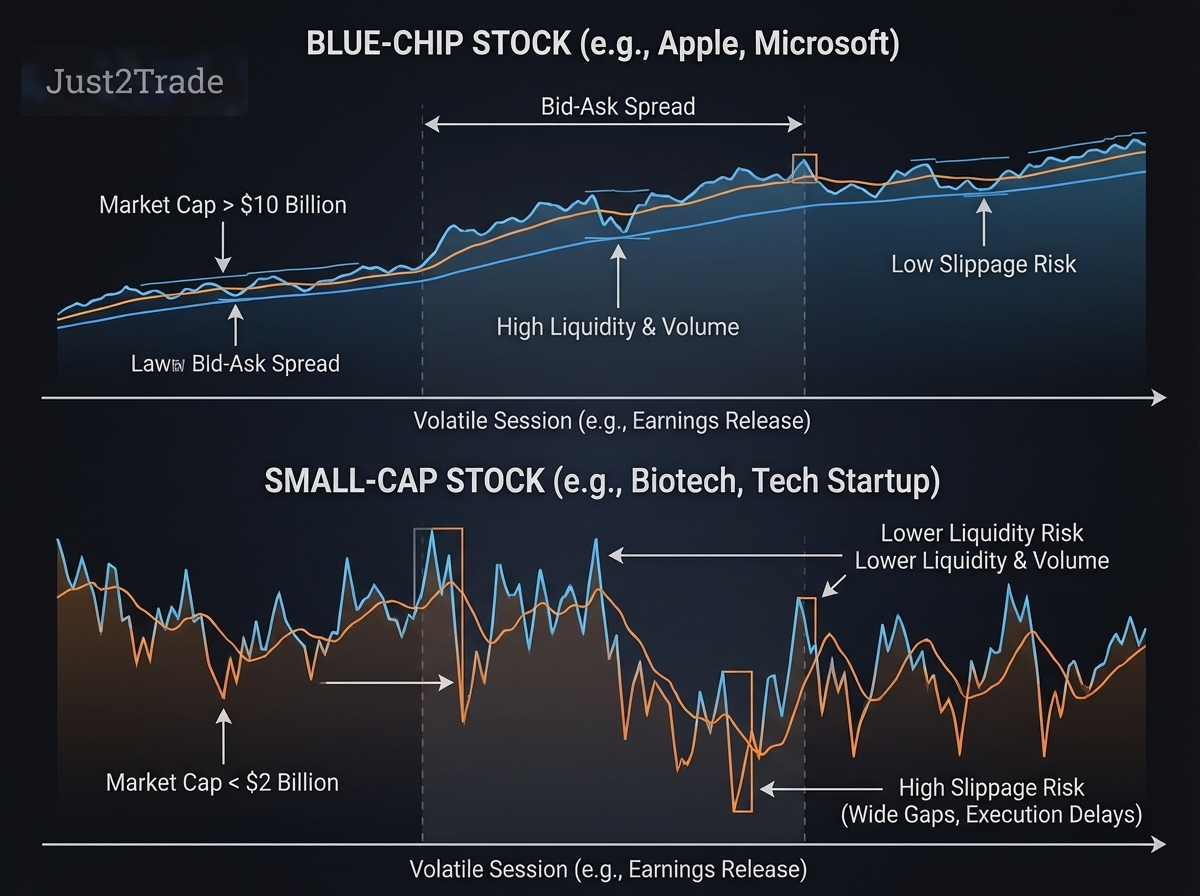
Stock Market Execution: From Blue Chips to Small Caps
Blue-chip stocks with market capitalisations exceeding $10 billion carry low slippage risk due to high daily volume. Small-cap stocks below $2 billion are far more susceptible to slippage, especially during earnings or on large orders relative to average volume.
)
Futures Market Execution: Standardised Contracts and Central Order Books
Futures contracts trade on centralised exchanges such as CME Group, providing standardised sizes and transparent order book depth. E-mini S&P 500 futures carry typical slippage of 0.25 to 1 tick under normal conditions. Slippage increases during contract rollover periods and limit-up/limit-down events. Front-month contracts consistently carry lower slippage than back-month contracts due to higher open interest.
Strategies to Minimise Slippage in Trading
Prevention strategies reduce slippage through order type selection, trade timing, broker evaluation, platform configuration, and risk management discipline. Risk management is the overarching discipline connecting all prevention tactics, because position sizing, stop-loss placement, and leverage control determine the financial impact of any slippage event.
Limit orders serve as the primary prevention tool. Traders who integrate slippage awareness into their broader trading strategies reduce both frequency and severity of adverse fills. These slippage reduction techniques are best suited to active traders executing frequent orders on liquid instruments during standard market hours.
The techniques do not eliminate execution risk during extreme volatility events such as flash crashes, central bank surprises, or gap openings, and do not protect against losses in sharp market movements. The five most effective prevention strategies, ranked by impact:
- Use limit orders instead of market orders for all non-urgent entries and exits
- Trade during peak liquidity windows such as the London/New York overlap (1:00 p.m. to 5:00 p.m. GMT)
- Evaluate broker execution quality by comparing fill speed, slippage distribution, and order routing transparency
- Configure slippage tolerance settings to reject orders exceeding maximum acceptable deviation
- Reduce position size during high-volatility events to limit financial impact of unavoidable slippage
Order Types That Protect Against Slippage
| Order Type |
Slippage Risk |
Price Control |
Fill Certainty |
Best Use Case |
| Market Order |
Highest |
None |
Guaranteed |
Urgent execution |
| Limit Order |
Near zero |
Full |
Not guaranteed |
Price-sensitive entries |
| Stop-Limit Order |
Low |
Partial |
Not guaranteed |
Controlled stops |
| GSLO |
Zero |
Full |
Guaranteed |
Maximum protection |
Guaranteed Stop-Loss Orders (GSLOs) execute at the exact specified price regardless of market conditions, typically for an additional premium.
Timing Your Trades for Minimal Slippage
The London/New York session overlap (1:00 p.m. to 5:00 p.m. GMT) offers the deepest forex liquidity. Equity markets carry the tightest spreads after the first 15 minutes following the opening bell. Avoiding execution during scheduled economic releases reduces volatility-driven slippage.
)
Broker Selection: Finding Partners That Minimise Slippage
ECN brokers connect traders directly to interbank liquidity, delivering tighter spreads than market makers.
- Execution speed: average fill time in milliseconds
- Slippage distribution: percentage of orders receiving positive, negative, or zero slippage
- Order routing: dealing desk vs. direct liquidity provider access
- Regulatory compliance: FCA or ESMA oversight confirming best execution standards
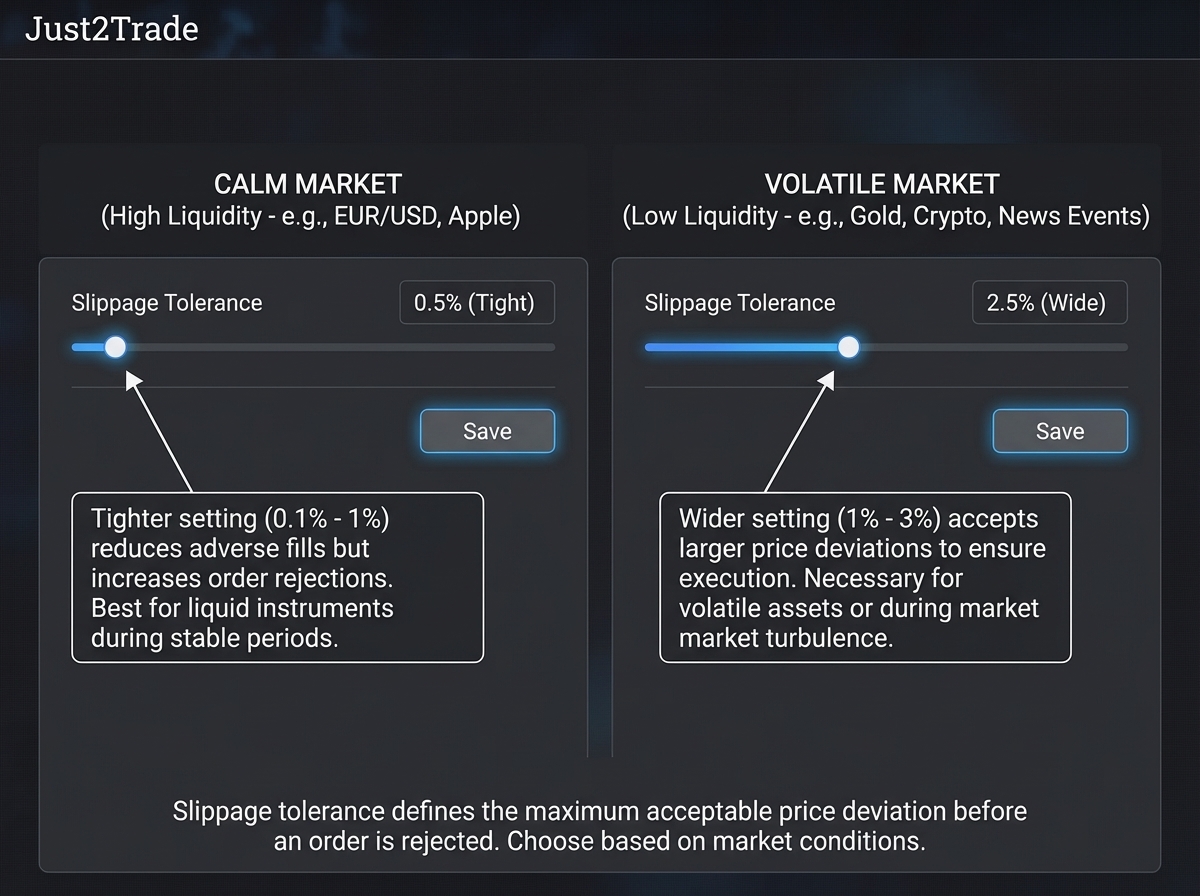
Slippage Tolerance Settings and How to Use Them
Slippage tolerance defines the maximum acceptable price deviation before an order is rejected. Standard tolerance ranges from 0.1% to 1% for liquid instruments and 1% to 3% for volatile assets. Tighter settings reduce adverse fills but increase order rejections.
)
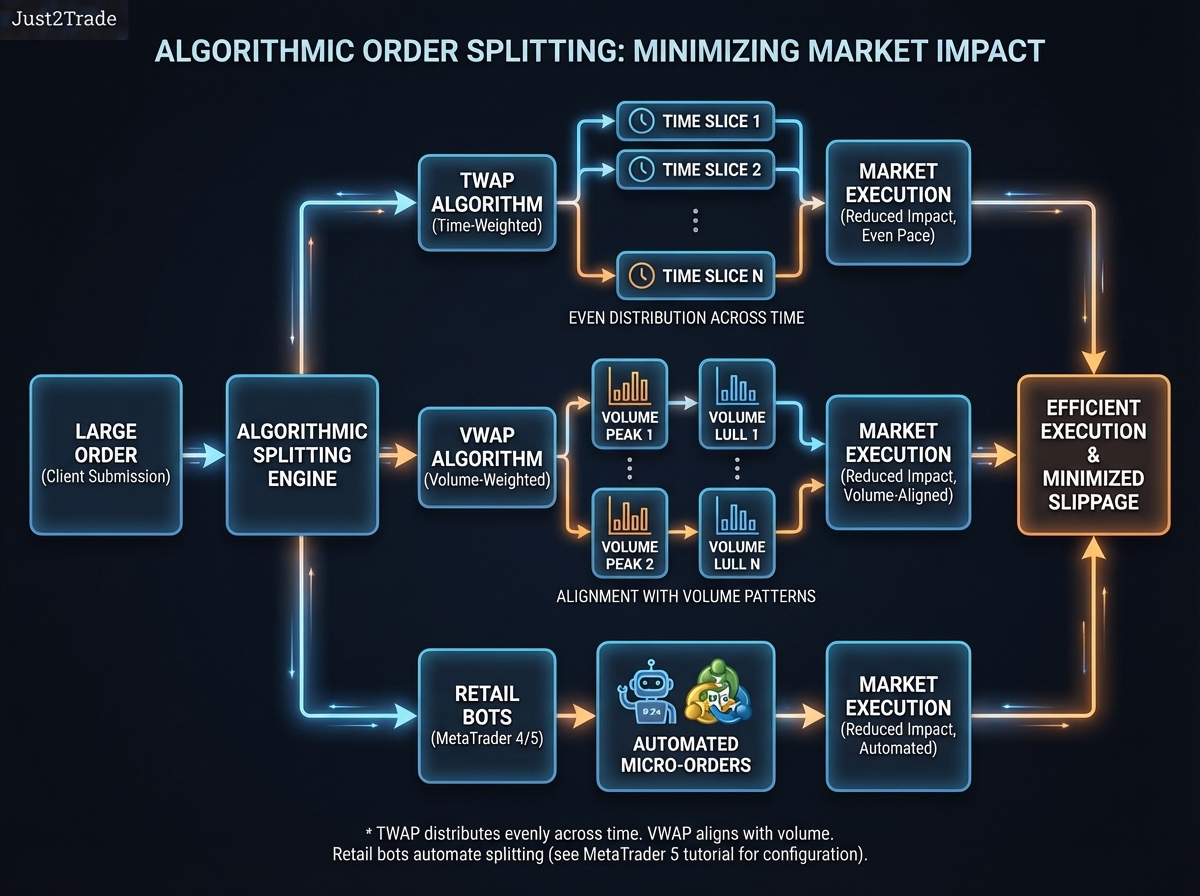
Trading Algorithms and Bots to Reduce Slippage
TWAP algorithms distribute execution evenly across time. VWAP algorithms align execution with volume patterns. Retail bots on MetaTrader 4 and MetaTrader 5 automate order splitting (see our MetaTrader 5 tutorial for configuration guidance).
)
Calculating and Monitoring Slippage
Slippage calculation is a performance metric quantifying the difference between expected and actual execution prices. Trading analytics tools track slippage data systematically across time, instruments, and brokers.
Performance metrics such as average slippage per instrument, fill rate percentage, slippage distribution by session, and per-broker execution scores reveal patterns invisible in individual trade reviews.
Systematic tracking enables portfolio-level pattern recognition, identifying whether poor execution concentrates at certain times, on certain instruments, or through specific routing paths.
How to Calculate Slippage (with Formula)
Slippage calculation measures price deviation using two formulas:
Absolute Slippage = Execution Price minus Expected Price
Slippage Percentage = ((Execution Price minus Expected Price) / Expected Price) x 100
Worked example: A buy order on EUR/USD at 1.0850 fills at 1.0853. Absolute slippage equals 3 pips. Slippage percentage equals 0.028%. Consistent slippage above 0.05% on major pairs may indicate poor execution quality. Compare metrics across 50 to 100 trades for meaningful benchmarks.
FAQ
-
What is slippage?
Slippage is the difference between a trade's expected execution price and the actual fill price. Slippage occurs during high-volatility and low-liquidity conditions. Both positive slippage (price improvement) and negative slippage (adverse fill) can result.
-
What are the common causes of slippage?
Market volatility, low liquidity, wide bid-ask spreads, execution delays, and large order sizes cause slippage. Central bank announcements produce the highest-frequency slippage events.
-
How can retail investors reduce slippage?
Limit orders, peak-hour trading, and slippage tolerance settings reduce slippage exposure. Choosing an ECN broker with transparent execution statistics provides further protection.
-
Can you provide an example of slippage?
A buy order on EUR/USD at 1.0850 fills at 1.0853 due to spread widening. The 3-pip negative slippage costs approximately $30 on a standard lot (100,000 units).
-
What is positive vs. negative slippage?
Positive slippage fills at a better price, reducing costs. Negative slippage fills at a worse price, increasing costs. Negative slippage is more common during volatile conditions.
-
How do limit orders help manage slippage?
Limit orders execute only at the specified price or better, eliminating negative slippage. The trade-off: limit orders may not fill if the market never reaches the target price.
-
How do extreme slippage percentages (e.g. 10% or 100%) occur?
Extreme slippage occurs when order size vastly exceeds available liquidity. A large market order against a shallow order book forces fills at progressively worse levels. Flash crashes amplify extreme slippage by removing resting orders across multiple price levels.
-
How do you calculate slippage?
Absolute slippage equals execution price minus expected price. Percentage slippage equals ((execution price minus expected price) / expected price) x 100.
-
What are the risks of slippage?
Slippage increases transaction costs, triggers unintended stop-loss executions, and reduces returns. Catastrophic slippage during gap events can produce losses exceeding 10% of position value.
-
What is slippage tolerance?
Slippage tolerance is a platform setting defining maximum acceptable price deviation. Orders exceeding the threshold are rejected. Standard settings range from 0.1% to 1% for liquid assets.
Trading on financial markets carries risks. The value of the investments can both increase and decrease and the investors may lose all their investment capital. In case of a leveraged product, the loss may be more than the initial capital invested. Detailed information on risks associated with trading on financial markets can be found in General Terms and Conditions for the Provision of Investment Services.