Platinum Price Forecast: Expert Analysis and Investment Targets 2026-2030

Table of Contents
Current Platinum Market Fundamentals in 2026
Short-Term Platinum Price Forecast 2027
Medium-Term Platinum Price Outlook 2028-2029
Long-Term Platinum Price Predictions 2030 and Beyond
Investment Strategies for Platinum in Different Market Scenarios
CME Platinum Futures Forecast: Technical Analysis and Trading Strategies
Platinum Market Self-Correction Mechanisms
Risks and Variables That Could Alter These Forecasts
Conclusion: Final Thoughts on Platinum's Price Trajectory
Frequently Asked Questions
Platinum faces a structural supply deficit exceeding 1 million ounces annually—a fundamental market imbalance that positions this precious metal for significant price appreciation through 2030. This comprehensive price forecast combines supply-demand fundamentals, technical analysis, and macroeconomic trends to provide specific investment targets for 2027-2030.
Key Takeaways:
- 2027 Target: Platinum prices projected to reach $1,700-$1,800/oz as structural deficits persist
- 2030 Outlook: Long-term price targets of $1,900-$2,000/oz driven by sustained supply constraints
- Investment Case: Current supply deficits create compelling risk-reward opportunity for strategic accumulation
- Critical Factors: Automotive demand recovery and inventory depletion accelerate upside potential
- Strategic Positioning: Platinum offers strongest upside among precious metals given current valuation gap
Current Platinum Market Fundamentals in 2026
Platinum market fundamentals reveal a persistent structural deficit driven by supply constraints and recovering demand. The World Platinum Investment Council (WPIC) projects a supply-demand gap exceeding 1 million ounces in 2026, with above-ground inventories depleting to critically low levels not seen since 2015.
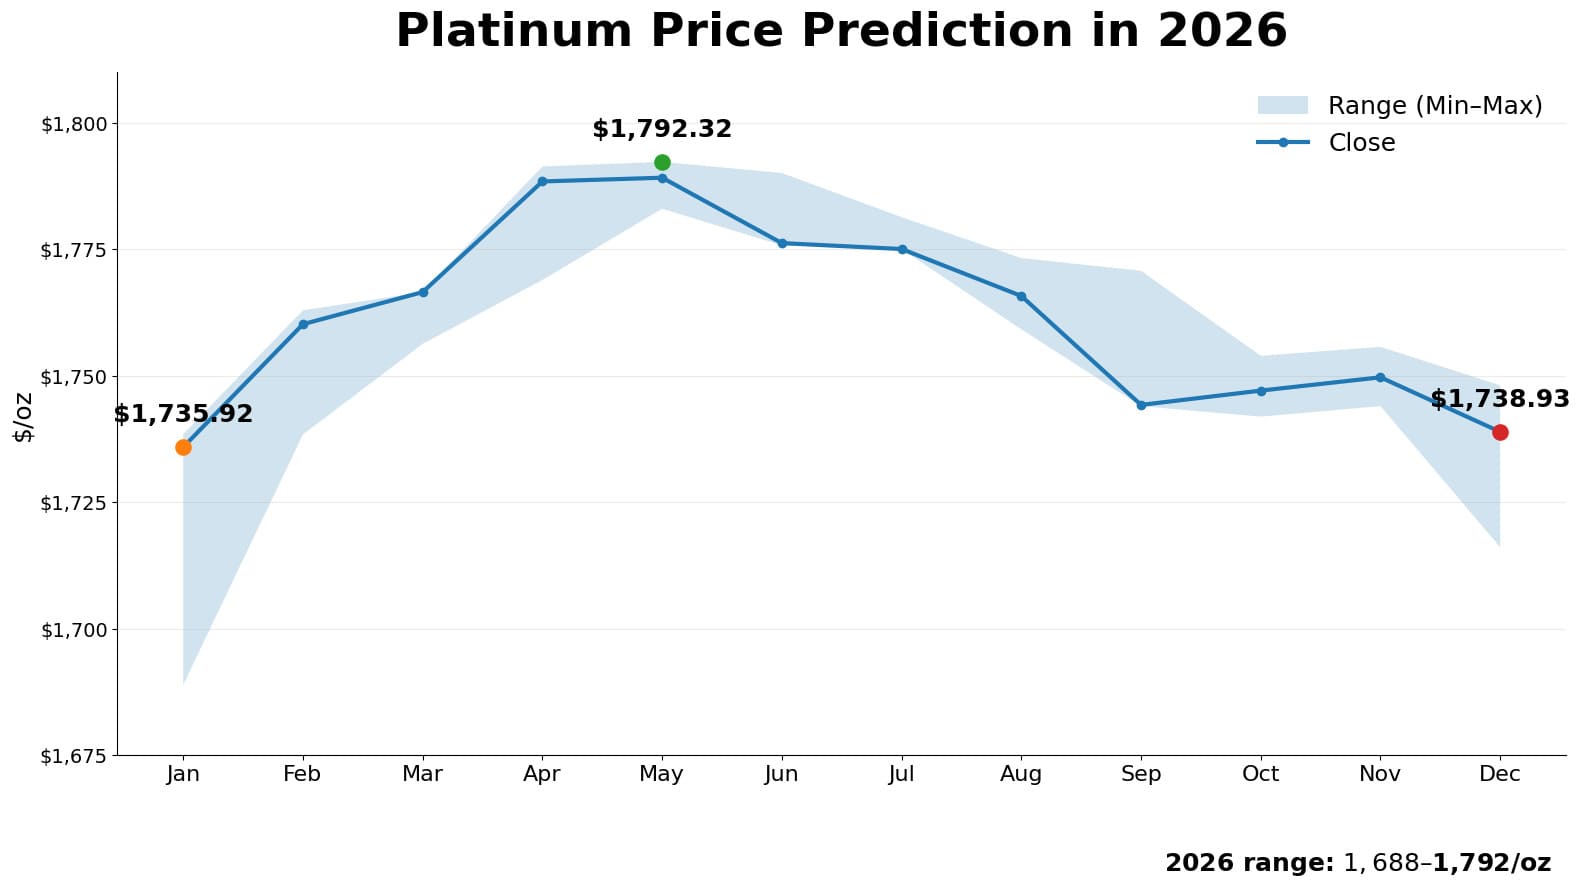 Platinum price prediction in 2026
Supply constraints stem from reduced South African production and limited new mine development, while automotive demand strengthens as hydrogen fuel cell technology adoption accelerates. These market dynamics create upward price pressure, with platinum trading between $1,688-$1,792 per ounce throughout 2026. The structural deficit represents a fundamental shift from historical oversupply conditions, establishing the foundation for sustained price appreciation.
| Month |
Opening Price |
Closing Price |
Minimum Price |
Maximum Price |
Monthly Change |
| January 2026 |
$1,688.94 |
$1,735.92 |
$1,688.94 |
$1,738.48 |
+2.71% |
| February 2026 |
$1,738.42 |
$1,760.22 |
$1,738.42 |
$1,762.97 |
+1.24% |
| March 2026 |
$1,761.29 |
$1,766.57 |
$1,756.33 |
$1,766.57 |
+0.30% |
| April 2026 |
$1,768.96 |
$1,788.44 |
$1,768.96 |
$1,791.41 |
+1.09% |
| May 2026 |
$1,784.90 |
$1,789.18 |
$1,783.05 |
$1,792.32 |
+0.24% |
| June 2026 |
$1,789.16 |
$1,776.25 |
$1,775.80 |
$1,790.11 |
-0.73% |
| July 2026 |
$1,777.19 |
$1,775.08 |
$1,775.08 |
$1,781.38 |
-0.12% |
| August 2026 |
$1,773.30 |
$1,765.80 |
$1,759.20 |
$1,773.30 |
-0.43% |
| September 2026 |
$1,766.45 |
$1,744.26 |
$1,744.01 |
$1,770.78 |
-1.27% |
| October 2026 |
$1,745.31 |
$1,747.09 |
$1,741.94 |
$1,753.98 |
+0.10% |
| November 2026 |
$1,746.02 |
$1,749.72 |
$1,744.02 |
$1,755.74 |
+0.21% |
| December 2026 |
$1,748.14 |
$1,738.93 |
$1,716.12 |
$1,748.14 |
-0.53% |
Historical Forecasts and Their Accuracy
Historical platinum forecasts demonstrate mixed prediction accuracy, revealing the complexity of commodity price forecasting. Reuters and other analysts consistently underestimated platinum's volatility in 2024, with most projections anticipating stable prices around $950-$1,000 per ounce. The actual price trajectory showed significant divergence—January 2024 opened at $918 but experienced unexpected weakness, declining to $876 in February before recovering.
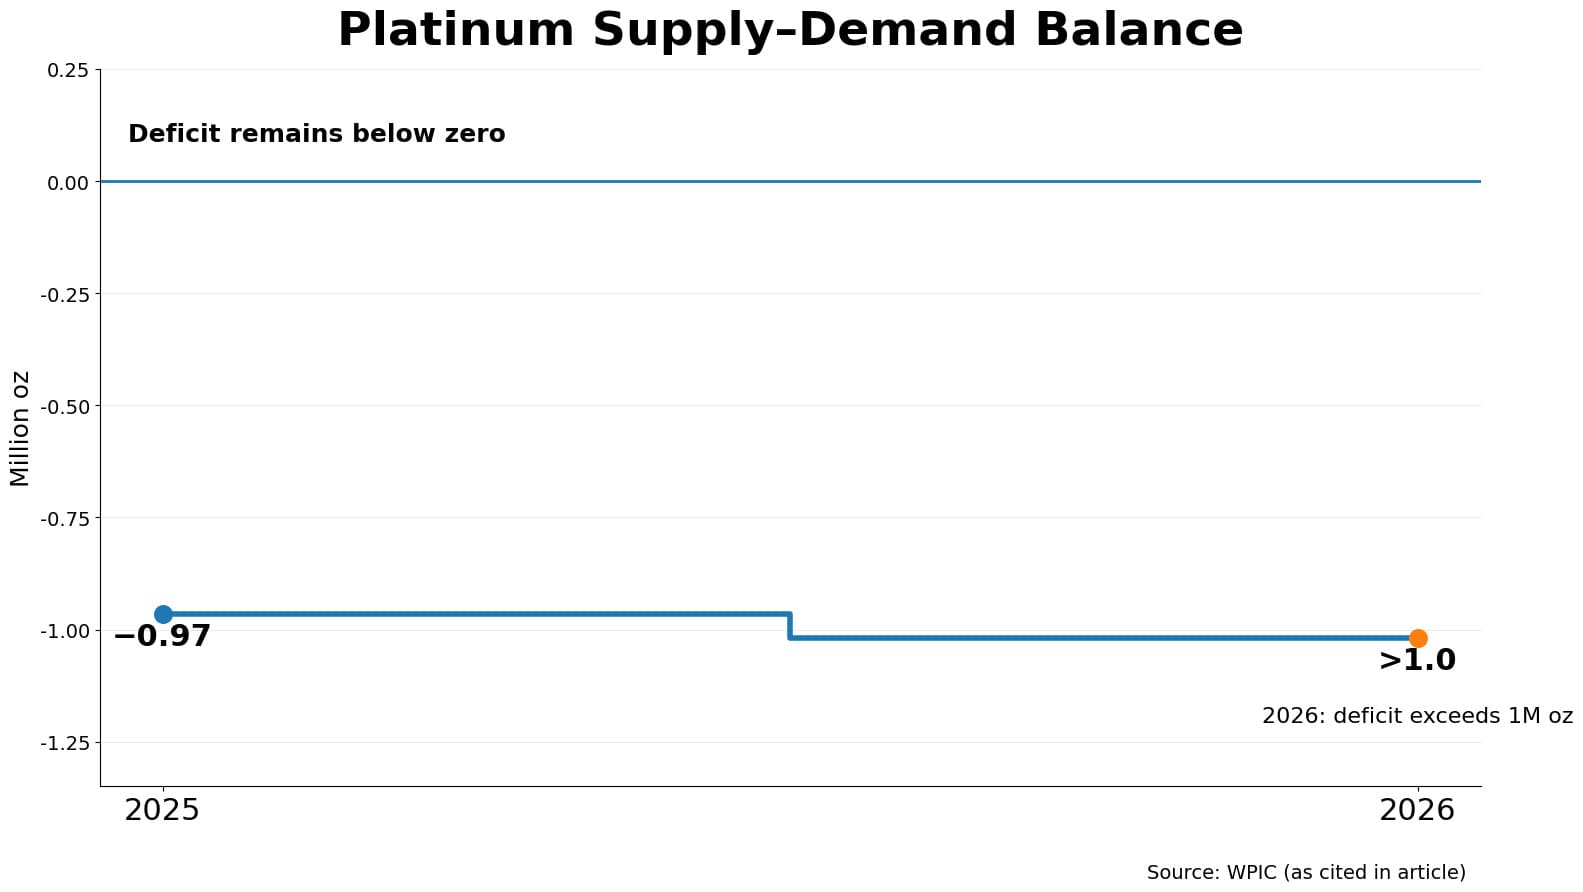
Platinum's supply-demand gap from 2025
The June 2025 surge to $1,357 represented the most significant forecast miss, as analysts failed to anticipate the 28% monthly gain driven by supply disruptions and surging investment demand. Price forecasting methodology has evolved to incorporate supply chain vulnerabilities and inventory depletion rates more explicitly. The 2024-2025 period highlighted that traditional supply-demand models require adjustment for above-ground stock dynamics and geopolitical supply risks from South Africa and Russia.
| Month |
Analyst Consensus Forecast |
Actual Price |
Deviation |
Forecast Assessment |
| Jan 2024 |
$980–1,050 |
$918 |
-6.3% to -12.6% |
Overestimated |
| Feb 2024 |
$970–1,040 |
$876 |
-9.7% to -15.8% |
Significant miss |
| Mar 2024 |
$990–1,060 |
$908 |
-8.3% to -14.3% |
Continued overestimation |
| Apr 2024 |
$1,000–1,070 |
$934 |
-6.6% to -12.7% |
Moderating error |
| May 2024 |
$1,020–1,090 |
$1,038 |
+1.8% to -4.8% |
Approaching accuracy |
| Jun 2024 |
$1,030–1,100 |
$993 |
-3.6% to -9.7% |
Slight overestimation |
| Jul 2024 |
$1,010–1,080 |
$976 |
-3.4% to -9.6% |
Modest miss |
| Aug 2024 |
$1,000–1,070 |
$926 |
-7.4% to -13.5% |
Renewed gap |
| Sep 2024 |
$1,010–1,080 |
$976 |
-3.4% to -9.6% |
Persistent optimism |
| Oct 2024 |
$1,020–1,090 |
$988 |
-3.1% to -9.4% |
Stable deviation |
| Nov 2024 |
$1,030–1,100 |
$946 |
-8.2% to -14.0% |
Widening gap |
| Dec 2024 |
$1,040–1,110 |
$904 |
-13.1% to -18.6% |
Year-end miss |
| Jan 2025 |
$1,050–1,120 |
$984 |
-6.3% to -12.1% |
Overoptimistic start |
| Feb 2025 |
$1,060–1,130 |
$951 |
-10.3% to -15.8% |
Continued overestimate |
| Mar 2025 |
$1,070–1,140 |
$998 |
-6.7% to -12.5% |
Persistent gap |
| Apr 2025 |
$1,080–1,150 |
$972 |
-10.0% to -15.5% |
Forecast error widens |
| May 2025 |
$1,090–1,160 |
$1,060 |
-2.8% to -8.6% |
Improving accuracy |
| Jun 2025 |
$1,000–1,100 |
$1,357 |
+23.4% to +35.7% |
Major upside surprise |
| Jul 2025 |
$1,150–1,250 |
$1,293 |
+3.4% to +12.4% |
Rapid forecast revision |
| Aug 2025 |
$1,200–1,300 |
$1,368 |
+5.2% to +14.0% |
Still underestimating |
| Sep 2025 |
$1,250–1,350 |
$1,578 |
+16.9% to +26.2% |
Missed continued rally |
| Oct 2025 |
$1,300–1,400 |
$1,572 |
+13.2% to +20.9% |
Catching up slowly |
| Nov 2025 |
$1,350–1,450 |
$1,675 |
+15.5% to +24.1% |
Sustained underestimate |
| Dec 2025 |
$1,400–1,500 |
$1,726 |
+15.1% to +23.3% |
Year-end gap remains |
Short-Term Platinum Price Forecast 2027
Short-term platinum price forecasts for 2027 indicate gradual appreciation toward $1,800-$1,850 per ounce, driven by persistent supply deficits and strengthening automotive demand. Price forecasting methodology combines technical analysis of moving averages with fundamental supply-demand modeling from Reuters and WalletInvestor projections. Key inflection points include Q1 momentum as investment flows accelerate, mid-year consolidation as recycling volumes respond to elevated prices, and Q4 weakness reflecting seasonal patterns.
The 2027 trajectory represents a critical transition phase where platinum tests resistance levels near $1,845 before potential retracement. Market sentiment remains cautiously optimistic, with technical indicators including RSI and MACD suggesting moderate upside potential tempered by profit-taking pressures. Supply constraints from South African production disruptions provide fundamental support, while demand recovery in hydrogen fuel cell applications strengthens the long-term investment case.
Key 2027 Price Targets and Timeframes:
- Q1 2027 Target: $1,740-$1,820 - Post-holiday rally and investment demand surge
- Q2 Peak: $1,843-$1,846 - Testing resistance at yearly high in May
- Mid-Year Correction: $1,800-$1,830 - Seasonal weakness and profit-taking
- Q3 Consolidation: $1,795-$1,830 - Range-bound trading as market digests gains
- Q4 Projection: $1,770-$1,805 - Year-end positioning and inventory adjustments
| Month |
Opening Price |
Closing Price |
Minimum Price |
Maximum Price |
Monthly Change |
| January 2027 |
$1,738.95 |
$1,789.15 |
$1,738.95 |
$1,791.74 |
+2.81% |
| February 2027 |
$1,791.49 |
$1,813.68 |
$1,791.49 |
$1,816.31 |
+1.22% |
| March 2027 |
$1,815.11 |
$1,820.98 |
$1,810.01 |
$1,820.98 |
+0.32% |
| April 2027 |
$1,823.98 |
$1,839.36 |
$1,822.44 |
$1,845.49 |
+0.84% |
| May 2027 |
$1,838.74 |
$1,843.42 |
$1,836.99 |
$1,846.16 |
+0.25% |
| June 2027 |
$1,843.01 |
$1,831.02 |
$1,829.83 |
$1,844.63 |
-0.66% |
| July 2027 |
$1,832.58 |
$1,829.79 |
$1,829.56 |
$1,835.34 |
-0.15% |
| August 2027 |
$1,828.28 |
$1,819.37 |
$1,813.03 |
$1,828.28 |
-0.49% |
| September 2027 |
$1,821.04 |
$1,799.80 |
$1,798.94 |
$1,825.12 |
-1.18% |
| October 2027 |
$1,796.21 |
$1,801.77 |
$1,796.21 |
$1,807.90 |
+0.31% |
| November 2027 |
$1,800.58 |
$1,803.82 |
$1,798.09 |
$1,810.01 |
+0.18% |
| December 2027 |
$1,803.30 |
$1,788.97 |
$1,770.36 |
$1,803.30 |
-0.80% |
Medium-Term Platinum Price Outlook 2028-2029
Medium-term platinum price forecasts project continued appreciation toward $1,850-$1,950 per ounce through 2028-2029, supported by structural supply-demand imbalances and automotive industry transformation. Supply and demand dynamics favor platinum as South African production remains constrained while global hydrogen fuel cell vehicle adoption accelerates, particularly in commercial transport sectors.
The automotive industry represents the critical demand driver, with platinum catalyst loadings increasing as emission standards tighten globally. Interest rate normalization during this period supports precious metals investment demand, with lower rates reducing opportunity costs for non-yielding assets. Production cycle analysis suggests limited new mine capacity additions through 2029, maintaining supply constraints. Technological developments in hydrogen infrastructure create additional platinum demand channels beyond traditional automotive applications.
This 2028-2029 period represents a pivotal phase where platinum transitions from undervalued industrial metal to recognized strategic commodity, positioning early investors for substantial appreciation.
| Month |
Opening Price |
Closing Price |
Minimum Price |
Maximum Price |
Monthly Change |
| 2028 |
| January 2028 | $1,799.11 | $1,844.63 | $1,799.11 | $1,845.02 | +2.47% |
| February 2028 | $1,845.10 | $1,868.85 | $1,845.10 | $1,869.49 | +1.27% |
| March 2028 | $1,869.83 | $1,874.41 | $1,863.86 | $1,876.02 | +0.24% |
| April 2028 | $1,879.79 | $1,893.85 | $1,879.79 | $1,899.41 | +0.74% |
| May 2028 | $1,893.12 | $1,897.87 | $1,891.05 | $1,899.88 | +0.25% |
| June 2028 | $1,899.04 | $1,883.37 | $1,883.37 | $1,899.04 | -0.83% |
| July 2028 | $1,884.29 | $1,883.15 | $1,883.15 | $1,889.21 | -0.06% |
| August 2028 | $1,882.26 | $1,876.25 | $1,867.07 | $1,882.90 | -0.32% |
| September 2028 | $1,873.92 | $1,850.76 | $1,850.76 | $1,879.20 | -1.25% |
| October 2028 | $1,850.30 | $1,854.49 | $1,850.17 | $1,861.62 | +0.23% |
| November 2028 | $1,854.82 | $1,859.07 | $1,852.35 | $1,863.95 | +0.23% |
| December 2028 | $1,854.43 | $1,839.18 | $1,824.11 | $1,854.43 | -0.83% |
| 2029 |
| January 2029 | $1,848.97 | $1,899.73 | $1,848.97 | $1,899.73 | +2.67% |
| February 2029 | $1,901.87 | $1,923.59 | $1,899.47 | $1,923.59 | +1.13% |
| March 2029 | $1,925.22 | $1,926.47 | $1,917.86 | $1,928.19 | +0.07% |
| April 2029 | $1,931.67 | $1,947.56 | $1,931.67 | $1,953.15 | +0.82% |
| May 2029 | $1,946.99 | $1,953.35 | $1,945.03 | $1,953.47 | +0.33% |
| June 2029 | $1,949.94 | $1,937.21 | $1,937.21 | $1,949.94 | -0.66% |
| July 2029 | $1,938.04 | $1,937.10 | $1,937.10 | $1,943.01 | -0.05% |
| August 2029 | $1,937.24 | $1,926.86 | $1,921.31 | $1,937.92 | -0.54% |
| September 2029 | $1,929.59 | $1,905.59 | $1,905.59 | $1,933.00 | -1.26% |
| October 2029 | $1,904.46 | $1,909.42 | $1,903.74 | $1,915.14 | +0.26% |
| November 2029 | $1,910.36 | $1,910.24 | $1,905.99 | $1,917.58 | -0.01% |
| December 2029 | $1,905.79 | $1,898.93 | $1,877.89 | $1,905.79 | -0.36% |
Long-Term Platinum Price Predictions 2030 and Beyond
Long-term platinum price predictions through 2030 and beyond suggest significant appreciation potential, with prices reaching $1,950-$2,000 per ounce by 2030 and potentially $4,000 by 2034 under favorable scenarios. Structural supply-demand fundamentals support this outlook as global platinum resources become increasingly scarce, with South African reserves—representing 95% of global deposits—facing geological constraints and resource nationalism pressures. Precious metal comparisons reveal platinum's persistent undervaluation relative to gold, trading at a 50-60% discount despite superior industrial utility and rarer occurrence.
Technological developments in hydrogen economy infrastructure create substantial new demand channels, with fuel cell applications requiring 30-60 grams of platinum per vehicle versus 2-7 grams in traditional catalytic converters. Macroeconomic trends favoring green energy transition position platinum as a strategic commodity for decarbonization efforts. The pathway to $4,000 by 2034 requires sustained supply deficits averaging 800,000+ ounces annually combined with hydrogen vehicle production reaching 5-10 million units globally, scenarios increasingly supported by government policy frameworks worldwide.
| Quarter |
Opening Price |
Closing Price |
Price Range (Low–High) |
Quarterly Change |
Key Drivers |
| Q1 2030 |
$1,901.94 |
$1,978.66 |
$1,901.94 – $1,980.49 |
+4.03% |
Post-2029 momentum, investment flows |
| Q2 2030 |
$1,983.60 |
$2,004.22 |
$1,983.60 – $2,007.53 |
+1.29% |
Peak demand, supply constraints |
| Q3 2030 |
$2,003.75 |
$1,979.75 |
$1,958.90 – $2,004.35 |
-1.20% |
Mid-year profit-taking, seasonal weakness |
| Q4 2030 |
$1,982.70 |
$1,953.01 |
$1,953.01 – $1,970.95 |
-1.50% |
Year-end positioning, inventory adjustments |
Platinum Prediction 2031-2035: Extended Price Trajectory
Extended platinum price projections through 2031-2035 anticipate sustained appreciation toward $2,500-$4,000 per ounce as hydrogen economy adoption accelerates globally. Price forecasting methodology for this extended timeframe combines long-term supply depletion models with demand growth scenarios from automotive electrification and industrial applications. Investment considerations favor platinum as a strategic holding, with potential cycle peaks emerging around 2033-2034 when supply deficits reach critical thresholds and above-ground inventories deplete completely.
 Platinum Prediction 2031-2035
Key influential factors include hydrogen fuel cell vehicle production scaling to 10+ million units annually, South African mining output declining 15-20% from current levels, and industrial demand from electronics and medical sectors expanding 30-40%. The 2031-2035 period represents the inflection point where platinum transitions from undervalued industrial metal to premium strategic commodity, rewarding patient long-term investors substantially.
| Year |
Projected Price Range |
Mid-Point Target |
Year-over-Year Change |
Change from 2030 |
| 2030 |
$1,900 – $2,000 |
$1,950 |
Baseline |
— |
| 2031 |
$2,100 – $2,300 |
$2,200 |
+12.8% |
+12.8% |
| 2032 |
$2,400 – $2,700 |
$2,550 |
+15.9% |
+30.8% |
| 2033 |
$2,800 – $3,200 |
$3,000 |
+17.6% |
+53.8% |
| 2034 |
$3,400 – $4,200 |
$3,800 |
+26.7% |
+94.9% |
| 2035 |
$3,600 – $4,400 |
$4,000 |
+5.3% |
+105.1% |
Investment Strategies for Platinum in Different Market Scenarios
Investment strategies for platinum vary across investor profiles, with multiple vehicles offering distinct risk-reward characteristics. Conservative investors should allocate 5-10% to physical platinum or ETFs like PPLT, providing direct exposure with minimal counterparty risk. Moderate investors can combine 60% physical holdings with 40% mining equities such as Anglo American Platinum, capturing operational leverage. Aggressive investors may utilize futures for 2-3x leverage, requiring active management. The strengthening investment case stems from automotive industry resilience through hydrogen fuel cell adoption, Chinese demand recovery, and expanding industrial applications. Precious metal diversification benefits from platinum's low 0.65 correlation with gold, enhancing risk-adjusted portfolio returns across market scenarios.
| Investment Vehicle |
Minimum Investment |
Liquidity |
Annual Costs |
Upside Leverage |
Key Advantages |
Main Disadvantages |
| Physical Bullion |
$1,000–$2,000 |
Low |
Storage: 0.5–1.5% |
1:1 |
Direct ownership, no counterparty risk, tangible asset |
Storage costs, insurance, security concerns, low liquidity |
| Platinum ETFs (PPLT) |
$100+ |
High |
Expense ratio: 0.60% |
1:1 |
High liquidity, low entry barrier, regulated |
Annual fees, no physical possession, tracking error |
| Mining Stocks |
$500+ |
High |
Trading fees only |
2–3:1 |
Operational leverage, dividend potential, equity upside |
Company-specific risks, operational issues, management quality |
| Platinum Futures |
$5,000+ |
Very High |
Margin interest varies |
3–5:1 |
Maximum leverage, active trading, price discovery |
High risk, margin calls, contract rollover costs, expertise required |
| Mining ETFs (XPT) |
$100+ |
High |
Expense ratio: 0.65–0.85% |
1.5–2:1 |
Diversification, sector exposure, liquidity |
Diluted returns, management fees, basket approach |
| Royalty Companies |
$1,000+ |
Medium–High |
Trading fees only |
1.5–2.5:1 |
Production growth exposure, lower operational risk |
Limited pure platinum exposure, premium valuations |
Physical Platinum vs. Sylvania Platinum Share Price Forecast
Physical platinum investment provides 1:1 price exposure with zero operational risk, while Sylvania Platinum shares offer amplified leverage to platinum prices through operational performance. Sylvania Platinum achieved record production of 81,002 4E PGM ounces in FY2025 with all-in sustaining costs of $938/oz, demonstrating efficient operations in South Africa's challenging mining environment.
Current analyst consensus targets 112.54 GBX per share, representing 29% upside from recent trading levels near 87 GBX, with Berenberg Bank maintaining a "Buy" rating at 109 GBX. The company's FY2026 production guidance of 83,000-86,000 ounces positions it for continued growth, particularly as the Thaba Joint Venture ramps production. Physical metal proves superior during mining sector volatility or operational disruptions, while mining equities like Sylvania outperform during sustained platinum bull markets when operational leverage amplifies gains through margin expansion at current low-cost production levels.
Factors to Consider: Physical Platinum vs. Mining Equities
- Price Leverage: Physical platinum = 1:1 exposure; Mining stocks = 2-3x operational gearing as profit margins expand with rising metal prices
- Operational Risk: Physical metal has zero company risk; Equities face production disruptions, management decisions, labor issues in South Africa
- Cost Structure: Physical storage costs 0.5-1.5% annually; Sylvania's AISC of $938/oz creates substantial margin potential at current platinum prices
- Dividend Potential: Physical platinum generates no income; Sylvania distributed 2p per share dividends with forward yield ~2.7%
- Liquidity Profile: Physical sales involve dealer spreads (3-5%); Sylvania trades on AIM with reasonable liquidity for retail investors
- Jurisdictional Risk: Physical metal portable across borders; South African miners face regulatory, political infrastructure risks and rand volatility
- Tax Treatment: Physical gains taxed as collectibles (28% US); Mining stocks taxed as capital gains (15-20% US long-term)
- Market Timing: Physical suits buy-and-hold strategies; Mining stocks require monitoring quarterly production reports and basket price changes
- Margin Expansion: Physical value limited to metal price; Sylvania benefits from fixed-cost leverage—each $100/oz platinum increase expands margins significantly
- Downside Protection: Physical preserves capital in downturns; Mining stocks declined 50%+ during 2022-2023 platinum bear market but recovered strongly
Platinum vs. Other Precious Metals
Platinum offers superior upside potential among precious metals, trading at a 50-60% discount to gold despite comparable rarity. According to WPIC's Q1 2025 Platinum Quarterly, platinum's 966,000 ounce supply deficit contrasts with gold's balanced market, creating stronger fundamental support.
Metals Focus data shows platinum benefits from dual demand drivers—automotive (38%) plus hydrogen fuel cells—while palladium's 80% automotive concentration creates vulnerability as EV adoption accelerates. The Silver Institute's 2025 Survey reports silver's 59% industrial demand from electronics and solar positions it between platinum's industrial focus and gold's investment orientation (40-45% investment demand per World Gold Council).
| Metric |
Platinum |
Gold |
Palladium |
Silver |
| Supply / Demand Balance (2025) |
Deficit −966,000 oz |
Balanced market |
Deficit −367,000 oz
(shifting to surplus 2026) |
Deficit −117,600,000 oz |
| Industrial Demand |
24%
(automotive 38%, industrial apps 24%, total 62%) |
6–10%
(technology, electronics, dental) |
80%
(automotive catalysts dominate) |
59%
(electronics, solar panels, EVs) |
| Investment Demand |
9%
(ETFs, bars, coins growing) |
40–45%
(ETFs, central banks, bars/coins) |
<1%
(minimal investor interest) |
16–18%
(coins, bars, modest ETF presence) |
| Historical Volatility (Annual) |
25–35%
(high, supply shocks) |
12–18%
(low, monetary asset) |
35–50%
(very high, auto-dependent) |
22–32%
(dual industrial/monetary) |
CME Platinum Futures Forecast: Technical Analysis and Trading Strategies
CME platinum futures (PL) represent 50 troy ounces per contract with nearly 50% year-to-date gains through 2025, according to CME Group's Q4 Metals Update. Technical analysis from LiteFinance reveals critical resistance at $1,705/oz following December's all-time high of $1,779/oz, with primary support at $1,525/oz. Price patterns include Bullish Pennant formation targeting $1,914/oz, while MACD shows bearish divergence and RSI indicates overbought conditions. Trading strategies require position sizing not exceeding 2-3% account equity per contract, with stop-losses placed 3-5% from entry.
Key Technical Levels for CME Platinum Futures (December 2025):
- Primary Resistance: $1,705/oz - Failed breakout level, critical barrier for continued uptrend
- Secondary Resistance: $1,779/oz - All-time high recorded December 12, 2025
- Extension Target: $1,914/oz - Bullish Pennant pattern projection
- Immediate Support: $1,525/oz - Short-term correction floor, key decision point
- Strong Support: $1,377/oz - Secondary support from technical retracement levels
- Major Support: $1,267/oz - Psychological level and historical consolidation zone
- Stop-Loss Placement: 3-5% below entry for long positions; 3-5% above entry for shorts
- Position Sizing Guidance: Maximum 2-3% account equity per 50 oz contract; scale in with 30-40-30 allocation
Platinum Market Self-Correction Mechanisms
Platinum market self-correction mechanisms demonstrate limited short-term responsiveness, with WPIC research revealing price inelasticity across both supply and demand. Recycling response represents the primary correction mechanism, with automotive catalyst recovery showing price elasticity—low PGM basket prices during 2022-2024 disincentivized recycling, causing scrapyard hoarding when economic incentives disappeared. According to CME Group analysis, recycling supply increased 50% from 2015-2021 as prices rose but declined 30% through 2023 when prices fell.
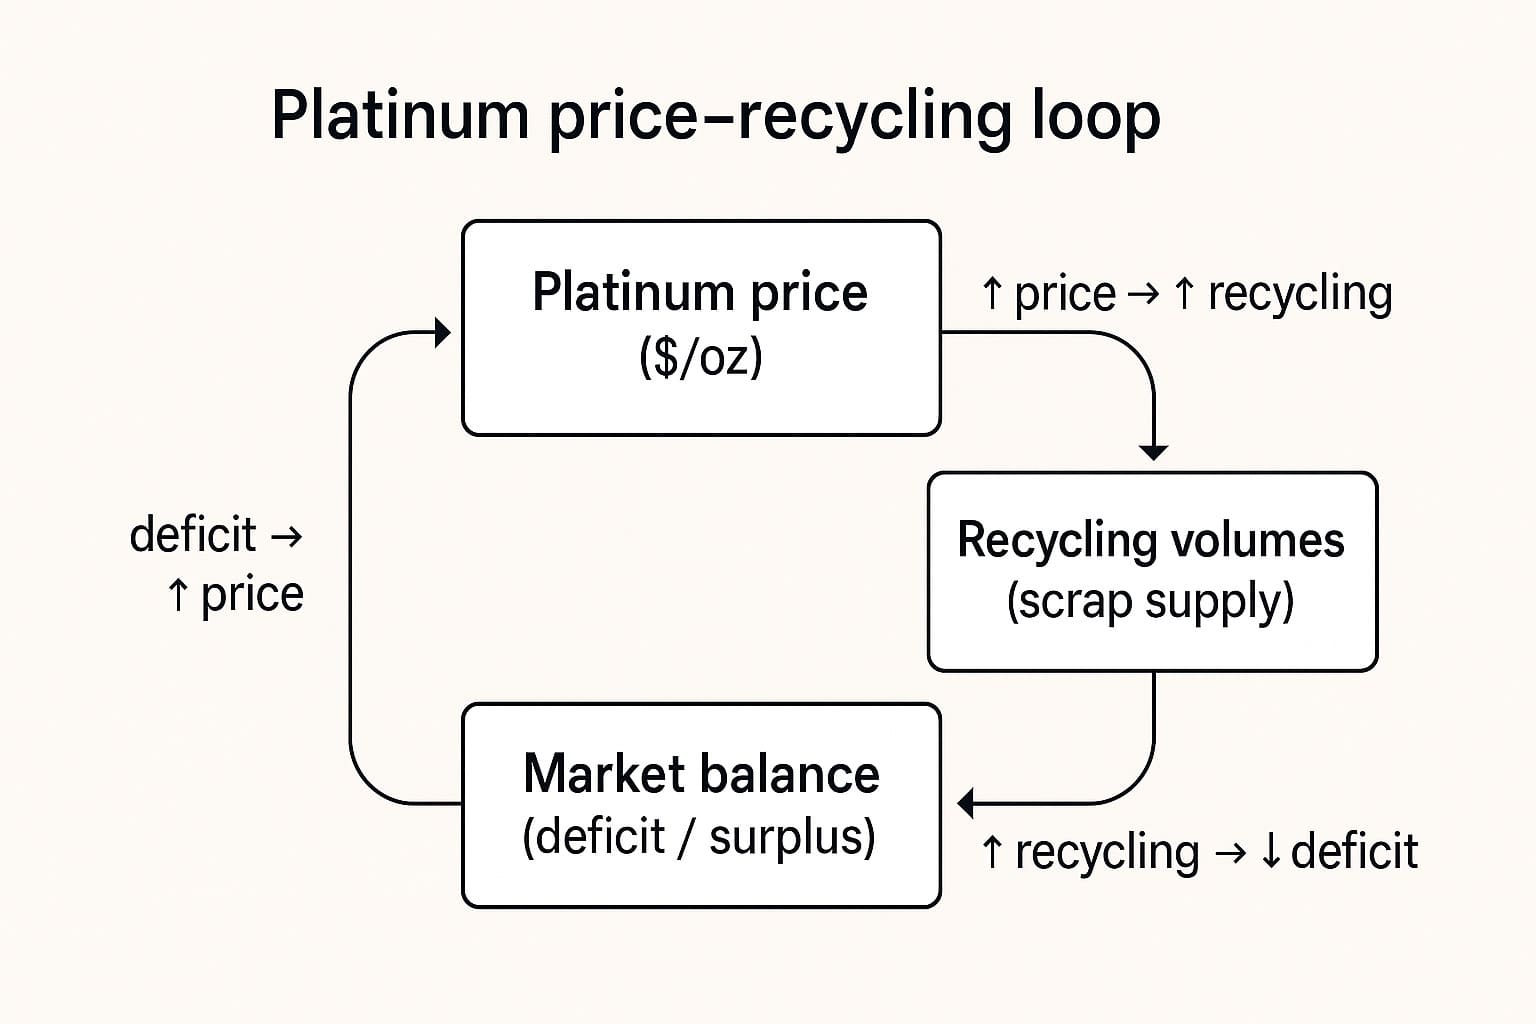 Platinum market self-correction mechanisms
However, WPIC Q1 2025 data shows recycling remains 17% below ten-year averages despite recent price increases, suggesting correction mechanisms are impaired. Mine supply proves structurally inelastic, requiring 8-9 years for new production despite an 83% basket price surge between 2017-2023 producing zero supply response. Market equilibrium restoration depends heavily on above-ground stock depletion, projected to fall below three months of demand by end-2025. Regional price differentials emerged during 2025 physical tightness, with elevated lease rates and London OTC backwardation highlighting supply concentration issues requiring sustained price increases to restore balance.
Risks and Variables That Could Alter These Forecasts
According to LiteFinance and Strategic Metals Invest research, South African production volatility represents the most critical risk—the country produces 70-80% of global supply yet experienced 24% production decline in April 2025 due to power shortages and infrastructure constraints. Nasdaq research indicates Russian sanctions affecting 11% of global supply caused significant 2025 price volatility. Technology transition creates bidirectional uncertainty: LiteFinance notes accelerated EV adoption could reduce automotive demand faster than hydrogen compensates, while World Bank reports identify that geopolitical tensions and hydrogen delays could push prices beyond projections. Federal Reserve policy shifts materially impact investor appetite for non-yielding platinum assets.
Key Risk Categories Affecting Forecast Accuracy:
- South African Production:
Power outages, labor strikes, aging mine infrastructure, underinvestment, and resource nationalism threaten 70-80% of global supply
- Russian Geopolitical Risk: Sanctions escalation, trade restrictions, or supply disruptions from the second-largest producing nation
- Technology Transition: Accelerated EV adoption versus hydrogen economy development timeline creates demand uncertainty
- Interest Rate Environment: Central bank policy shifts affecting precious metals investment flows and opportunity costs
- Recycling Supply Response: Automotive catalyst recovery rates highly sensitive to platinum prices but with lagged response
- Automotive Industry Dynamics: Diesel/petrol versus electric versus hydrogen fuel cell technology adoption rates
- Chinese Economic Growth: Demand trajectory from world's largest automotive market and industrial platinum consumer
Conclusion: Final Thoughts on Platinum's Price Trajectory
Platinum markets face persistent supply deficits exceeding 1 million ounces annually through 2030. South African production constraints and limited recycling recovery create structural tightness, while hydrogen fuel cell demand offers growth potential beyond traditional automotive applications. Analyst forecasts project prices reaching $1,850-$2,000/oz by 2030, though South African disruptions and technology transitions introduce uncertainty. The 2027-2029 period marks a critical phase as above-ground inventories deplete to multi-year lows. Platinum's 50-60% discount to gold reflects both industrial demand vulnerabilities and potential upside if hydrogen adoption accelerates as projected.
Key Takeaways from This Analysis:
- 2027 price forecast: $1,740-$1,850/oz
with gradual appreciation throughout the year, peaking in May at $1,846/oz
- 2028-2029 targets: $1,850-$1,950/oz range supported by structural supply deficits and accelerating industrial demand
- Long-term 2030 projection: $1,950-$2,000/oz with potential extension toward $4,000 by 2034 in bull-case scenarios
- Platinum trades 50-60% below gold prices despite comparable rarity, representing significant valuation gap
- 2027-2029 represents optimal entry window as above-ground inventories reach critical lows while demand recovers
- South African production risks (70-80% of supply) and Russian sanctions remain primary downside threats to forecasts
- Historical forecast accuracy shows 10-15% deviation with analysts consistently underestimating supply disruptions and price volatility
FAQ
-
Is platinum expected to go up in 2026?
Yes, platinum prices are projected to appreciate throughout 2026, starting at $1,688/oz in January and reaching $1,789/oz by May before modest consolidation. The year shows overall positive momentum driven by structural supply deficits exceeding 1 million ounces and depleting above-ground inventories.
-
What is the future price of platinum in 2026?
Platinum is forecast to trade in the $1,688-$1,792/oz range throughout 2026, with monthly gains concentrated in the first half of the year. WalletInvestor forecasting models project the year-end price around $1,739/oz, representing gradual appreciation from current levels.
-
What factors are driving the surge in platinum demand?
The primary demand drivers include automotive catalyst requirements (38% of total demand), emerging hydrogen fuel cell technology adoption requiring 30-60g per vehicle, and recovering industrial applications. WPIC data shows a 966,000 ounce supply deficit creating sustained demand pressure.
-
What are the main factors that drive platinum price fluctuations?
South African production volatility affects 70-80% of global supply through power outages and labor strikes, while Russian sanctions impact 11% of supply. Additional factors include interest rate policies affecting investment flows, technology transitions between EV and hydrogen vehicles, and recycling supply responses lagging price changes by several quarters.
-
How does industrial demand influence platinum price projections?
Industrial demand represents 62% of total platinum consumption (automotive 38%, other industrial 24%), making it the dominant price driver. The transition from traditional automotive catalysts to hydrogen fuel cells creates uncertainty—accelerated EV adoption poses downside risk, while hydrogen adoption delays could postpone anticipated demand growth supporting higher price forecasts.