Stochastic Oscillator: What It Is and How It Works in Trading
)
The stochastic oscillator is an essential instrument that provides traders with important information on market momentum and possible changes in trends. Created by George Lane in the 1950s, this tool assists traders in recognizing overbought and oversold situations by analyzing closing prices within a specific price range over a set timeframe.
In this article, we will get into details of stochastic indicators, explain how to calculate them, and use them in trading strategies. Read on to find out how this technical analysis tool can improve your trading results.
Table of Contents
Key Takeaways
What is the Stochastic Oscillator (aka Stochastic Indicator)?
Stochastic Indicator Formula
What's the Rationale Behind the Stochastic Oscillator?
Understanding Momentum
How the Stochastic Indicator Works
Using the Stochastic Oscillator
Combining the Stochastic with Other Tools
Relative Strength Index (RSI) vs. Stochastic Oscillator
Limitations of the Stochastic Oscillator
What are the Pros and Cons of Using Stochastics?
Example of the Stochastic Oscillator
Conclusion
FAQs
Key Takeaways
-
The stochastic oscillator measures an asset's closing price within its price range during a specific timeframe.
- The fast stochastic indicator quickly reacts to price movements using two stochastic lines: the %K line (primary line) and the %D line (average of the %K line), providing rapid signals for traders who are actively involved.
- The slow stochastic smooths out the %K line, making the indicator more stable to minimize noise and false signals.
- Traders use this indicator to identify potential price reversals, divergences, and signals indicating the continuation of trends.
What is the Stochastic Oscillator (aka Stochastic Indicator)?
The stochastic oscillator serves as a momentum indicator used in technical analysis to assess the relationship between a particular closing price of a security and a defined range of prices within a specific timeframe. It is expressed as a percentage and provides valuable insights into potential trend reversals.
To gain a comprehensive understanding of this tool, let's delve into its fundamental features:
- The indicator values fluctuate between 0 and 100, denoting overbought conditions (above 80) or oversold conditions (below 20).
- It consists of the %K line, representing the current closing price, and the %D line, which is a moving average of %K.
- Traders can employ diverse trading strategies by fine-tuning the stochastic indicator with the look-back period and smoothing factor.
The trading chart may display two types of these oscillators: the fast stochastic oscillator, which reacts quickly to price changes and is suitable for short-term trading but may generate more false signals; and the slow stochastic, which is a smoother version, reduces noise, and is more appropriate for longer-term analysis.
Stochastic Indicator Formula
As previously stated, the stochastic indicator consists of two lines. Now, we will demonstrate the calculation process for both of them.
The first stochastic line, the %K line, is calculated using the formula below.
%K = 100 × (C − L14) / (H14 − L14)
- C stands for the asset's latest closing price.
- L14 is the lowest price in the past 14 days.
- H14 represents the highest price in the same 14-day period.
This stochastic oscillator formula measures the current price within the asset's recent price range, indicating the position of the closing price within that range.
The %D stochastic line, also known as the signal line, is a refined version of the %K line. It is generally calculated as a 3-period simple moving average (SMA) of the %K values. The calculation is as follows:
%D = 3-period SMA of %K
The %K and %D lines fluctuate between 0 and 100, serving as a visual representation of overbought or oversold conditions in the market. When the reading surpasses 80, it typically signals an overbought condition, hinting that the asset might be overvalued and could undergo a bearish reversal. On the other hand, a reading below 20 suggests oversold conditions, indicating that the asset might be undervalued and a bullish reversal could be on the horizon.
What %K Represents on the Stochastic Oscillator
The %K line provides valuable insight into how the current price compares to the highest and lowest prices of the asset over a specific time frame, typically 14 days. This data offers a clear indication of the speed and strength of the price movement, enabling traders to identify potential overbought or oversold conditions.
What %D Represents on the Stochastic Oscillator
The %D line represents a moving average of the %K line, usually calculated over three time periods. Its primary role is to serve as a signal line, providing a consistent indication of potential trend changes. When the %K and %D lines cross over, it generates trading signals for either buying or selling.
What's the Rationale Behind the Stochastic Oscillator?
The stochastic technical indicator aims to identify fluctuations in price and momentum in a specific range. This technical indicator assists traders in recognizing potential price reversals by examining the momentum of price movement compared to past highs and lows. The oscillator indicates a potential weakening of the current trend by signaling a slowdown in momentum. This is especially handy for detecting when the market is overbought or oversold, with bullish or bearish divergences indicating a potential shift in price direction.
Understanding Momentum
Momentum in the financial markets is the speed at which a security's price changes, indicating the power of a trend. It shows the speed at which the value of an asset is fluctuating, commonly utilized to create trading indicators. Strong momentum indicates a possible uptrend change while declining momentum could indicate bearish divergences or overbought/oversold conditions.
How the Stochastic Indicator Works
The stochastic indicator helps traders identify key market conditions and potential reversals by analyzing closing prices relative to their recent range. Here's how it works:
- Overbought Range: When the indicator shows values above 80, the asset's price is considered to be in the overbought range. This may suggest that the asset is overvalued and a potential bearish reversal could occur.
- Oversold Readings: Values below 20 indicate oversold conditions, suggesting that the asset may be undervalued and a bullish reversal might be imminent.
- Bullish Reversal: Occurs when the indicator moves up from oversold levels, signaling a potential upward price movement.
- Bearish Divergences: Identified when the asset's price continues to rise, but the stochastic indicator shows lower highs, indicating weakening momentum and a potential downward trend.
- False Signals: The stochastic indicator can sometimes produce misleading signals, especially in strong trending markets. Traders often combine it with other indicators to validate their trading signals.
The Misinterpretation of Overbought and Oversold
A widely-held belief in financial markets is that a stochastic value above 80 signifies an overbought condition, while below 20 indicates an oversold condition. Nonetheless, these levels are indicative of strong momentum rather than providing a direct buy or sell indication. When the stochastic indicator is over 80, it indicates that the security price is experiencing significant upward momentum and is ending close to its recent highs, which doesn't always mean it's overbought. Values under 20 indicate powerful downward momentum, rather than that the asset is oversold.
Traders should view the stochastic indicator as a gauge of momentum instead of a clear signal of a bearish or bullish turnaround. Considering the prevailing trend and utilizing additional indicators such as moving averages is crucial in validating trading signals. This prevents misleading signs and matches more closely with a person's risk tolerance when choosing between overbought or oversold indicators.
Using the Stochastic Oscillator
Traders often implement the Stochastic Oscillator into their trading strategies in several ways. Here are some of them.
- Breakout Trading: Traders look for widening bands and rapid acceleration of the oscillator as potential breakout signals.
- Trend Following: It’s possible to use the oscillator to confirm trends, staying above 80 for bullish trends and below 20 for bearish trends.
- Strong Trends: Traders tend to keep the positions when the oscillator stays in overbought or oversold areas, as it indicates a continuation of a strong trend.
- Trend Reversals: This indicator helps spot changes in trend direction, signaling a shift in market momentum.
- Divergences: Divergences between the oscillator and price action can potentially indicate an impending reversal.
While the Stochastic Oscillator is useful, traders need to be careful about misleading signals, particularly in markets that are not showing clear trends. To reduce risk, it is crucial to consider your risk tolerance and incorporate extra technical indicators to validate signals. Moreover, make sure you use a reliable trading platform, like J2T, offering you all the necessary tools for efficient trading.
Combining the Stochastic with Other Tools
Combining the Stochastic Oscillator with other technical indicators enhances its effectiveness. For example, using a simple moving average as a filter can help confirm signals from the Stochastic, avoiding false signals in slow-moving trends. When the Stochastic indicates an overbought or oversold region, checking if the price is above or below the moving average can validate the signal.
Price patterns, such as breakouts, are another tool alongside the Stochastic. Identifying patterns can help confirm trend reversals or continuations. For instance, if a bullish divergence forms on the Stochastic and a breakout pattern appears, it may signal a strong upward price movement.
Trendlines help identify divergences and possible reversals. A bearish divergence happens when the price reaches higher highs, but the Stochastic indicator shows lower highs, signaling weakening momentum. On the other hand, a bullish divergence occurs when the price hits lower lows while the Stochastic indicator records higher lows, indicating a potential upward reversal.
Relative Strength Index (RSI) vs. Stochastic Oscillator
These technical tools are commonly used to evaluate momentum and pinpoint overbought or oversold situations. Nevertheless, their calculations and applications vary.
The Relative Strength Index (RSI) evaluates how quickly and in what direction prices are moving by examining the size of recent increases compared to recent decreases within a set timeframe. Using a 14-day time frame, this indicator ranges from 0 to 100. Readings above 70 signify overbought conditions, while readings below 30 suggest oversold conditions.
In contrast, the Stochastic Oscillator analyzes how a security's closing price relates to its price range during a specific number of periods. It utilizes the %K line and the moving average of %K to detect possible reversals. The Stochastic indicator pays more attention to the present closing price compared to the highest and lowest prices during the specified period.
Although both indicators can signal overbought and oversold conditions, the RSI is better for measuring trend strength, while the Stochastic Oscillator is more effective at spotting possible price momentum reversals.
Limitations of the Stochastic Oscillator
The Stochastic Oscillator, while useful for identifying potential overbought or oversold conditions, has limitations. It can generate false signals during strong trends, leading to premature exits or entries. Additionally, it may not perform well in highly volatile markets, and its effectiveness depends on the chosen settings, which may require frequent adjustments.
What are the Pros and Cons of Using Stochastics?
Using stochastics in trading offers several benefits and drawbacks. Here are the key pros and cons of this technical indicator:
Pros
- Momentum Indicator: Identifies overbought or oversold conditions.
- Versatility: Useful across different time frames and markets.
- Leading Indicator: Provides early trend reversal signals.
- Ease of Use: Simple to understand and implement.
- Combines Well: Works with other indicators.
Cons
- False Signals: Prone to inaccuracies in volatile markets.
- Lagging in Trends: May miss strong market moves.
- Over-reliance Risk: Can lead to poor decisions if used alone.
- Needs Fine-tuning: Requires constant adjustment.
- Overcomplication: Can complicate analysis when combined with too many indicators.
Example of the Stochastic Oscillator
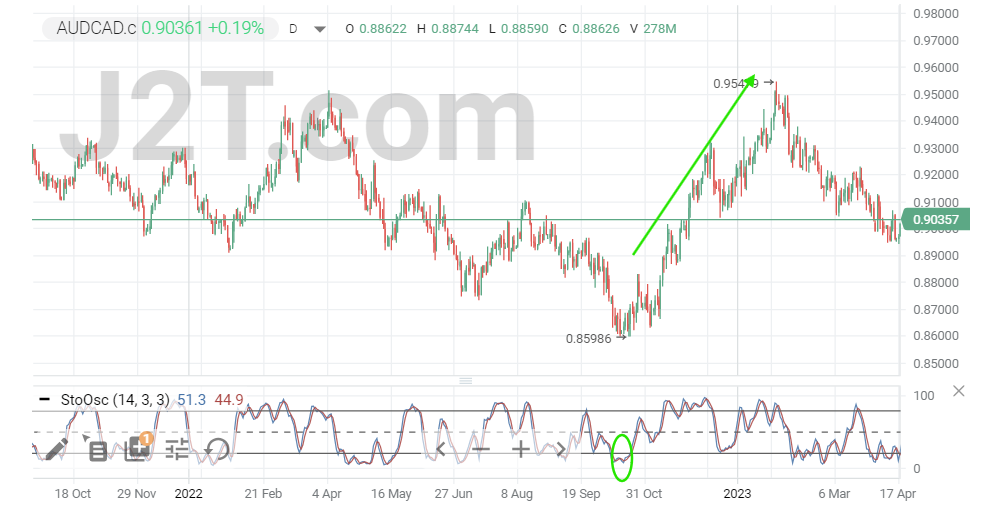
In the AUD/CAD forex pair, the Stochastic Oscillator has recently fallen below 20, signifying an oversold state. When the oscillator line rises above 20 again, it triggers a signal to purchase, indicating a possible upward price reversal. Traders may see this signal as a chance to go long, anticipating an increase in price from its recent low point.
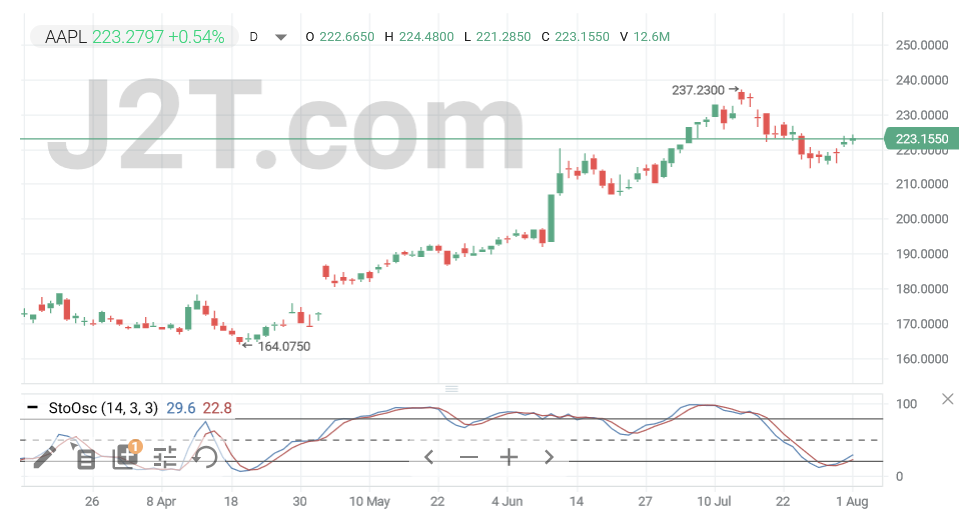
Here is another example on the stock price chart.
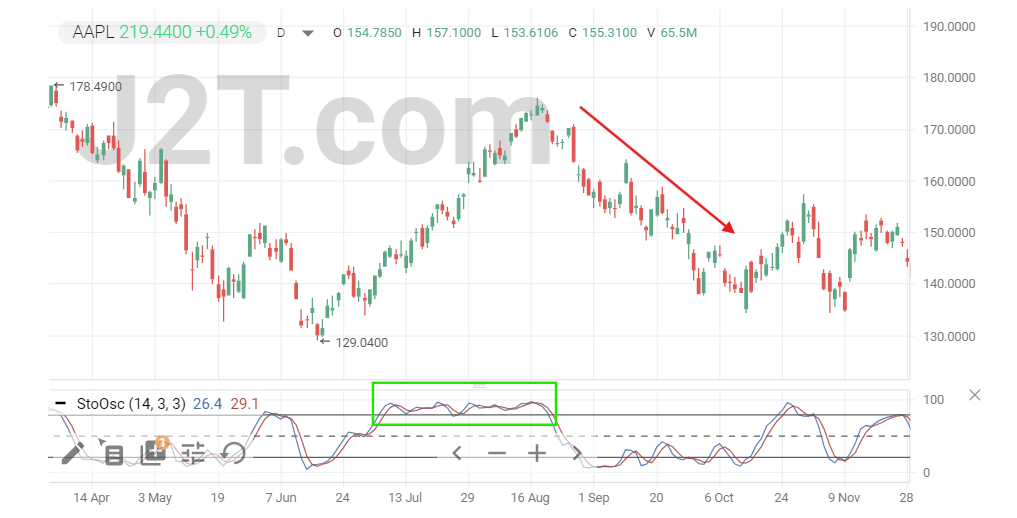
Consider Apple Inc. (AAPL) stock, where the oscillator rises above 80, signaling an overbought condition. As the oscillator line subsequently crosses back below 80, it generates a sell signal, indicating a potential trend reversal. Traders may see this as a cue to exit a long position or enter a short position, anticipating that the price might decline from its peak.
Conclusion
The stochastic oscillator offers valuable insights into market dynamics. Whether identifying overbought or oversold conditions, spotting potential reversals, or confirming trends, this indicator provides a clear framework for navigating complex market conditions. By understanding how this oscillator forms and interpreting stochastic signals, traders can make informed decisions and enhance their trading strategies.
FAQs
What does a stochastic oscillator do?
It evaluates the momentum of an asset's price by comparing the closing price to its historical range within a specific timeframe. Assisting in detecting situations of overbought or oversold, it produces trading indicators such as bullish or bearish reversals.
What does a stochastic indicator tell you?
The stochastic indicator displays where an asset's closing price is within its recent price range. It indicates potential overbought or oversold conditions, offering an understanding of potential trend reversals or continuation.
Is RSI or stochastic better?
RSI is better suited for markets that are trending, showing when conditions are either overbought or oversold. The stochastic indicator is more effective in range-bound markets for spotting possible reversals. Decision-making is influenced by market conditions and the level of risk that can be tolerated.
Which is better, stochastic or MACD?
Stochastic is better for identifying overbought and oversold conditions in sideways markets, while MACD excels in trending markets, highlighting momentum and trend strength. Both serve different purposes and can be used together for comprehensive analysis.
What is the best stochastic oscillator for day trading?
For day trading, an oscillator with a shorter period, like 5-3-3, provides more sensitive signals. It helps capture quick price movements and identify overbought or oversold conditions swiftly, suitable for intraday trading strategies.