Forex Market Structure: Complete Trading Guide to Price Action and Market Phases

Table of Contents
Understanding Forex Market Structure Fundamentals
The Four Market Phases: Complete Cycle Analysis
Price Action Analysis: Reading Market Structure Without Indicators
Trading Signals: BOS and CHOCH in Market Structure
Smart Money Concepts in Market Structure Analysis
Implementing Market Structure Trading Strategies
Risk Management in Market Structure Trading
Advanced Market Structure Concepts
Conclusion: Mastering Market Structure for Consistent Trading
Frequently Asked Questions About Forex Market Structure
Forex market structure is the organized framework of price movements that reveals the ongoing battle between buyers and sellers across four distinct phases: accumulation, uptrend, distribution, and downtrend. Traders analyze market structure through price action, identifying swing highs and lows, Break of Structure (BOS) signals for trend continuation, and Change of Character (CHOCH) signals for potential reversals. Understanding this framework transforms how you perceive currency movements and provides a systematic approach to identifying high-probability trading opportunities.
The foreign exchange market moves in predictable patterns that reflect the collective behavior of millions of participants. From individual retail traders to massive institutional investors, every market participant leaves footprints in price action. Learning to read these footprints through market structure analysis gives you an edge that technical indicators alone cannot provide. This comprehensive guide walks you through everything you need to master forex market structure, from fundamental concepts to advanced trading strategies.
Understanding Forex Market Structure Fundamentals
Market structure forex analysis begins with recognizing that price movements are not random. Instead, they follow organized patterns that reflect supply and demand imbalances created by market participants. When you strip away the noise of technical indicators and focus purely on how price organizes itself over time, you begin seeing the market through an entirely different lens.
The foundation of forex market structure rests on understanding buyer versus seller dynamics at any given moment. When buyers overwhelm sellers, price rises. When sellers dominate buyers, price falls. This constant tug-of-war creates the waves and patterns that form market structure. The key insight is that these patterns repeat because human psychology remains constant across time and markets.
Four distinct phases characterize every market cycle: accumulation, uptrend, distribution, and downtrend. These phases flow into one another in a predictable sequence, though the duration of each phase varies based on timeframe and market conditions. Professional traders build their entire approach around identifying which phase the market currently occupies and positioning themselves accordingly.
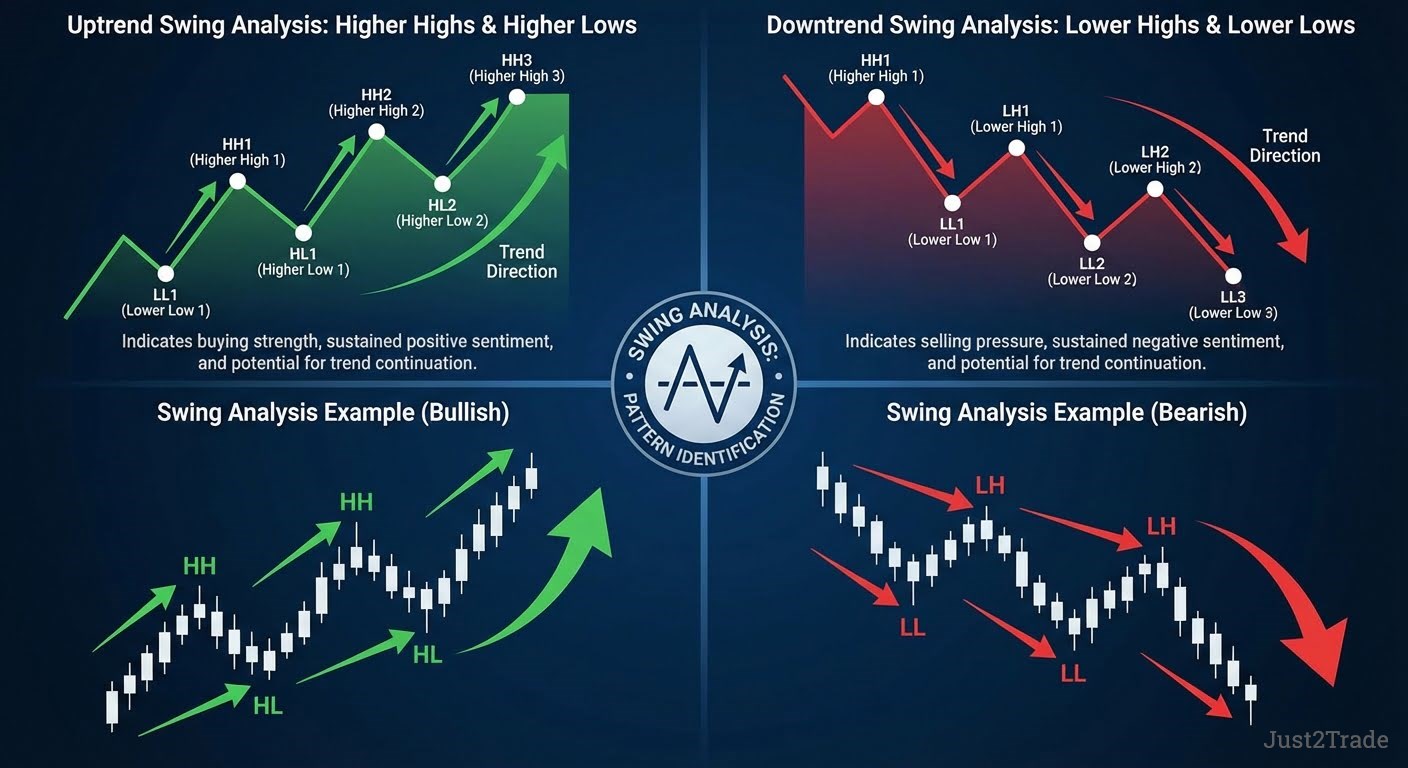
Price organization reveals itself through specific structural elements. Higher highs paired with higher lows indicate bullish structure, while lower highs combined with lower lows signal bearish structure. These swing points become the roadmap for understanding where price has been and where it might go next. Rather than predicting future movements, structure analysis helps you respond to what price is actually doing.
The beauty of market structure analysis lies in its universality. The same principles apply whether you're trading major pairs like EUR/USD, exotic crosses, or any other financial instrument. Once you internalize how structure forms and shifts, you carry this knowledge across all markets and timeframes.
The Philosophy of Price Action Analysis
Price action analysis operates on a fundamental belief: the market tells its complete story through price alone. Every piece of information, including economic data, central bank decisions, geopolitical events, ultimately gets reflected in price movement. Rather than filtering this information through lagging indicators, price action traders read the source directly.
Three core components for reading market structure:
- Support and resistance levels — price boundaries where buying or selling interest is historically concentrated.
- Swing highs and swing lows — structural turning points that define trend direction through higher highs/lows or lower highs/lows patterns.
- Candlestick patterns — individual and multi-candle formations revealing sentiment at specific price levels.
This indicator-free approach offers several advantages. Price action signals form in real-time, not after mathematical calculations create a delay. You see market sentiment expressed immediately through candlestick patterns, support and resistance reactions, and structural shifts. Many professional traders and institutions rely primarily on price action because it reveals what the market is doing now, not what it was doing several periods ago.
The Four Market Phases: Complete Cycle Analysis
Understanding the four market phases transforms your ability to contextualize any chart you analyze. Each phase has distinct characteristics, typical participant behavior, and optimal trading approaches. Mastering phase recognition prevents you from fighting the market and helps you align with dominant forces.
The market cycle forex traders observe moves from accumulation through markup (uptrend), into distribution, and finally through markdown (downtrend). This cycle repeats endlessly across all timeframes, from one-minute charts to monthly views. The difference lies only in the duration of each phase — what takes hours on a lower timeframe might take months on higher timeframes.
Transitions between phases often provide the highest-probability trading opportunities. When accumulation shifts into uptrend or distribution breaks into downtrend, significant moves typically follow. These transition points generate the BOS and CHOCH signals that structure traders rely upon for entry. Recognizing phase characteristics helps you anticipate these transitions before they complete.
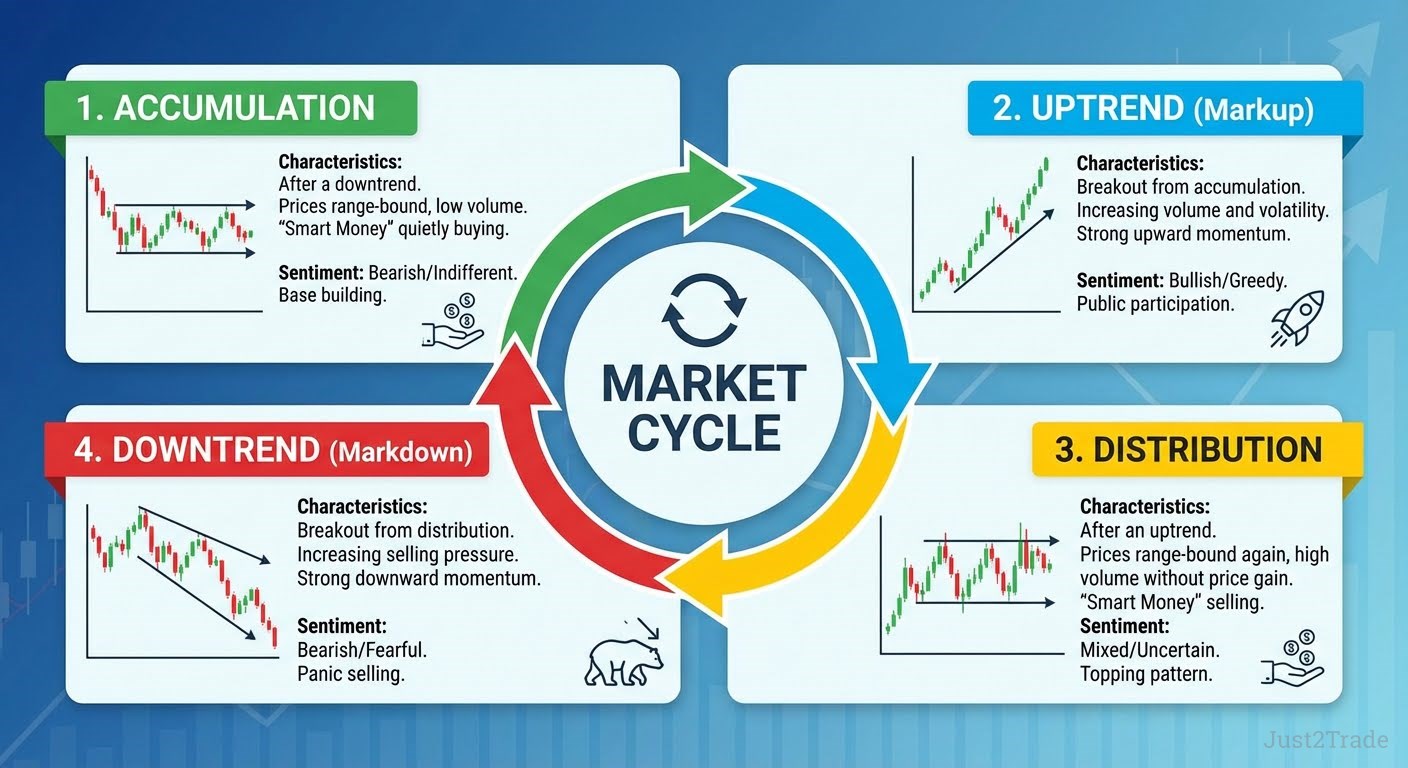)
Accumulation Phase: Smart Money Entry
The accumulation phase forex traders identify appears as sideways movement following a downtrend. Price stops making lower lows and begins consolidating within a range. This seemingly boring price action actually marks a crucial transition period where informed institutional players quietly build positions.
Smart money accumulation occurs gradually because large orders cannot be filled instantly without moving prices against the institution's desired direction. Banks, hedge funds, and other major players buy in stages, keeping prices contained within the accumulation range. To retail traders watching only price direction, nothing exciting happens. But beneath the surface, massive position building prepares the market for its next trending phase.
Volume analysis during accumulation often shows increasing activity on up-moves and decreasing activity on down-moves, though this varies by market. The key structural element is price repeatedly testing and holding support while gradually building higher lows toward the range's resistance. When accumulation completes, breakout above resistance typically initiates the uptrend phase with significant momentum.
Recognizing accumulation allows you to position early for upcoming trends rather than chasing price after it has already moved substantially. The risk-to-reward ratio for entries during late accumulation often exceeds entries made after trend confirmation.
Distribution Phase: Institutional Exit Strategy
The distribution phase forex analysis shows opposite characteristics to accumulation. Following an uptrend, price stops making higher highs and enters a consolidation range at elevated levels. This market top formation signals that smart money has begun systematically exiting long positions built during accumulation.
Institutional selling during distribution mirrors the gradual buying of accumulation. Large positions cannot liquidate instantly, so institutions sell in stages while price oscillates within the range. Retail traders, seeing price at recent highs, often buy during distribution, providing liquidity for institutional exits. This dynamic explains why breakdowns from distribution often produce sharp, fast-moving downtrends.
Structural characteristics of distribution include lower highs forming against range support that holds. As distribution progresses, support tests become more frequent and more severe. Eventually, selling pressure overwhelms remaining buyers, and price breaks down into the downtrend phase.
Understanding distribution phase dynamics prevents you from buying into weakness at market tops. Instead of chasing the final exhausted moves of an uptrend, you can position for the coming downtrend or simply stay out until structure clarifies.
Price Action Analysis: Reading Market Structure Without Indicators
Price action forex analysis provides the tools for reading market structure in real-time. Without indicators cluttering your charts, you focus on what matters: how price interacts with key levels, how swings form and break, and what patterns emerge from raw price data.
Market structure analysis through price action involves three primary elements: support and resistance levels that define boundaries, swing highs and lows that reveal trend direction, and candlestick patterns that show sentiment at specific points. These elements combine to paint a complete picture of market conditions without requiring any calculations or delayed signals.
The methodology begins with identifying significant price levels where reactions have occurred historically. These support and resistance zones then frame your analysis. You watch how price behaves when approaching these levels. Clean breaks suggest continuation; rejections suggest reversal. The swing points between these levels define the current structural trend.
Pattern recognition develops naturally with screen time. You begin seeing familiar setups before they complete, allowing early positioning. Unlike indicator signals that arrive simultaneously for everyone, your ability to read price action directly creates a genuine edge. The market rewards those who see what's happening now, not what happened several bars ago.
Support and Resistance: Market Structure Boundaries
Support and resistance levels define the boundaries within which market structure develops. Support represents price floors — zones where buying interest historically overwhelmed selling pressure, causing prices to bounce. Resistance represents price ceilings — zones where selling pressure overcame buying interest, forcing price to retreat.
Support resistance levels form from multiple sources. Previous swing highs become resistance when price returns from below; previous swing lows become support when price returns from above. Psychological round numbers often act as support or resistance because human traders cluster orders at these levels. Institutional zones where large players accumulated or distributed positions create particularly strong levels.
Trading applications for support and resistance are numerous. These levels provide logical places for stop loss orders, just beyond the level where your trade thesis becomes invalid. They offer entry zones when price approaches and show rejection patterns. They define profit targets where opposing pressure likely emerges. Perhaps most importantly, support resistance zones help identify when market structure changes: clean breaks through significant levels often initiate new trends.
The interaction between price and these boundaries tells you about current market sentiment. Strong rejections suggest the level holds significance for current participants. Weak reactions suggest the level is losing relevance. Multiple tests of the same level typically weaken it, setting up eventual breakout.
Swing Analysis: Identifying Market Structure Turning Points
Swing highs and lows forex traders identify form the skeleton of market structure. A swing high occurs when price makes a local peak before reversing. A swing low forms when price makes a local trough before bouncing. These swing points create the waves visible on any price chart.
Trend identification through swing analysis is straightforward. An uptrend consists of higher highs and higher lows, each swing high exceeds the previous one, and each swing low holds above the previous one. A downtrend consists of lower highs and lower lows, each swing high fails to reach the previous one, and each swing low breaks below the previous one.
Market structure points formed by swings provide reference for trading signals. When price breaks above a significant swing high in an uptrend, that's a Break of Structure confirming continuation. When price breaks below a swing low during an uptrend, that's a Change of Character warning of potential reversal. These signals depend entirely on accurate swing identification.
Proper swing identification requires choosing appropriate prominence. Not every minor wiggle qualifies as a significant swing point. Focus on swings that participate in the trend's structural definition. The highs and lows can cause you to question the trend if broken. These significant swings generate meaningful signals when violated.
)
Trading Signals: BOS and CHOCH in Market Structure
The BOS and CHOCH signals form the core entry and exit triggers for market structure traders. Break of Structure confirms that an established trend continues with momentum. Change of Character warns that the trend may be ending and a reversal could follow. Together, these signals provide a complete framework for timing trades within a structural context.
BOS CHOCH market structure analysis differs fundamentally from indicator-based trading. Rather than waiting for moving average crosses or oscillator signals, you respond to price itself breaking or respecting key structural levels. This direct approach eliminates the lag inherent in calculated indicators while grounding every decision in actual price behavior.
The relationship between these two signals creates a complete trading system. BOS entries keep you aligned with dominant trends, capturing the profitable middle portions of moves. CHOCH warnings protect profits by signaling when to tighten stops or exit entirely. Neither signal works optimally in isolation. They complement each other as part of a unified structural approach.
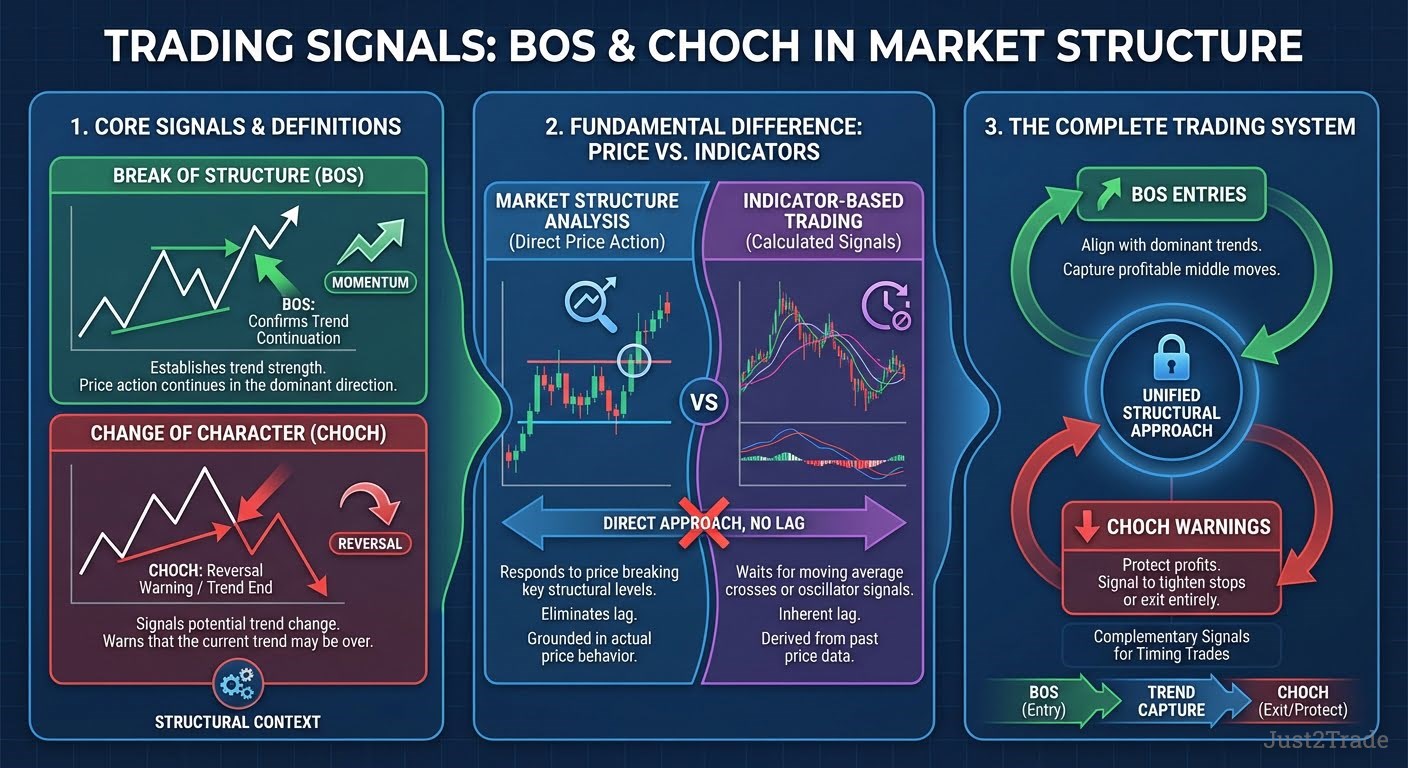)
Break of Structure (BOS): Trend Continuation Signals
Break of structure forex signals occur when price exceeds the most recent significant swing point in the direction of the established trend. In an uptrend, BOS triggers when price breaks above the previous higher high, confirming that buyers remain in control and the trend continues. In a downtrend, BOS forms when price breaks below the previous lower low, confirming seller dominance.
Signal recognition requires clearly identified swing points as references. Without knowing where the significant previous swing high sits in an uptrend, you cannot recognize when price breaks it. This underscores the importance of consistent swing identification methodology. Arbitrary swing selection leads to arbitrary BOS signals.
Market structure break signals provide entry timing for trend-following strategies. When you identify an uptrend through higher highs and higher lows, you wait for price to pull back toward the most recent higher low, then enter as price generates a BOS above the recent swing high. This approach captures trend continuation while managing risk through stop placement below the pullback low.
BOS confirmation requirements vary by trader preference. Some traders require a clean candle close beyond the swing point. Others enter on the break itself, accepting occasional false breaks for earlier entry on valid signals. Your trading plan should specify exactly what constitutes BOS for your methodology.
The significance of BOS extends beyond mere entry triggers. Each break of structure confirms that market participants continue favoring the trend direction. Institutional money flow, smart money concepts, and retail sentiment align to push price through previous structural barriers. This consensus makes trend continuation trades have higher probability than counter-trend attempts.
Change of Character (CHOCH): Reversal Warning Signals
Change of character forex signals provide early warning that an established trend may be ending. CHOCH occurs when price breaks a structural level in the opposite direction from the trend, breaking below a higher low in an uptrend or breaking above a lower high in a downtrend. This market structure shift suggests the buyers-versus-sellers dynamic is changing.
CHOCH signal recognition follows the same swing-based methodology as BOS but watches for breaks in the "wrong" direction. In an uptrend, you track the higher lows that define bullish structure. When price breaks below the most recent higher low, the uptrend's structural integrity fails, that's CHOCH. The trend hasn't necessarily reversed, but its continuation is no longer confirmed.
The implications of market structure shift through CHOCH are significant for risk management. Existing long positions in an uptrend should be reevaluated when CHOCH occurs. Some traders exit entirely; others tighten stops dramatically. New long entries become inadvisable until structure clarifies or reestablishes bullishly.
CHOCH doesn't guarantee trend reversal. It guarantees uncertainty about continuation. Price might consolidate sideways after CHOCH, potentially reestablishing the original trend direction. Or price might immediately begin trending in the opposite direction. Your response to CHOCH should reflect this uncertainty rather than assuming immediate reversal.
Early detection benefits of CHOCH signals include capital preservation and opportunity cost reduction. Exiting a failed trend early preserves gains accumulated during the trend's valid phase. It also frees capital for deployment elsewhere rather than sitting in a position going nowhere or moving against you.
Smart Money Concepts in Market Structure Analysis
Smart money forex analysis recognizes that not all market participants are equal. Institutional investors, major banks, and hedge funds command capital that dwarfs retail trading accounts. When these players take positions, their activity creates the market phases and structural patterns that price action reveals. Understanding how smart money operates transforms your interpretation of market structure.
Institutional behavior patterns visible through market structure analysis include:
- Gradual position building — smart money accumulation during sideways consolidation after downtrends.
- Aggressive breakout participation — institutional money driving uptrend initiation with volume.
- Systematic profit-taking — distribution phase selling into retail buying at market tops.
- Position reversal — transitioning from distribution to downtrend short positioning.
Smart money concepts integrate with structure analysis naturally. The four phases: accumulation, uptrend, distribution, downtrend. They reflect smart money behavior at different stages of their trading cycle. They accumulate during consolidation after downtrends, ride prices higher during uptrends, distribute into retail buying at tops, and profit from downtrends while building short exposure.
The institutional behavior patterns visible through structure analysis include gradual position building (accumulation), aggressive breakout participation (uptrend initiation), profit-taking distribution, and position reversal (distribution to downtrend transition). Each pattern leaves characteristic structural footprints that trained eyes recognize.
Retail alignment with institutional flow represents the practical application of smart money concepts. Rather than fighting against participants with infinitely greater resources, you position yourself alongside them. When structure suggests accumulation is complete, you prepare for long entries. When distribution patterns emerge, you protect profits and prepare for potential shortfalls.
Aligning with Institutional Flow
Institutional flow forex positioning doesn't require knowing exactly what institutions are doing. It requires recognizing the structural patterns their activity creates. When smart money accumulates, price forms specific patterns. When they distribute, different patterns emerge. Your job is recognizing these patterns and positioning them accordingly.
The professional trading approach involves patience and selectivity. Institutional traders don't chase every move. They wait for favorable conditions aligned with their structural analysis. Retail traders often lose precisely because they overtrade, entering positions without clear structural support. Adopting an institutional mindset means trading less frequently but with higher conviction when conditions align.
Smart money alignment creates sustainable trading approaches. By flowing with institutional order flow rather than against it, you capture moves supported by massive capital. Your small position rides waves created by billions in institutional money. Fighting these waves guarantees eventual failure; riding them creates consistent results.
Practical implementation involves identifying market phase, waiting for structural signals confirming phase transition, and entering with appropriate risk management. A complete trade might involve recognizing late-stage accumulation, entering long on BOS above the accumulation range, riding the uptrend with trailing stops beneath swing lows, and exiting on CHOCH warning or distribution pattern recognition.
Implementing Market Structure Trading Strategies
Market structure trading strategy implementation transforms theoretical knowledge into practical results. Understanding concepts means nothing without systematic application. This section provides frameworks for building complete trading strategies around structural analysis.
Entry rules based on structure require specific criteria before position initiation. Define what constitutes valid BOS for entries: which swing points matter, whether candle close is required, and what additional confluence factors you require. Specify forbidden entries, perhaps no trades against higher timeframe structures or no trades during major news events.
Exit criteria protect capital and lock profits. Structure-based stops belong beyond levels that would invalidate your trade thesis, typically beyond the swing low for long entries or swing high for short entries. Profit targets might be previous structural levels, measured moves, or trailing stops that follow structure. CHOCH warnings should trigger predefined responses.
Position sizing integrates with risk management to ensure survival through inevitable losing streaks. Risking fixed percentages of account equity (typically one to two percent) prevents catastrophic losses regardless of how confident any individual trade feels. Structure provides entries; position sizing preserves accounts.
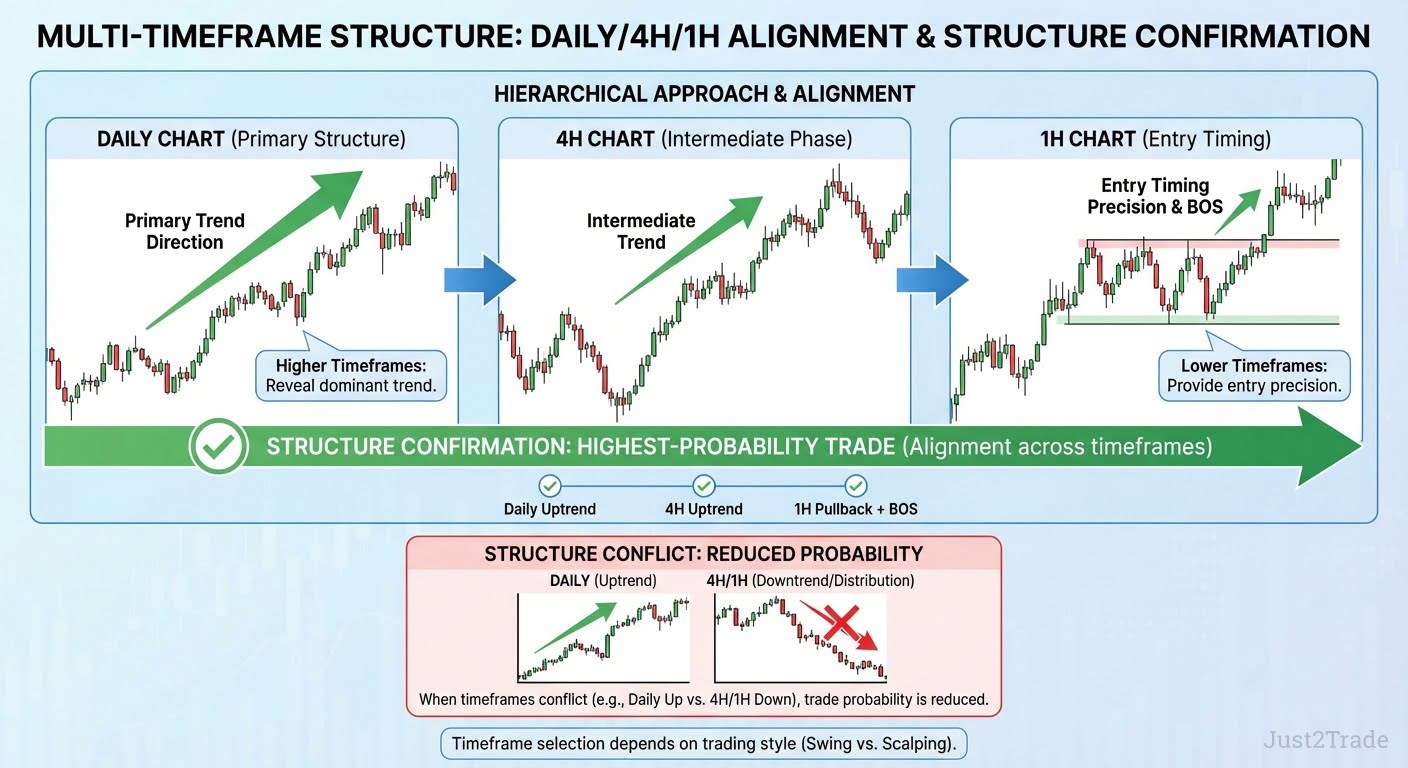
Multi-Timeframe Market Structure Analysis
Multi-timeframe analysis creates a complete structural picture by examining multiple chart periods simultaneously. Higher timeframes reveal primary trend direction; lower timeframes provide entry timing precision. This hierarchical approach prevents the common mistake of trading against dominant trends while still capturing optimal entries.
Trading timeframe selection depends on your trading style and available time. A typical multi-timeframe approach might use daily charts for primary structure assessment, four-hour charts for intermediate phase identification, and one-hour charts for specific entry timing. Swing traders might shift everything up a timeframe; scalpers might shift down.
Market structure timeframes must align for highest-probability trades. When daily structure shows uptrend, four-hour shows uptrend, and one-hour shows pullback followed by BOS. When daily shows uptrend but four-hour shows distribution and one-hour shows downtrend — structure conflicts, reducing trade probability.
)
Risk Management in Market Structure Trading
Forex risk management determines long-term survival regardless of strategy quality. Many traders with excellent structural analysis skills fail because they risk too much per trade, eventually encountering an inevitable losing streak that wipes their accounts. Proper risk management ensures you survive to benefit from your analytical edge.
Structure-based stops use price action levels rather than arbitrary pip amounts. Instead of risking 30 pips on every trade, you risk to the level where your trade thesis becomes invalid, typically beyond the swing point that would change structure against your position. This approach might mean 15 pips on one trade and 50 on another, but each stop has structural logic.
Stop loss market structure placement requires understanding what invalidates your trade. Long entries based on uptrend continuation become invalid if price breaks below the higher low that confirmed the uptrend. That swing low, plus a small buffer for spread and noise, defines logical stop placement. If price reaches that level, your analysis is wrong. Accept the loss rather than hoping.
Position sizing calculations follow from stop distance and risk tolerance. If you're willing to risk one percent of a $10,000 account ($100) and your structural stop requires 50 pips, your position size is $100 divided by 50 pips. This calculation ensures that stop-loss hits, while painful, don't endanger your trading career.
Common Market Structure Trading Mistakes
Market structure mistakes cost traders money and confidence. Understanding common errors helps you avoid repeating them. The most frequent market structure trading errors fall into these categories:
- Signal misinterpretation — mistaking minor price wiggles for significant swing points, generating false BOS or CHOCH signals
- Timeframe misalignment — taking long signals on lower timeframes while higher timeframe structure shows clear downtrend
- Confirmation bias — seeing signals that support existing positions rather than objectively reading price action
- Inadequate risk control — position sizes too large, stops too tight or ignored entirely when hit
- Overtrading — forcing entries without clear structural support instead of waiting for high-probability setups
Trading errors in signal interpretation include mistaking minor swings for significant structural points, leading to false BOS or CHOCH identification. Another common error is confirmation bias, seeing signals that support existing positions rather than objectively reading price. Keeping a trading journal helps identify recurring interpretation errors.
Forex trading pitfalls around timeframe misalignment occur when traders ignore higher timeframe context. Taking long signals on one-hour charts while daily structure shows clear downtrend creates low-probability trades. Always check multiple timeframes before entry to ensure structural alignment.
Inadequate risk control manifests as position sizes too large, stops too tight or too wide, and failure to honor stop levels when hit. Each of these mistakes can be account-ending given enough occurrences. Risk management isn't exciting, but it's the foundation that makes everything else possible.
Advanced Market Structure Concepts
Advanced market structure concepts build upon foundational understanding to provide deeper insight. Once basic phase identification, swing analysis, and BOS/CHOCH signals become second nature, these advanced applications add precision.
Volume confirmation supports structural analysis in markets where volume data is reliable. Rising volume on structural breaks suggests genuine conviction; low volume breaks are more likely to fail. Volume divergence means a price makes new highs while volume declines. It often precedes distribution phases.
Market structure shift timing involves recognizing when phase transitions are likely. Accumulation following extended downtrends has higher transition probability than accumulation after shallow retracements. Distribution after parabolic advances tends to resolve into downtrends faster than distribution after gradual uptrends. Context influences timing expectations.
Signal combinations for professional analysis might include the confluence of BOS with support bounce, volume expansion, and multi-timeframe alignment. Each additional factor increases probability, allowing more aggressive position sizing or tighter stops. Advanced traders develop pattern libraries of their highest-probability setups.
Conclusion: Mastering Market Structure for Consistent Trading
Market structure provides a complete trading framework when combined with proper risk management and signal recognition skills. Unlike systems dependent on lagging indicators, structure analysis reads the market directly, responding to what price is actually doing rather than what calculations suggest it might do.
Market structure mastery develops through deliberate practice. Study historical charts to recognize phase transitions and structural signals. Practice identification in real-time on demo accounts before risking capital. Build screen time systematically until structural reading becomes intuitive rather than analytical.
Forex trading success through structure requires patience and discipline. Not every day offers clear structural signals worth trading. Professional traders accept this reality, waiting for high-probability setups rather than forcing trades in unclear conditions. Your edge compounds over time when you trade only the best opportunities.
Price action proficiency grows incrementally. Expect mistakes early in your journey. Track your trades, review your analysis, and refine your approach continuously. The traders who succeed long-term are those who commit to constant improvement rather than expecting immediate mastery.
FAQ
-
How long does it take to master market structure analysis?
Market structure mastery typically requires six months to two years of consistent practice, depending on study intensity and prior trading experience. The learning progression moves through recognition of basic patterns, identification in real-time conditions, integration with entry and exit timing, and finally intuitive application without conscious analysis. Daily chart review and regular demo trading accelerate skill development. Most traders underestimate the practice requirements, expecting proficiency within weeks rather than months.
-
Can market structure work in all market conditions?
Market structure analysis applies across all market conditions, though method effectiveness varies. Trending markets offer the clearest structural signals with BOS entries performing well during established trends. Ranging markets during accumulation and distribution phases require different approaches: patience while waiting for phase transitions or range-trading strategies within defined boundaries. Structure analysis actually helps identify which condition currently exists, guiding strategy selection.
-
What's the success rate of BOS and CHOCH signals?
Signal reliability for BOS and CHOCH depends heavily on context and confirmation requirements. Raw signals without additional confluence might produce 50-60% accuracy — profitable only with favorable risk-reward ratios. Adding requirements like multi-timeframe alignment, support resistance confluence, and volume confirmation can increase accuracy statistics to 65-75% for selective traders. The key insight is that accuracy alone doesn't determine profitability; risk-reward ratio matters equally.
-
Should beginners start with market structure or technical indicators?
Beginner recommendations typically favor starting with market structure foundations before exploring indicators. Price action analysis teaches market reading directly, building intuition that indicators can't provide. Many professional traders eventually remove most indicators, relying primarily on structure. Starting with structure prevents the common trap of indicator dependency where traders cannot interpret markets without calculated signals. However, some beginners find initial indicator guidance helpful while developing pattern recognition.
-
How do news events affect market structure?
Fundamental impact from news events can accelerate, reverse, or disrupt existing market structure. Major announcements often trigger structural breaks that would have occurred anyway, simply compressing timeframes. Unexpected news influence can invalidate structural analysis temporarily, causing false signals or structure disruption that takes time to resolve. Most structure traders avoid entering positions immediately before significant scheduled announcements and wait for structure to clarify after unexpected events.
-
Can automated systems trade market structure signals?
Automation potential for structure trading exists but faces significant algorithm limitations. Basic BOS and CHOCH signals can be coded, but the contextual judgment that improves human analysis resists automation. Human analysis benefits include recognizing when signals occur in unusual contexts, identifying when patience beats action, and adapting to changing market conditions. Most successful structure traders use automation for alerts and analysis support rather than full execution.
-
What currency pairs work best for market structure analysis?
Currency selection for structure analysis should consider pair characteristics including volatility, spread costs, and trading hours. Major pairs like EUR/USD, GBP/USD, and USD/JPY offer deep liquidity and clean structural patterns. Volatility considerations matter because higher-volatility pairs generate more frequent signals but also more false breaks. Beginners typically start with major pairs before exploring crosses or exotics. Ultimately, structure analysis works across all pairs: choose based on your trading style and market access.
-
How do you practice market structure analysis safely?
Practice methods for developing structure analysis skills include demo trading on platforms with realistic execution, historical analysis using replay features that reveal price bar-by-bar, and paper trading alongside live markets. Risk-free learning through demo accounts allows mistake-making without capital consequences. Start with higher timeframes where patterns develop slowly enough for conscious analysis. Progress to lower timeframes as recognition becomes automatic. Many traders find that three to six months of demo practice prevents costly live trading errors.