Periodo di tempo

Indice:
Che cos'è il time frame?
Quali intervalli di tempo dovresti monitorare?
Esempio di trading
Conclusione
Domande frequenti
I periodi di tempo sono uno strumento necessario per i trader e gli investitori. Periodici diversi consentono di avere un quadro completo di ciò che sta accadendo sul mercato, di tutte le tendenze principali e non solo di alcuni frammenti. La maggior parte dei trader utilizza attivamente diversi periodi di tempo nelle proprie operazioni quotidiane. In questo articolo vi spiegheremo in dettaglio cosa sono i periodi di tempo e come utilizzarli con alcuni esempi.
Punti chiave
- Il timeframe è l'intervallo di tempo che riflette la candela giapponese.
- Nel trading, diversi intervalli di tempo vengono combinati per trovare un'operazione di successo.
- Quali intervalli di tempo utilizzare è una decisione individuale di ciascun trader.
- Gli intervalli di tempo brevi vengono utilizzati per trovare un punto di ingresso, mentre quelli più lunghi servono a determinare la tendenza primaria del mercato.
Che cos'è il time frame?
Un intervallo di tempo è un periodo di tempo che una candela riflette. Se l'intervallo di tempo è di 5 minuti, allora 1 candela riflette ciò che è successo al prezzo in 5 minuti. Se l'intervallo di tempo è di 1 settimana, allora una candela equivale a una settimana. Gli intervalli di tempo vengono utilizzati per condurre un'analisi completa della situazione di mercato al fine di determinare una tendenza o un'inversione di tendenza. Guardando un solo intervallo di tempo, è impossibile capire cosa sta succedendo al prezzo e vedere la tendenza principale.
Ecco perché i trader utilizzano più intervalli di tempo. Molto spesso i trader utilizzano intervalli di tempo di 1 mese o 1 settimana per comprendere la situazione dei prezzi su scala globale o per vedere alcuni punti di inversione o squilibri e tendenze. Intervalli di tempo più brevi, come 1 giorno, 1 ora e 30 minuti, vengono utilizzati per trovare operazioni, livelli, piccole tendenze e stop loss, mentre intervalli di tempo di 5 minuti, 1 minuto e 30 secondi vengono utilizzati per entrare in un'operazione. Naturalmente, questo è solo un esempio, ogni trader ha la propria strategia. Quali sono gli intervalli di tempo (secondo TradingView): 1 secondo, 5 secondi, 10 secondi, 15 secondi, 30 secondi, 1 minuto, 2 minuti, 3 minuti, 5 minuti, 10 minuti, 15 minuti, 30 minuti, 45 minuti, 1 ora, 2 ore, 3 ore, 4 ore, 1 giorno, intervallo di tempo settimanale, mensile, 3 mesi, 6 mesi, 12 mesi.
Quali intervalli di tempo dovresti monitorare?
Gli intervalli di tempo più ampi mostrano le principali tendenze dei prezzi, mentre quelli più brevi sono più contaminati da tendenze e rumori inutili. Abbiamo già detto che la scelta degli intervalli di tempo è individuale. Tuttavia, è possibile dividere i trader in 3 categorie principali:
- Swing trader: trader che si concentrano sui grafici giornalieri per trovare operazioni, osservano l'andamento globale sul grafico settimanale e individuano alcune tendenze a breve termine sul grafico orario.
- I day trader utilizzano intervalli di tempo di 15 o 30 minuti per trovare operazioni, l'intervallo di tempo giornaliero per determinare l'andamento principale e l'ingresso per le operazioni e alcuni andamenti minori sull'intervallo di tempo di 5 minuti.
- I trader posizionali a lungo termine prestano maggiore attenzione al grafico settimanale per trovare soluzioni di trading, utilizzano il timeframe mensile per determinare il trend e utilizzano i grafici giornalieri per entrare o uscire da un'operazione.
Vale la pena ricordare che più ampio è l'intervallo di tempo utilizzato, ad esempio l'intervallo mensile, più a lungo si dovrà attendere il completamento dell'operazione. Non molti trader sono in grado di sopportare operazioni di lunga durata, soprattutto se sono in rosso per un certo periodo, il che può essere psicologicamente difficile. Pertanto, la maggior parte dei trader preferisce operare nell'arco di una giornata o di una settimana. Non è necessario essere uno swing trader, un day trader o un position trader, è possibile scegliere il timeframe primario che si preferisce e fare trading utilizzando più timeframe: timeframe più lunghi per determinare il trend e timeframe più brevi per determinare l'ingresso nel trade. Un avvertimento però: non lasciatevi trasportare dal rumore del grafico a breve termine e non analizzate troppo il trade. I grafici a breve termine vengono solitamente utilizzati per confermare o smentire l'ipotesi del grafico primario.
Esempio di trading
Di seguito possiamo vedere il grafico ONDO/USDT in un intervallo di tempo di 4 ore. In questo intervallo di tempo sono visibili le tendenze, i livelli forti e gli squilibri. L'immagine ci mostra uno squilibrio di inversione. Cioè, per 4 ore il prezzo era solo per l'acquisto, il che ha creato un forte livello di supporto, ma poi il prezzo ha riempito questo periodo e lo squilibrio è diventato inversione (invertito), formando un livello di resistenza. Dopo l'onda primaria, possiamo vedere che il prezzo ha raggiunto i limiti di questo squilibrio, ma non è riuscito ad andare oltre. Inoltre, su questo grafico è possibile vedere la media mobile, che mostra il movimento principale del prezzo.
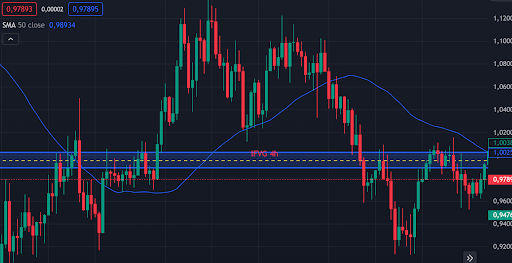)
L'immagine successiva mostra un intervallo di tempo di 30 minuti, utile per cercare operazioni, livelli e stop loss se si fa trading intraday. Si può vedere che il prezzo all'inizio stava scendendo con sicurezza e si è formato un breaker block (BB), l'ultima candela prima dell'inversione. Il prezzo ha superato con successo questo breaker block e ha continuato a salire con sicurezza.
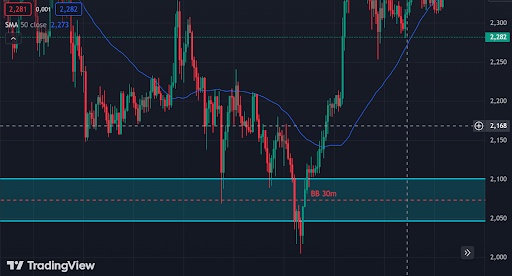)
Per un altro esempio, diamo un'occhiata al titolo HollyFrontier Corp. Di seguito è possibile vedere un grafico giornaliero in cui il prezzo si muove in un intervallo piuttosto ristretto, al di sopra delle medie mobili a 20 e 50 giorni. Se si osservano le bande di Bollinger, è possibile notare un restringimento dovuto alla bassa volatilità, che potrebbe essere foriero di un bel movimento importante.
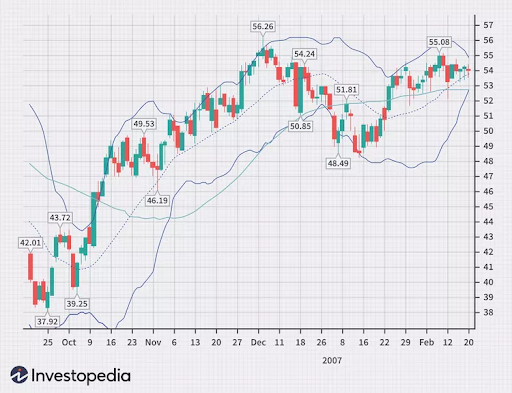)
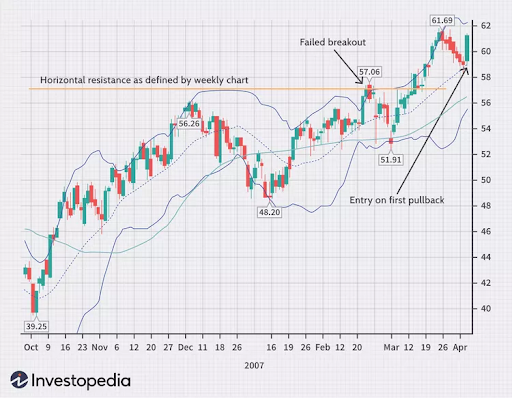
Osservando il grafico settimanale, possiamo vedere che il titolo HOC si sta gradualmente avvicinando a un nuovo breakout. Poi c'è stata una correzione all'interno del range di prezzo, che ha nuovamente preannunciato un breakout.
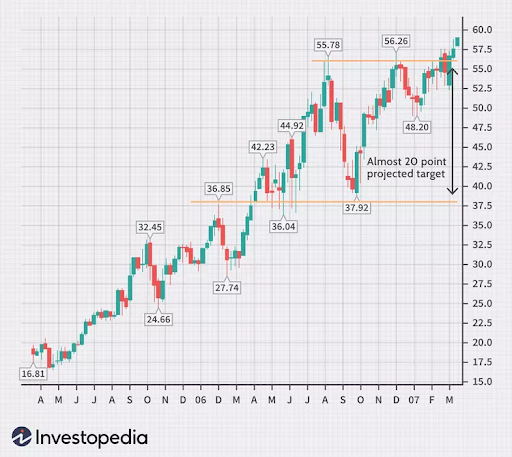)
I breakout con volumi elevati sono spesso rischiosi a causa dell'aumento della volatilità. Tuttavia, un breakout riuscito su un grafico settimanale riduce significativamente il rischio di un potenziale ingresso su un grafico giornaliero.
Analizzando più intervalli di tempo, è stato individuato un punto di ingresso. Una candela a martello si è formata sulla media mobile a 20 giorni e sul supporto della banda di Bollinger, avvicinandosi al precedente livello di breakout, indicando un potenziale supporto. L'ingresso sarebbe avvenuto quando il titolo avesse superato il massimo della candela a martello, idealmente con un aumento del volume.
)
Conclusione
Queste erano le informazioni di base sui time frame. La presenza di più time frame ci consente di studiare il comportamento delle azioni in modo più accurato, di vedere la storia dei prezzi e il trend non solo in modo frammentario, ma anche in generale su scale più ampie, il che ci permette di prendere le giuste decisioni di trading.
Domande frequenti
Cosa sono i time frame nel trading?
Il time frame è l'intervallo di prezzo che una candela giapponese mostra sul grafico.
Quali sono i tre intervalli di tempo per il trading?
Ogni trader può definire tre intervalli di tempo per sé stesso. Tuttavia, in ogni caso, esiste un intervallo primario che viene utilizzato per trovare le operazioni, un intervallo di tempo più alto per determinare l'andamento e un intervallo di tempo più basso per determinare il punto di ingresso.
Qual è il time frame migliore per il trading sul Forex?
Dipende dal trader, non esiste un intervallo di tempo migliore. La maggior parte dei trader si concentra sull'intervallo di tempo con cui si trova più a proprio agio.
Cos'è la strategia dei 15 minuti?
La strategia dei 15 minuti è un approccio di trading che si concentra sull'identificazione e lo sfruttamento delle oscillazioni di prezzo a breve termine in un intervallo di tempo di 15 minuti. Prevede l'utilizzo di indicatori tecnici e modelli grafici per individuare potenziali punti di ingresso e di uscita per operazioni rapide, con l'obiettivo di trarre vantaggio dai rapidi andamenti dei prezzi.
Come si fa trading su un timeframe di 5 minuti?
È possibile combinare più intervalli di tempo: l'intervallo di 5 minuti con intervalli di tempo più lunghi per individuare il movimento di tendenza principale, ad esempio con l'intervallo di 30 minuti. L'ingresso nel trade può essere individuato sull'intervallo di un minuto.