Trading Volume: What it Is and How it Works
)
Ever wondered how much a stock is really moving on the market? That’s where trading volume comes in. It shows how actively a security is being bought or sold during a trading day — think of it as the market’s heartbeat.
From stocks and bonds to options and commodities, trading volume tells us how alive the market really is. It helps spot trends, sense investor mood, and uncover trading opportunities. Read the volume, and you read the crowd.
Table of Contents
Key Takeaways
What Is Volume of Trade?
Understanding Volume of Trade
How Volume of Trade Works
Volume-by-Timeframe (VBT)
Volume-by-Price (VBP)
Special Considerations
Traders and Volume of Trade
Volume Trading Strategies
Volume-Based Indicators
Example of Volume of Trade
Conclusion
FAQs
Key Takeaways
Trading volume shows the total number of shares or contracts exchanged between buyers and sellers during market hours. It reflects market activity and how easily trades can be made — in other words, liquidity.
When higher trading volumes kick in, execution is smoother and trends are clearer. Learn to read trading volumes, and you’ll uncover a hidden layer of market logic.
What Is Volume of Trade?
Volume of trade simply counts how many shares, contracts, or asset units have changed hands in a set period. This can be an hour, a day, or a month.
Whether it’s volume-by-timeframe or volume-by-price, the point is the same: this metric shows how busy a particular security is. The more trades, the more action.
Understanding Volume of Trade
Volume of trade tracks all buy and sell orders for a security within a specific window. More volume usually means more attention.
You’ll often see volume spike at the market’s open and close — and during early Monday and late Friday. That’s when traders digest news, open new positions, or tidy up before the weekend.
How Volume of Trade Works
Market exchanges track and publish trading volume through live feeds and daily summaries. You’ll often get hourly estimates, with the final count released the next day.
Tick volume — the number of price changes in a session — is often used as a proxy. The more ticks, the more likely something’s brewing.
In times of uncertainty, especially in options or futures, trade volume can skyrocket. A sudden jump might signal fear, excitement, or the start of something big.
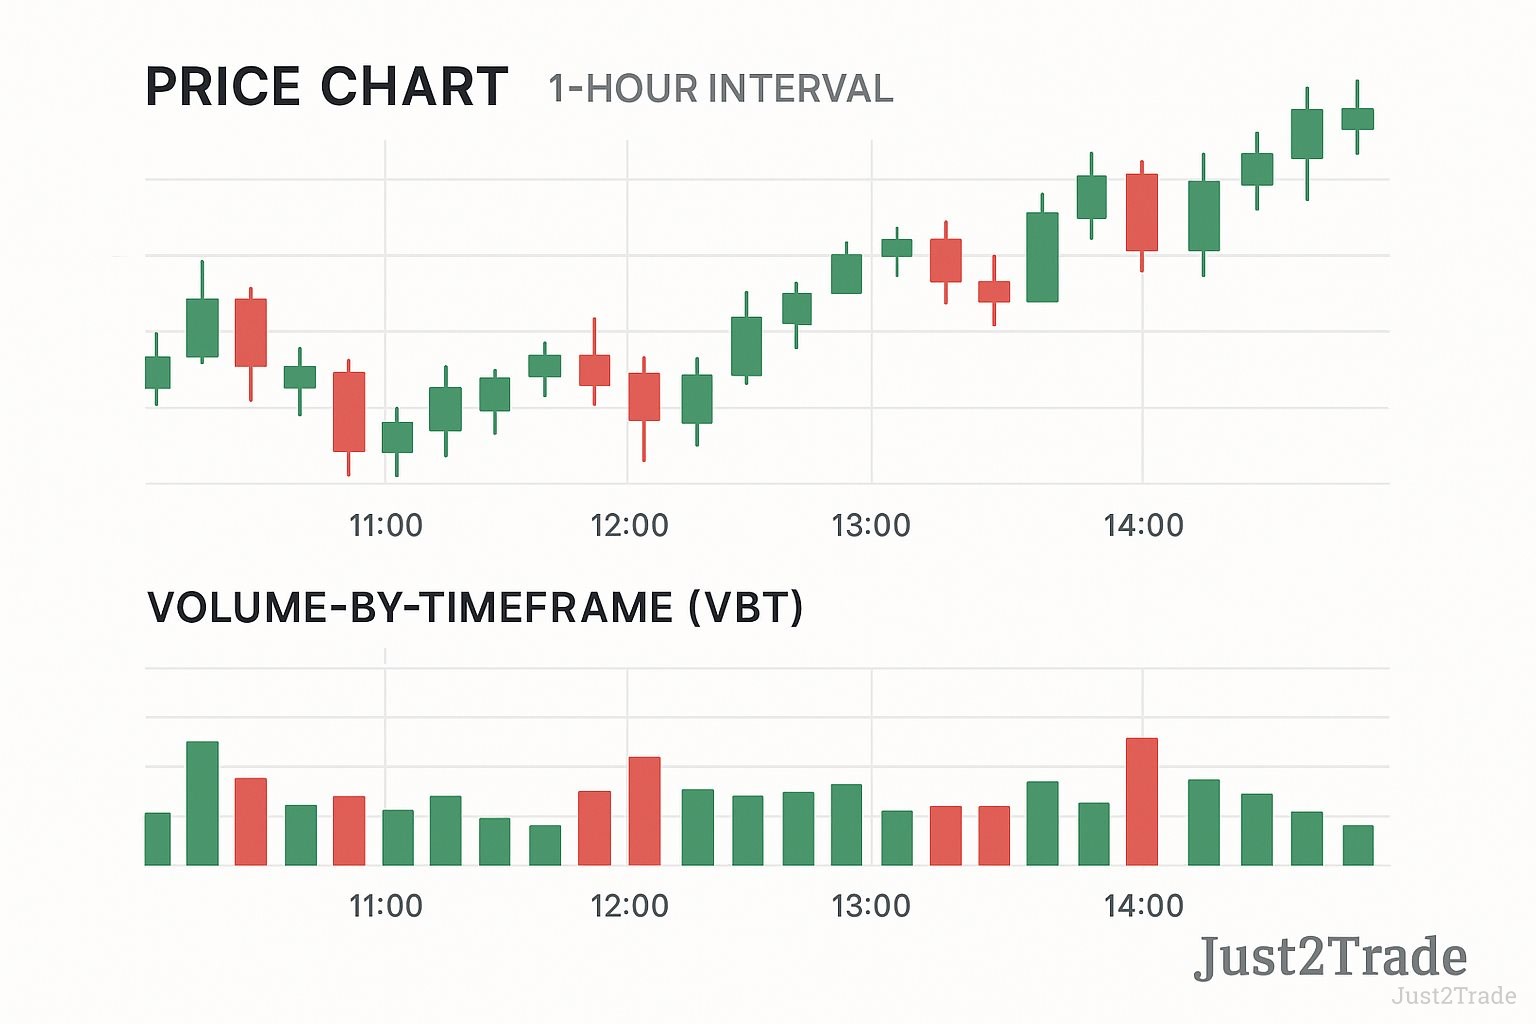
Volume-by-Timeframe (VBT)
This chart type shows volume in chunks of time — 5 minutes, 1 hour, a full day. Each vertical bar represents trades during that period.
Green bars might mean buyers dominated. Red bars? Sellers took the lead. Plotted below a price chart, this setup lets traders match momentum with market behavior.
)
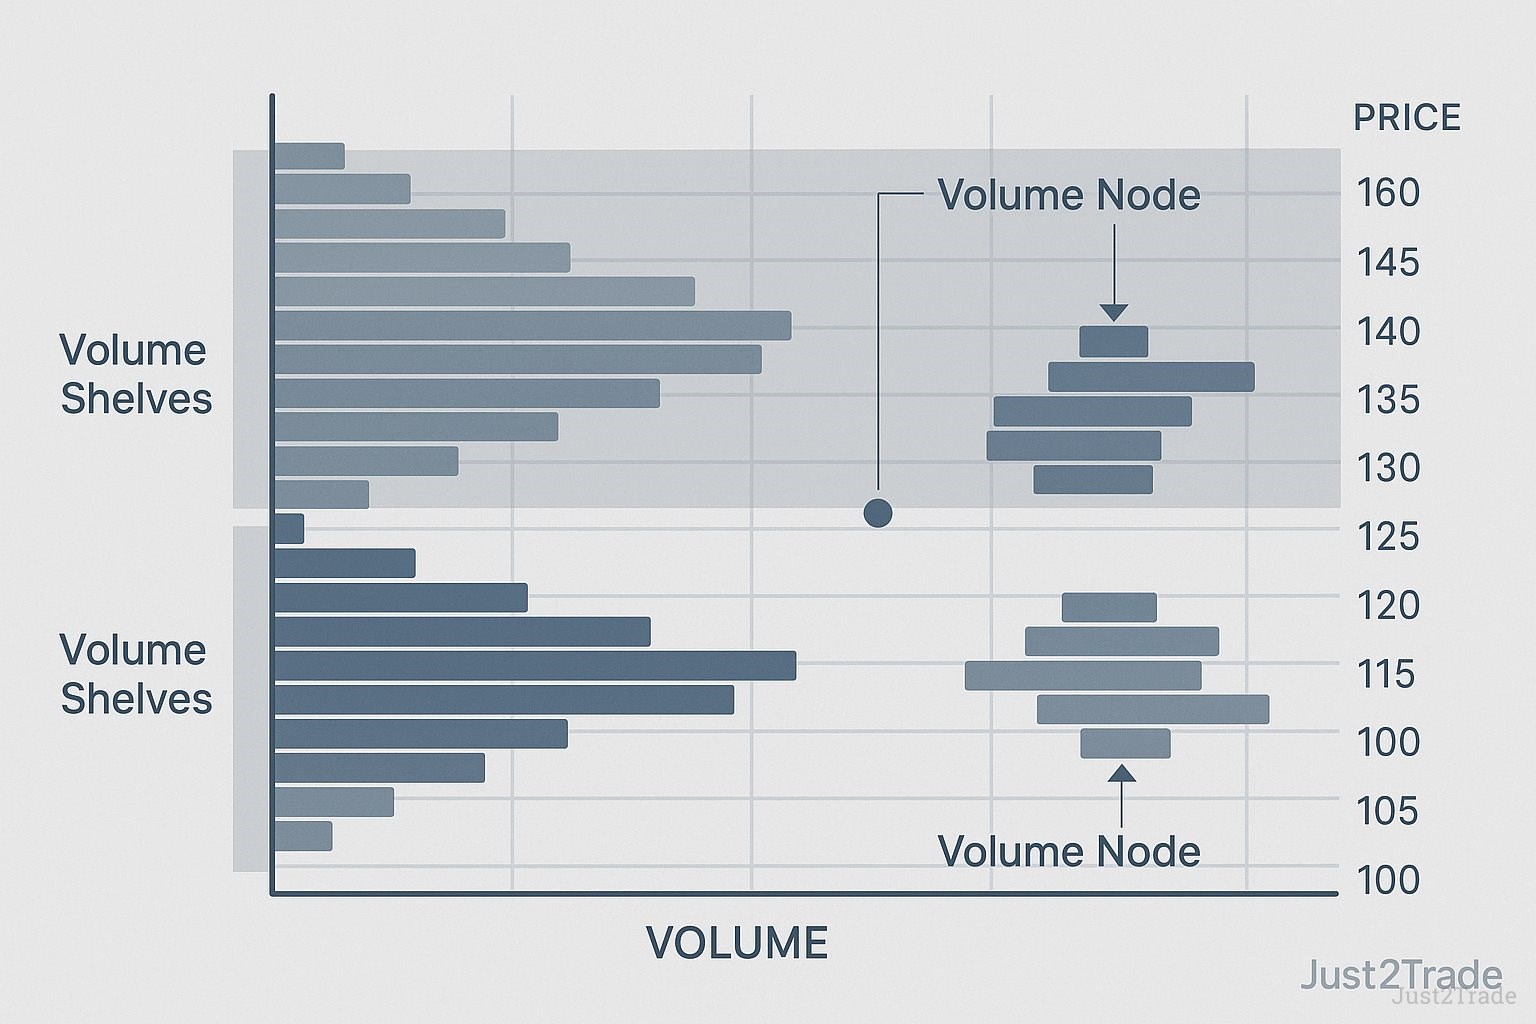
Volume-by-Price (VBP)
Instead of time, VBP focuses on price levels. Imagine horizontal bars stacked next to the chart, showing how much action happened at each price.
Anchored Volume-by-Price (AVP) lets traders pick a starting point — a news event or breakout — and track volume from there.
Big shelves = strong support or resistance. Think of them as price cliffs where buyers and sellers locked horns.
)
Special Considerations
High-frequency algorithmic trading and index funds now dominate most of the market’s rhythm.
According to JPMorgan, passive investors and quant strategies make up over 60% of overall trading volumes. Old-school human traders? Just 10%.
So what does this mean for you? Trading volume statistics now echo machines more than minds. And during holidays or quiet hours, lower trading volumes can make prices jumpy and unreliable.
Traders and Volume of Trade
Volume isn’t just data — it’s insight. Technical analysts lean on it to check trend strength or the impact of news.
If a stock’s price moves on high volume, it’s more likely to stick. Light volume? Might be noise.
Regulations matter too. Rule 144 from the SEC caps how many shares insiders can sell, keeping volume in check.
Average daily trading volume tells traders what’s “normal” — and what might be breaking the pattern.
Volume Trading Strategies
Volume gives away market intent. Here are the go-to strategies pros use:
- Support & Resistance Confirmation – Price meets a wall. Is it a breakout? Look at volume.
- Breakouts & Breakdowns – High volume confirms direction. Low? Expect a fakeout.
- Trend Strength – More volume means stronger trends.
- Volume Divergence – Price goes up, volume fades — watch out.
- Volume Reversals – A sudden spike can mark the end of a move.
- Moving Average of Volume – Smooths the noise. Spot anomalies.
Volume-Based Indicators
Indicators help make sense of volume noise. Here are the heavy hitters:
- On-Balance Volume (OBV) – Cumulative total. Up volume added, down volume subtracted.
- Chaikin Money Flow (CMF) – Combines volume with price pressure.
- VWAP – Volume Weighted Average Price — tells you the average price people paid.
- Accumulation/Distribution (A/D) – Tracks whether buyers or sellers are in charge.
- Money Flow Index (MFI) – A momentum indicator with a volume twist.
- Volume Rate of Change (VROC) – Measures how fast volume is rising or falling.
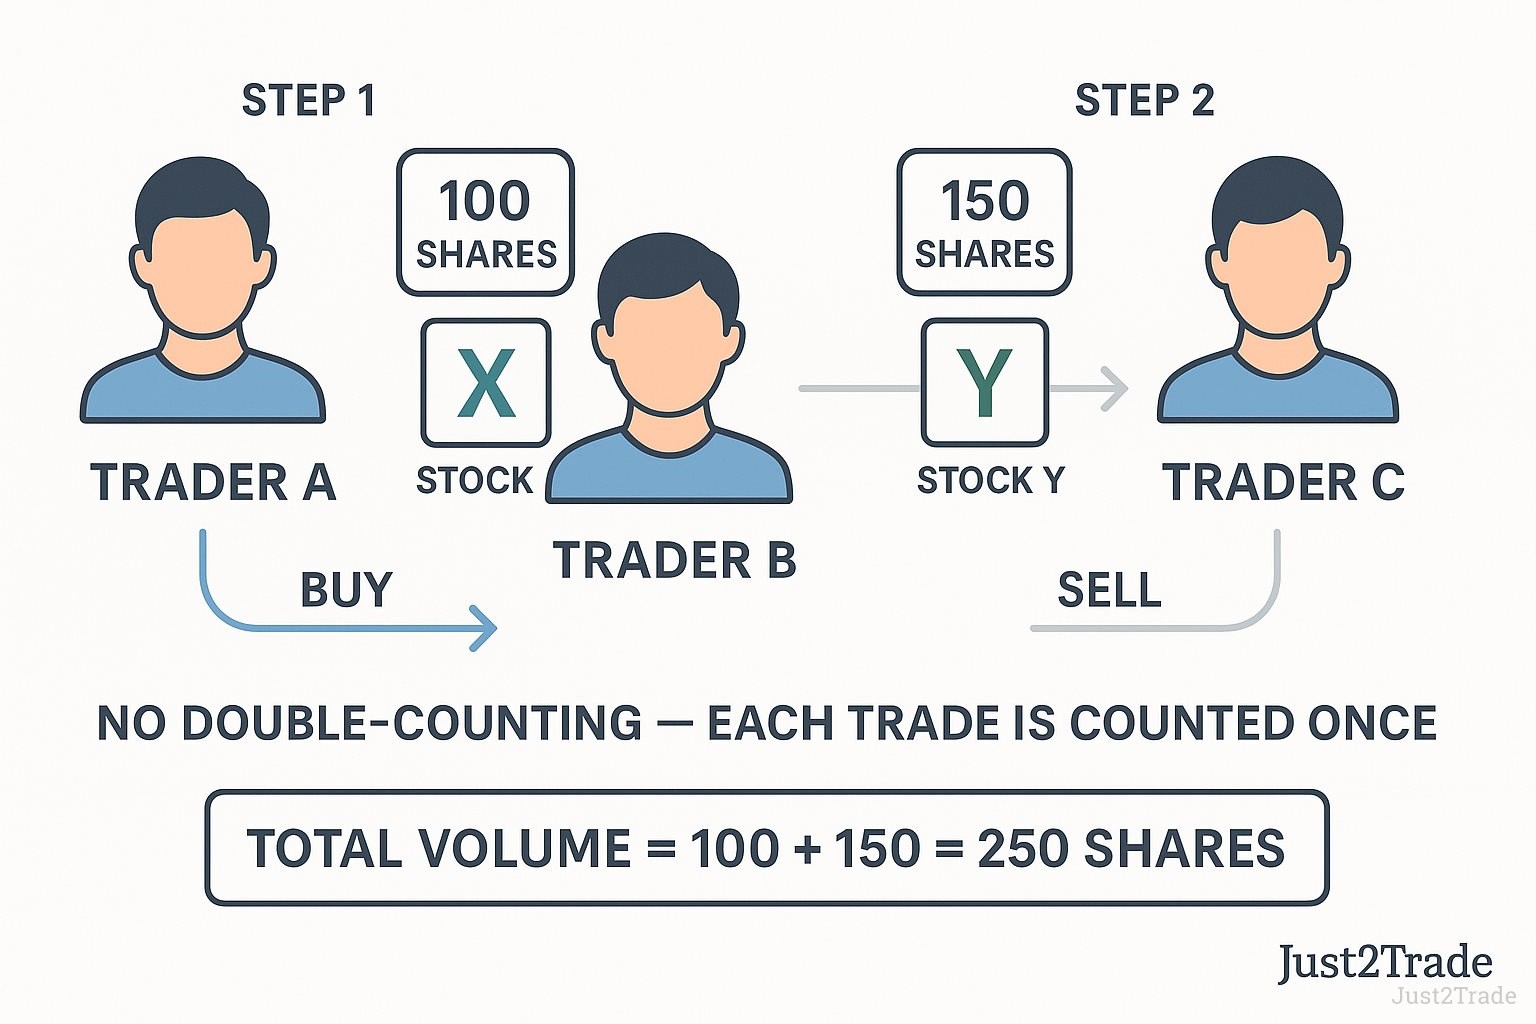
Example of Volume of Trade
Imagine two traders in the market. Trader A buys 100 shares of Stock X from Trader B. Later, Trader B sells 150 shares of Stock Y to Trader C.
What’s the total volume? Easy — 250 shares. Each transaction counts once. Buying and selling the same share isn’t double-counted.
)
Conclusion
Trading volume is the pulse of the market. It tells you when there’s energy — and when there’s hesitation.
But don’t let it guide you blindly. Mix it with other tools, think about your goals, and always manage your risk.
Explore trading tools here: https://j2t.com/pl/solutions/mt5global/
FAQs
What does trade volume mean?
The number of shares or contracts traded for a security in a given period.
What is a good trading volume?
It depends. Higher volume usually means better liquidity and more active interest.
How is trading volume calculated?
It sums up all shares or contracts traded within a specific time frame.
How much is 1 volume in trading?
One volume = one share or one contract traded.
What is an example of a volume of trade?
If A buys 50 shares from B, the trade volume is 50 — not 100.
How to use volume for trading?
Use it to confirm trends, catch breakouts, and read market strength.