Volatility
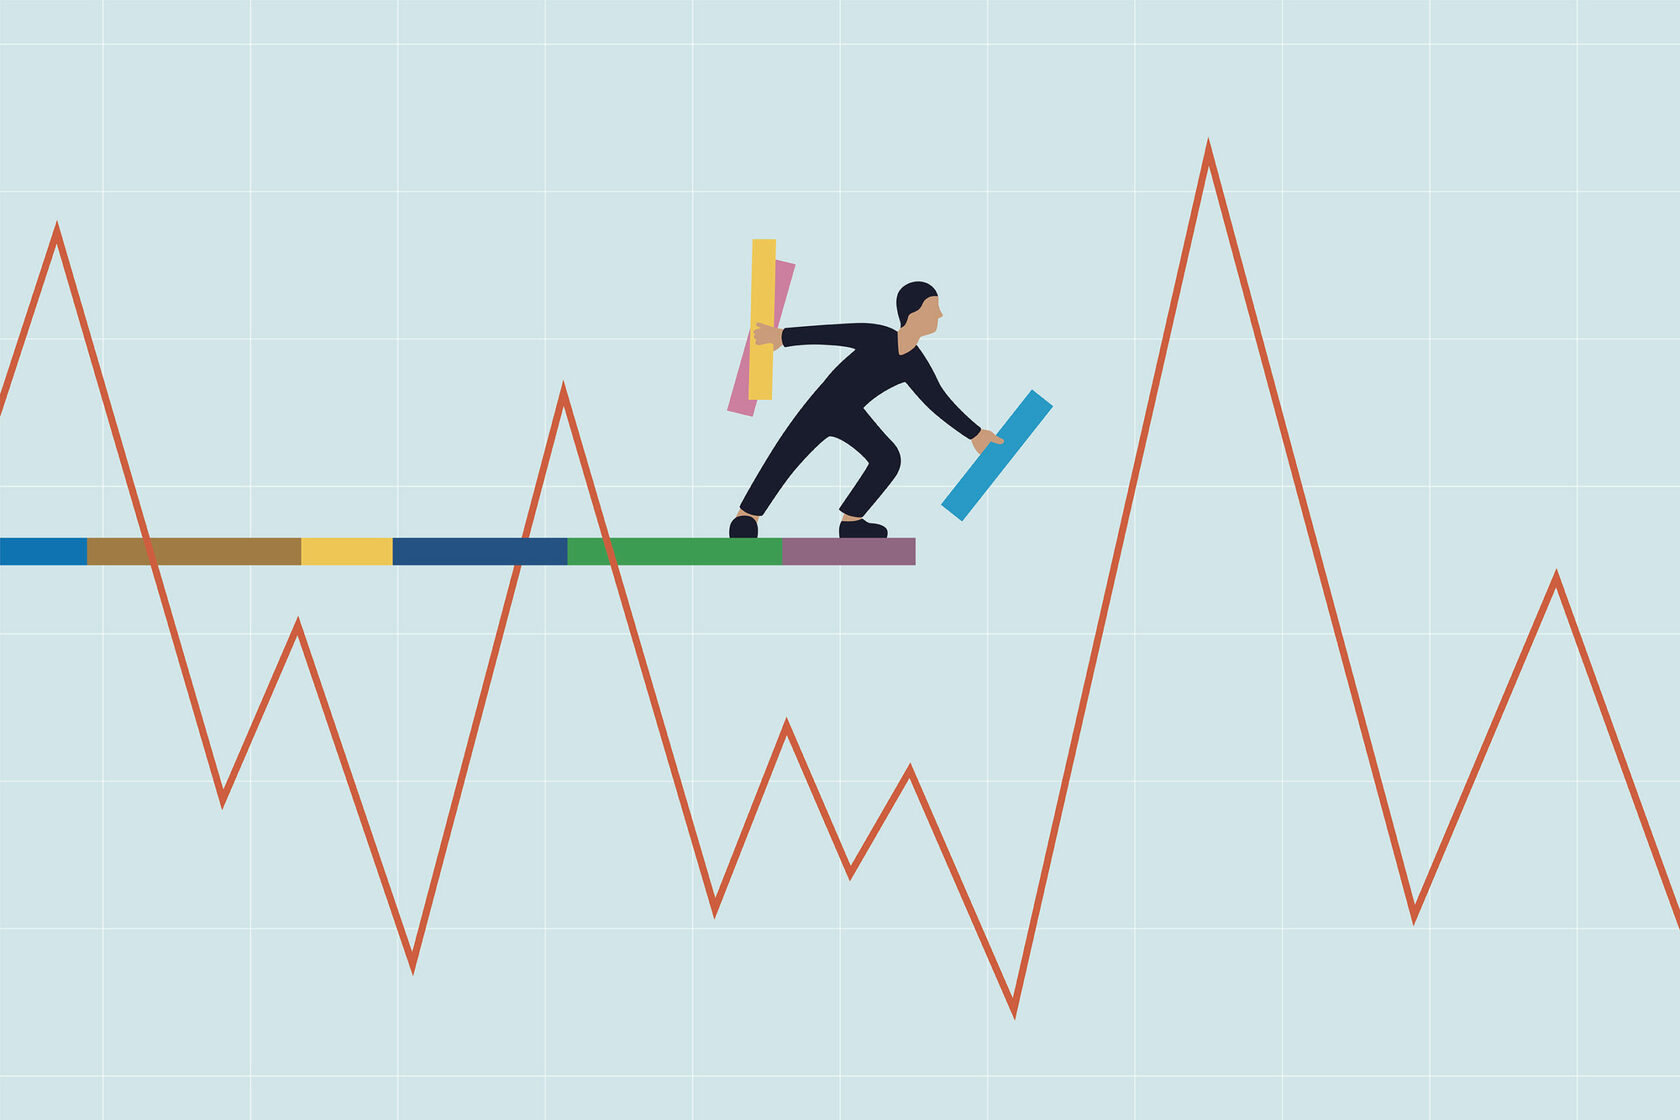
Table of contents:
Key Takeaways
What is Volatility?
Understanding Volatility
Types of Volatility
How to Calculate Volatility
Other Measures of Volatility
How to Handle Market Volatility
Bottom Line
FAQs
Volatility is an important aspect of trading that directly affects your trading or investment strategy and profitability. In this comprehensive guide to volatility, we will cover the types of volatility, how to calculate it, and how to handle market volatility.
Key takeaways:
-
Volatility is the measure of changes in the asset’s prices as a percentage relative to the previous value.
- Volatility can be implied and historical, implied volatility helps to predict future movements and historical one analyzes value changes for past years.
- Volatility can be measured by such indexes as Beta, VIX, or Relative Volatility index.
- Rebalancing, a financial cushion, and patience will help to handle volatility.
What is Volatility?
Volatility is a change in prices by a certain percentage compared to the previous prices for a certain period. Simply put, stock market volatility is the measure of variability, and instability of the value of stocks, currencies, bonds, etc. Higher volatility means strong fluctuations, low volatility means low fluctuations and stability of prices. Volatility is not bad or good, it is simply the nature of the trading floor.
Understanding Volatility
Volatility is always associated with uncertainty and risk. If it is high, the value of a security or currency will spread out over a wide range. If it is low, the price variability will be small. Volatility is often caused by news, or by instability in security or currency when buyers and sellers begin to fight.
Price turbulence is measured as a percentage on both a daily basis and over the long term. Past price swings are based on historical prices, often major historical highs and lows. But it is not how high or how low the price has gone that matters, but how much it has changed as a percentage.
Variance shows how spread out an asset's returns are overall. Price fluctuations focus on that spread within a set time period, like a day, week, month, or year.
Types of Volatility
There are two types of volatility - implied and historical.
Implied Volatility
Implied volatility is based on recent asset values. Implied volatility estimates how much the prices will fluctuate shortly. Implied volatility includes the current exchange price, pricing model, average price, and mathematical changes. All this helps to calculate implied volatility.
Historical Volatility
Historical volatility is an indicator over the last 30, 60, or 90 days. To calculate it, statistical data on the prices is collected: calculation of the standard fluctuations, maximums, and minimums of the value for a certain period. Historical fluctuations can be converted to annual ones using the formula below. It does not provide information about future fluctuations, it only estimates what fluctuations happened in the past. Historical price swings are needed to assess the risks of an asset, to compare assets, to find the annualized volatility and statistical volatility.
How to Calculate Volatility
Volatility is figured out using variance and standard deviation. Standard deviation is just the square root of variance. Since volatility measures the changes over a certain time period, you take the standard deviation and multiply it by the square root of the number of time periods.
Volatileness = σ√T
where:
σ = standard deviation of returns
T = number of periods in the time horizon
Let's imagine two stocks, Stock A and Stock B, that both increased in value by 10% over a year. While they might seem similar, their daily price movements are quite different.
- Stock A: This stock tends to move gradually, up 0.1% or down 0.05% each day.
- Stock B: Stock B is more volatile, jumping up 0.5% or dropping 0.4% on average.
Even though both stocks ended up with the same overall gain, Stock B is much more volatile.
To calculate the fluctuation, we need to consider the standard deviation.
- Standard Deviation: Stock A has a standard deviation of 0.075%, while Stock B has a standard deviation of 0.45%. This means Stock B's price changes more drastically daily than Stock A's.
- Annual Volatility: To find it, we multiply the standard deviation by the square root of the number of trading days in a year (about 250).
* Stock A's Annual Volatility: 0.075% x √250 = 1.18%
* Stock B's Annual Volatility: 0.45% x √250 = 7.11%
This shows that while both stocks experienced a 10% gain over the year, Stock B is much riskier due to its larger price swings.
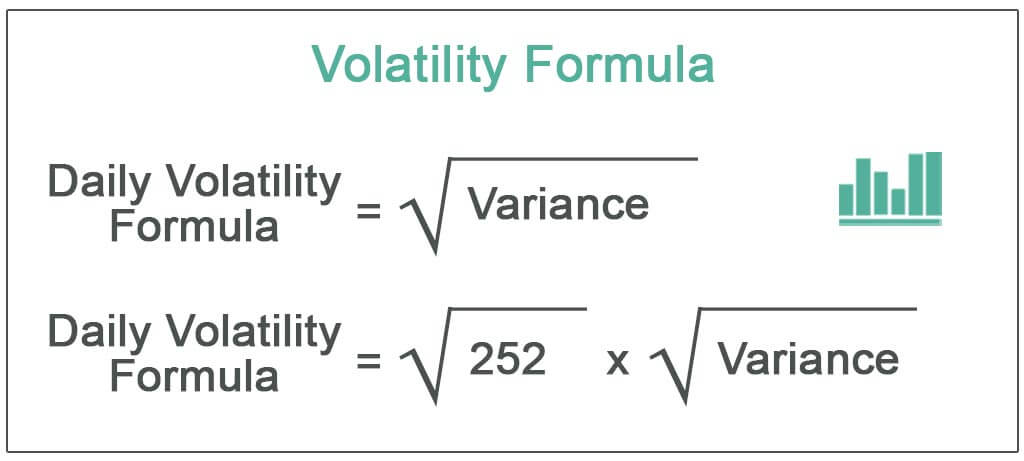
Daily Volatility = √Variance
Daily Volatility = √252 × √Variance
There is also another way to calculate volatileness, not through a formula, but step by step:
- Calculate the average price: Add up the stock prices for each day and divide by the number of days.
- Find the difference: Subtract the average value from each day's price.
- Square the differences: Square each of the differences you calculated in step 2.
- Sum the squared differences: Add up all the squared differences.
- Calculate the variance: Divide the sum of squared differences by the number of days.
- Find the standard deviation: Take the square root of the variance.
You want to find out the volatility of the stock of ABC Corp. for the past four days. The stock prices are given below:
Day 1 – $15
Day 2 – $17
Day 3 – $14
Day 4 – $18
To calculate the volatileness of the prices, we need to:
Find the average price:
$15 + $17 + $14 + $18 / 4 = $16
Calculate the difference between each price and the average price:
Day 1: 15 – 16 = -1
Day 2: 17 – 16 = 1
Day 3: 14 – 16 = -2
Day 4: 18 – 16 = 2
Square the difference from the previous step:
Day 1: (-1)2 = 1
Day 2: (1)2 = 1
Day 3: (-2)2 = 4
Day 4: (2)2 = 4
Sum the squared differences:
1 + 1 + 4 + 4 = 10
Find the variance:
Variance = 10 / 4 = 2,5
Find the standard deviation:
Standard deviation (approximately) = 1.58 (square root of 2,5)
The standard deviation indicates that the stock price of ABC Corp. usually deviates from its average stock value by $1.58.
Other Measures of Volatility
Beta
Beta (β) is like a way to measure how much a stock's price moves compared to the overall exchange. It shows how much the stock's value changes for every 1% change in the market, usually measured against the S&P 500.
For example, a stock with a beta of 1.1 will move 110% for every 100% move in the S&P 500. A stock with a beta of 0.9 will move 90% for every 100% move in the S&P 500.
The VIX
Another way to measure variability is with the VIX (Volatility Index).
The VIX (or Cboe volatility index) was created by Chicago Mercantile Exchange traders as a measure of 30-day expected turbulence in the U.S. stock market, derived from real-time quotes for S&P 500 call and put options.
Investors and traders can use the VIX as a predictor of risk or stability. High VIX readings indicate high volatility and a risky market, while low readings indicate a calm one.
How to Handle Market Volatility
Volatileness is not as scary as it seems, moreover, if you trade on the exchange, it can play into your hands, since only in volatile markets can you earn. No value movements - no earnings. There are several ways to cope with volatility and benefit from it, which we will consider below.
Remember Your Long-Term Plan
If you are investing long term, you should be prepared for volatility. Stocks cannot be stable all the time, you will have to overcome fear and greed. And also remember that if you are investing long-term, it should be money you will not touch for some period of time or for several years. There will be moments when your investment portfolio will be in a drawdown, and if you withdraw money at that moment, you will lose. Therefore, the best thing you can do once you have entered a position is to wait during the short-term volatility.
Consider Market Volatility an Opportunity
You can benefit from instability by buying more shares at discounted prices. But there is one important condition, these should be those shares that have shown growth over many years, and a fall for them is not a general trend but rather a temporary anomaly. You must make sure that you have carefully analyzed the asset and are confident in its future growth. With these factors, you can buy more shares if the prices have fallen. But do not get carried away with this, especially if the prices continue to fall.
Keep a Healthy Emergency Fund
This point is necessary not only for investors, but also for all people, especially for investors - to have a financial safety cushion. If you live off investments and this is your main income, then you should have funds in case the market declines or there is simply a series of unsuccessful deals - this happens even to experienced investors. In order not to go into tilt and always maintain common sense, you must first of all take care of what you will live on. That is why a financial safety cushion is necessary. Usually, this is the amount on which you can live for 3-6 months without changing your lifestyle. But the older you get, the larger your financial cushion should become. And besides, this is not necessarily money that will gather dust in your safe, it can be stable bonds, precious metals, stable funds, something that instills confidence and gives you a sense of safety.
Rebalance Your Portfolio as Necessary
Portfolio rebalancing is the restoration of the original percentage ratio of stocks in the portfolio. Let's say your portfolio initially consisted of 30% of stock A and 70% of stock B. But stock A has grown and accounts for 35% of your portfolio. To ensure a more stable and safe portfolio, you need to buy more stock B so that they again account for 70% of your portfolio.
Portfolio rebalancing should be done in order to maintain the original level of risk. If we refer to the example above, let's imagine that stock A is more volatile, yes, at some point, they showed growth, but this does not mean that at some other point they will not be able to show a loss. If the percentage of risky stock A in your portfolio has grown from 30% to 35%, this means that the riskiness of your portfolio has also increased. Therefore, to restore the previous level of risk, you need to buy more stock B.
Bottom Line
In this comprehensive guide, we have covered all the important topics regarding volatility. Volatility can be your friend or your enemy. Your task on the exchange is to make volatility work for you, or at least not cause significant financial damage, and we hope that this article will help you with this.
FAQs
What Does High Volatility Mean?
High volatility means a large change in value in percentage terms, both up and down.
Is Volatility the Same As Risk?
It can be considered one component of risk in the stock market, but it is not the only risk factor.
What Is Volatility, Mathematically?
Volatility is the deviation of the price from the previous value by n percent.
Is Volatility a Good Thing?
Volatility is both a good and a bad thing. The advantage is that it is thanks to market instability that you can earn money, and the disadvantage is big price swings or a value deviation in an unfavorable direction for you.
How Is Volatility Used?
It is used to assess risk and potential returns. Investors use it to understand how much a stock's value might fluctuate and make informed decisions about buying, selling, or holding assets. It's also used to price options and other derivatives.