What is Inflation? Complete EU Economic Guide 2026
Table of Contents
Inflation Definition and Economic Impact
How Inflation Is Measured and Calculated in the EU
How the European Central Bank Controls Inflation
What Happens During Inflation: Effects on Consumers and Business
Why the 2% Inflation Target Matters
Inflation Facts: Historical Context and Current EU Trends
Managing Personal Finances During Inflation
Current EU Inflation Outlook and Future Trends
Conclusion: Understanding What Is Inflation in the European Economic Context
Frequently Asked Questions About Inflation
Inflation is the sustained rise in the general price level of goods and services over time, which gradually erodes the purchasing power of your money. Think of it this way: if a basket of groceries cost you €50 last year and now costs €51, that's roughly 2% inflation at work.
Across the European Union, inflation is tracked monthly by Eurostat through the Harmonised Index of Consumer Prices (HICP) — a standardised measure that allows direct comparison between all EU member states. The European Central Bank (ECB) targets a symmetric 2% annual inflation rate over the medium term, using monetary policy tools such as interest rates and quantitative easing to keep price growth stable and predictable.
As of January 2026, euro area annual inflation stood at just 1.7% — the lowest reading since September 2024 and notably below the ECB's target. Yet individual EU economies paint very different pictures: Germany at 2.1%, Spain at 2.4%, France at a mere 0.4%.
Understanding what inflation is and how it differs across countries like Germany, Spain, and Poland is essential for anyone managing money, running a business, or simply trying to keep household budgets on track.
Inflation Definition and Economic Impact
So what is inflation, exactly? At its core, inflation means your currency buys less over time. It's not about a single product getting pricier — it's the broad, economy-wide trend of rising price levels across thousands of goods and services simultaneously.
Economists typically distinguish three root causes:
- Demand-pull inflation — consumers and businesses compete for a limited supply of goods, bidding prices up. Surging demand effectively "pulls" the price level higher.
- Cost-push inflation — production costs climb (raw materials, energy, wages), and companies pass those increases on to buyers. The supply side "pushes" prices up.
- Built-in inflation — a self-reinforcing cycle where workers expect prices to rise, demand higher wages, and those higher labour costs feed back into higher prices. Expectations become reality.
In the EU context, inflation directly shapes the cost of living for roughly 450 million people. When inflation rises faster than wages, households feel a purchasing power decline — each euro stretches a little less at the supermarket, the petrol station, and the rent office.
For savers, inflation quietly erodes the real value of deposits. For borrowers, moderate inflation can actually be helpful: it shrinks the real burden of fixed-rate debt over time.
The economic impact extends far beyond individual wallets. Businesses must adjust pricing strategies and renegotiate supplier contracts. Governments see tax revenues shift. Central banks must calibrate policy to prevent inflation from spiralling out of control — or, equally dangerous, from falling too low.
Understanding Purchasing Power and Price Changes
Here's a practical example that makes this tangible.
Suppose you earned €3,000 per month in 2020. If cumulative inflation over the following five years totalled around 20% (as many EU households experienced during the 2021–2023 surge), your €3,000 in 2020 purchasing power would require roughly €3,600 in 2025 just to buy the same goods.
This is why the concept of real income matters more than nominal income. Your payslip might show a 10% raise, but if inflation ran at 12% over the same period, your real purchasing power actually fell.
Personal inflation can also differ significantly from the national rate. A household spending heavily on energy and food — which tend to be more volatile categories — may experience a higher effective inflation rate than the headline figure suggests.
Tip: Germany's Federal Statistical Office (Destatis) offers a personal inflation calculator where you can adjust spending weights to estimate your own rate. It's a brilliant tool — try it.
How Inflation Is Measured and Calculated in the EU
To understand how does inflation work in practice, we need to look at how it's measured. Across the European Union, inflation measurement rests on the Harmonised Index of Consumer Prices (HICP) — developed to enable apples-to-apples comparison across all member states.
The HICP uses the same methodology everywhere and is compiled jointly by Eurostat — the EU's official statistical authority operating under a legislative mandate from the European Parliament and Council (Regulation EU 2016/792) — and national statistical institutes in each member state.
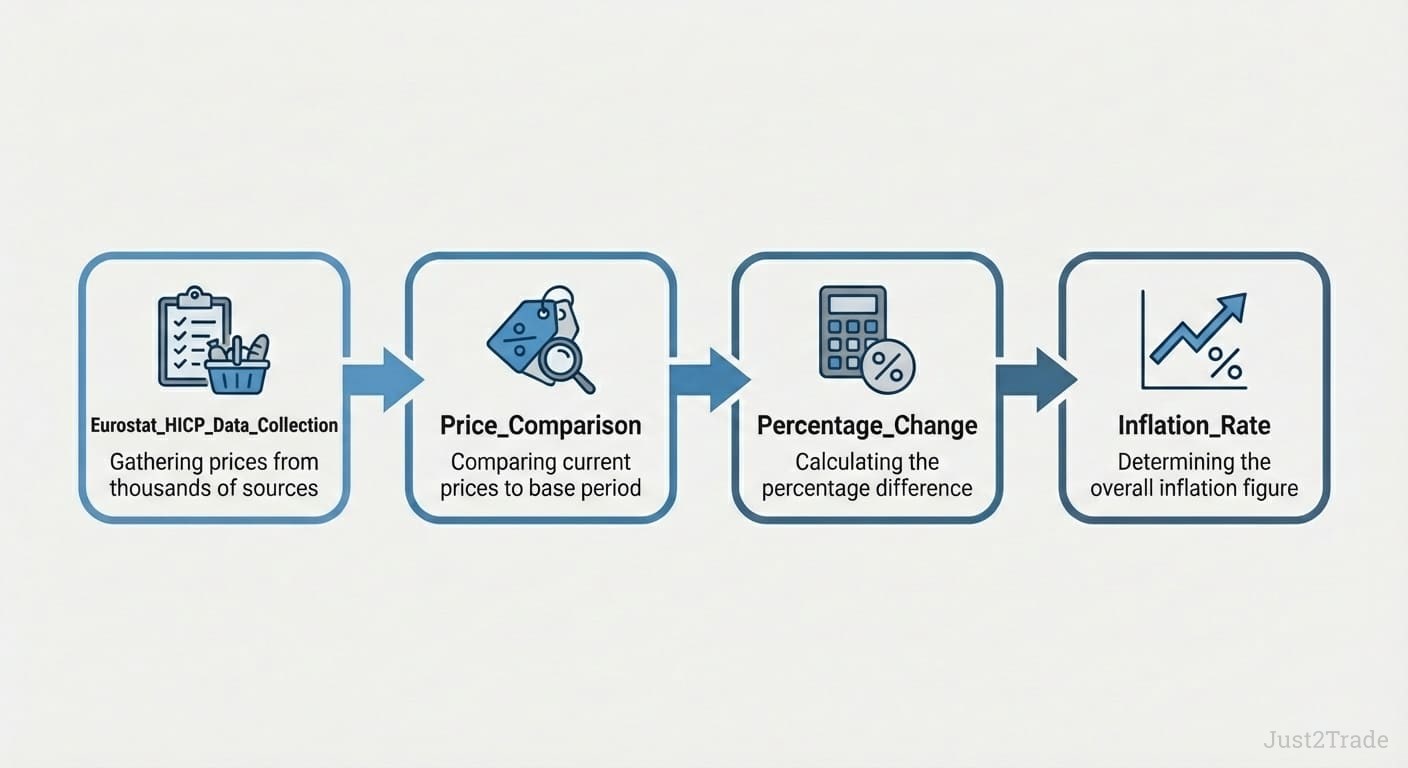
The HICP basket covers hundreds of representative goods and services classified across detailed ECOICOP categories— from specific food items and clothing to healthcare, transport, digital services, and (as of 2026) games of chance. Here's how the process works:
- Price collection — each EU country's national statistical office gathers prices every month from thousands of retail outlets, service providers, and online sources.
- Basket composition — prices are tracked for a comprehensive basket of consumer goods and services, from bread and bus tickets to smartphones and streaming subscriptions.
- Weighting — Eurostat aggregates national data into euro area and EU-wide figures, weighting each country's contribution by its share of total household spending.
- Publication — a flash estimate is released at month-end; full detailed data follows roughly two weeks later.
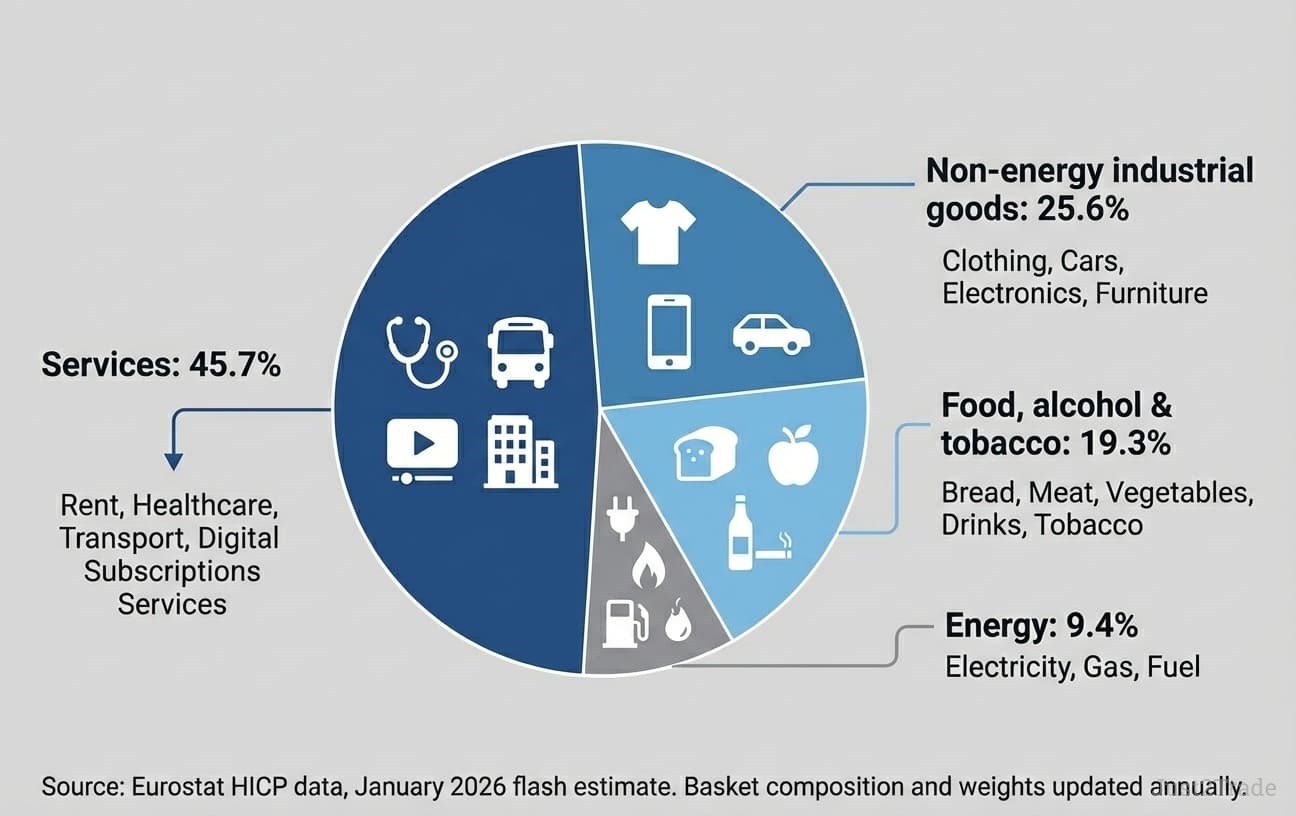
The HICP component weights for 2025 reveal which categories carry the most influence:
| Category |
Weight in HICP (%) |
Jan 2026 Annual Rate |
| Services |
45.7% |
+3.2% |
| Non-energy industrial goods |
25.6% |
+0.4% |
| Food, alcohol & tobacco |
19.3% |
+2.7% |
| Energy |
9.4% |
-4.1% |
Source: Eurostat HICP data, January 2026 flash estimate
Despite its relatively small weight, energy is notorious for driving short-term volatility — as European consumers learned painfully during 2022 when energy prices skyrocketed following Russia's invasion of Ukraine. In January 2026, the dynamic reversed: energy prices plunged 4.1% year-on-year, dragging headline inflation well below target.
The Consumer Basket: What Gets Tracked and How
The basket composition is updated annually to reflect evolving spending patterns. As of February 2026, the HICP transitioned to a new classification system — ECOICOP version 2 — aligned with the UN's COICOP 2018 standard, with the index reference period rebased to 2025=100. This update also added games of chance to the index for the first time.
National differences are notable:
- Germany — Destatis calculates both a national CPI (which includes owner-occupied housing costs and broadcasting fees) and the HICP (which does not). This is why German CPI and HICP readings sometimes diverge.
- Spain — INE publishes monthly CPI and HICP data, with flash estimates released at month-end.
- Poland — GUS (Statistics Poland) tracks its own CPI alongside the harmonised EU measure, reflecting items specific to Polish consumption patterns.
Technical Definition of Inflation Rate Calculation
So what is inflation rate in precise terms? It is the percentage change in the HICP between the current month and the same month one year earlier:
Inflation Rate (%) = [(HICP current period − HICP same period last year) ÷ HICP same period last year] × 100
For example, if the euro area HICP index stood at 100 in January 2025 and rose to 101.7 by January 2026, the annual inflation rate would be 1.7% — precisely what Eurostat's flash estimate reported.
Technically, the HICP is computed as a chain-linked Laspeyres-type index. In plain language, it measures price changes against a basket that is kept conceptually fixed within each year but updated annually to stay representative. This approach balances accuracy with comparability over time.
How the European Central Bank Controls Inflation
Understanding how inflation works at the policy level means understanding the ECB. The ECB's primary mandate, set out in the Treaty on the Functioning of the European Union, is to maintain price stability. Following its 2021 strategy review, the Governing Council defined this as a symmetric 2% inflation target over the medium term.
"Symmetric" is the key word here. It means the ECB views both undershooting and overshooting the target as equally undesirable — a departure from its earlier, more ambiguous formulation of "below, but close to, 2%."
The ECB's key decisions are made by the Governing Council — comprising the six members of the Executive Board plus the governors of all euro area national central banks (21 as of January 2026, following Bulgaria's accession). The Council meets every six weeks to assess economic conditions and vote on monetary policy.
After a dramatic tightening cycle that raised the deposit facility rate from 0.5% to 4% between July 2022 and September 2023, the ECB reversed course in 2024 with eight consecutive rate cuts.
As of February 2026, the ECB has held rates steady for five consecutive meetings:
- Deposit facility rate: 2.00%
- Main refinancing rate: 2.15%
- Marginal lending facility rate: 2.40%
Interest Rates and Monetary Policy Transmission
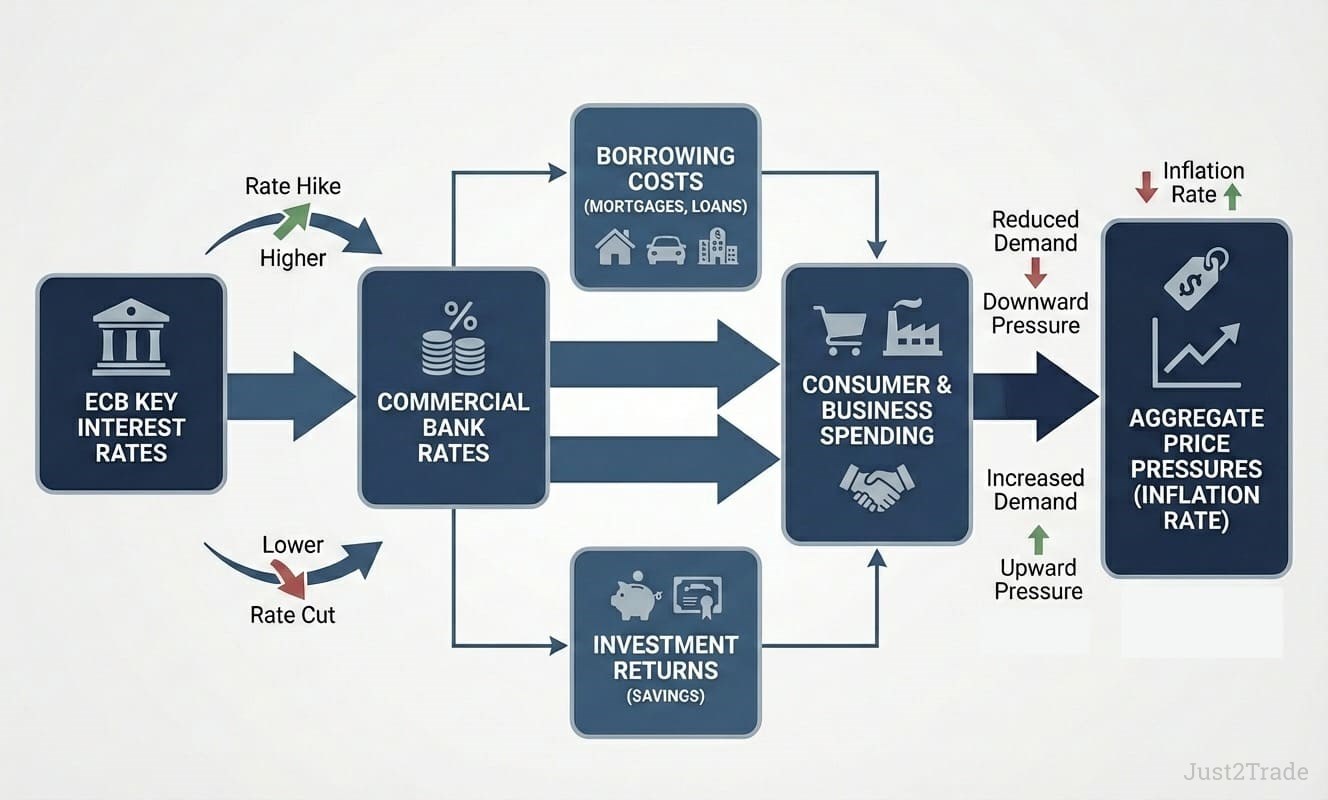
When the ECB adjusts its key rates, the monetary policy effects cascade through the economy — but not instantly. Policy transmission typically takes 12 to 24 months to fully impact inflation. Here's the chain:
ECB Deposit Rate → Commercial Bank Rates → Consumer & Business Borrowing Costs → Spending & Investment Patterns → Aggregate Price Pressures → Inflation Rate
In practice, this means:
- Rate cuts make borrowing cheaper → mortgage rates fall, business loans get more affordable → spending increases → prices face upward pressure.
- Rate hikes make borrowing costlier → consumer credit tightens, investment slows → spending decreases → price growth moderates.
President Christine Lagarde reiterated in February 2026 that the Governing Council follows a "data-dependent and meeting-by-meeting approach" without pre-committing to a particular rate path." With January inflation at 1.7% — below the 2% target — some economists expect the debate around further cuts to reignite, particularly if the strong euro continues pushing import prices lower.
Quantitative Easing: The ECB's Emergency Toolkit
When conventional interest rate cuts approach their effective lower bound, the ECB turns to quantitative easing (QE) — large-scale purchases of government bonds and other securities on the open market.
The mechanism works through several channels:
- The ECB buys bonds from banks, increasing their reserves and encouraging more lending.
- Greater bond demand pushes long-term interest rates down, making mortgages and business loans cheaper.
- The expanded money supply stimulates consumer spending and business investment.
The ECB deployed QE aggressively during 2015–2018 and again during the pandemic through the Pandemic Emergency Purchase Programme (PEPP). As of early 2026, the Eurosystem is no longer reinvesting proceeds from maturing bonds, gradually shrinking its portfolio — a process sometimes called "quantitative tightening."
What Happens During Inflation: Effects on Consumers and Business
Inflation's effects are neither universally negative nor universally positive. Moderate, stable inflation — the kind central banks target — is generally healthy. It encourages spending and investment (why sit on cash if it's slowly losing value?), allows for smoother wage adjustments, and provides a buffer against the much more dangerous phenomenon of deflation.
Problems emerge when inflation becomes high, volatile, or unpredictable:
- Households find budgets squeezed as food, energy, and housing costs outpace wage growth.
- Savers watch the real value of deposits erode — a savings account earning 1% while inflation runs at 3% means you're losing purchasing power every day.
- Pensioners on fixed incomes suffer disproportionately, since their payments may not keep pace with rising prices.
- Borrowers with fixed-rate debt, paradoxically, benefit — inflation shrinks the real burden of their obligations over time.
During the 2021–2023 surge, EU households experienced these effects acutely. Euro area inflation peaked at 10.6% in October 2022, driven largely by soaring energy prices. Grocery bills rose by double digits in many member states, and energy costs — despite carrying only a 9.4% HICP weight — dominated headlines and household anxieties.
Inflation's Impact on Business Operations
For businesses, inflation creates a multi-front challenge that touches every aspect of operations:
- Input costs rise — raw materials, components, transport, and wages all become pricier.
- Pricing dilemmas emerge — absorb higher costs (squeezing margins) or pass them to customers (risking demand)?
- Supply chains tighten — when a German manufacturer sees steel prices jump while energy bills double, those pressures flow downstream to every customer.
- Long-term planning gets harder — investment decisions, hiring commitments, and contract pricing all become more uncertain.
On the positive side, companies with pricing power and strong brands typically navigate inflationary periods better. And firms carrying fixed-rate debt benefit as inflation reduces the real burden of their repayments — the same dynamic that helps mortgage holders.
Why the 2% Inflation Target Matters
Why 2%? Why not aim for zero inflation, or even let prices fall?
The answer comes down to economics and risk management. The ECB explains that a 2% target is low enough for consumers and businesses to enjoy the benefits of price stability, yet high enough to provide three crucial safeguards:
- Buffer against deflation — a sustained fall in prices discourages spending, triggers job losses, and can spiral into recession. The 2% margin prevents the economy from accidentally tipping into this dangerous territory.
- Room for policy response — if rates are already at zero during a period of zero inflation, the ECB has no conventional tools left. A positive inflation target gives the central bank working space to cut rates during downturns.
- Measurement bias cushion — price indices may slightly overstate quality improvements, so a small positive target accounts for potential statistical distortions in the HICP itself.
Since the 2021 strategy review, the ECB's target has been explicitly symmetric: overshooting and undershooting are treated as equally problematic. This matters especially now — with January 2026 inflation at 1.7%, the euro area is actually below target, raising questions about whether the ECB might need to ease policy further.
Deflation Risks and Economic Stability
Deflation — a sustained fall in the general price level — sounds appealing on the surface. Who doesn't want cheaper goods? But the economic reality is treacherous.
When consumers expect prices to drop, they delay purchases. That reduced demand forces businesses to cut prices further, lay off workers, and scale back investment. The result is a deflationary spiral:
Falling prices → delayed spending → lower output → layoffs → further price drops → even less spending…
Japan's experience from the 1990s through the 2010s illustrates how difficult it is to escape such a cycle once it takes hold. The country endured over two decades of near-zero or negative inflation, with the Bank of Japan struggling to stimulate growth despite radical monetary measures.
That's precisely why the ECB maintains its 2% target rather than aiming for zero. The small positive margin ensures the economy doesn't accidentally tip into deflation during downturns.
Inflation Facts: Historical Context and Current EU Trends
The 2021–2023 Surge and Recovery
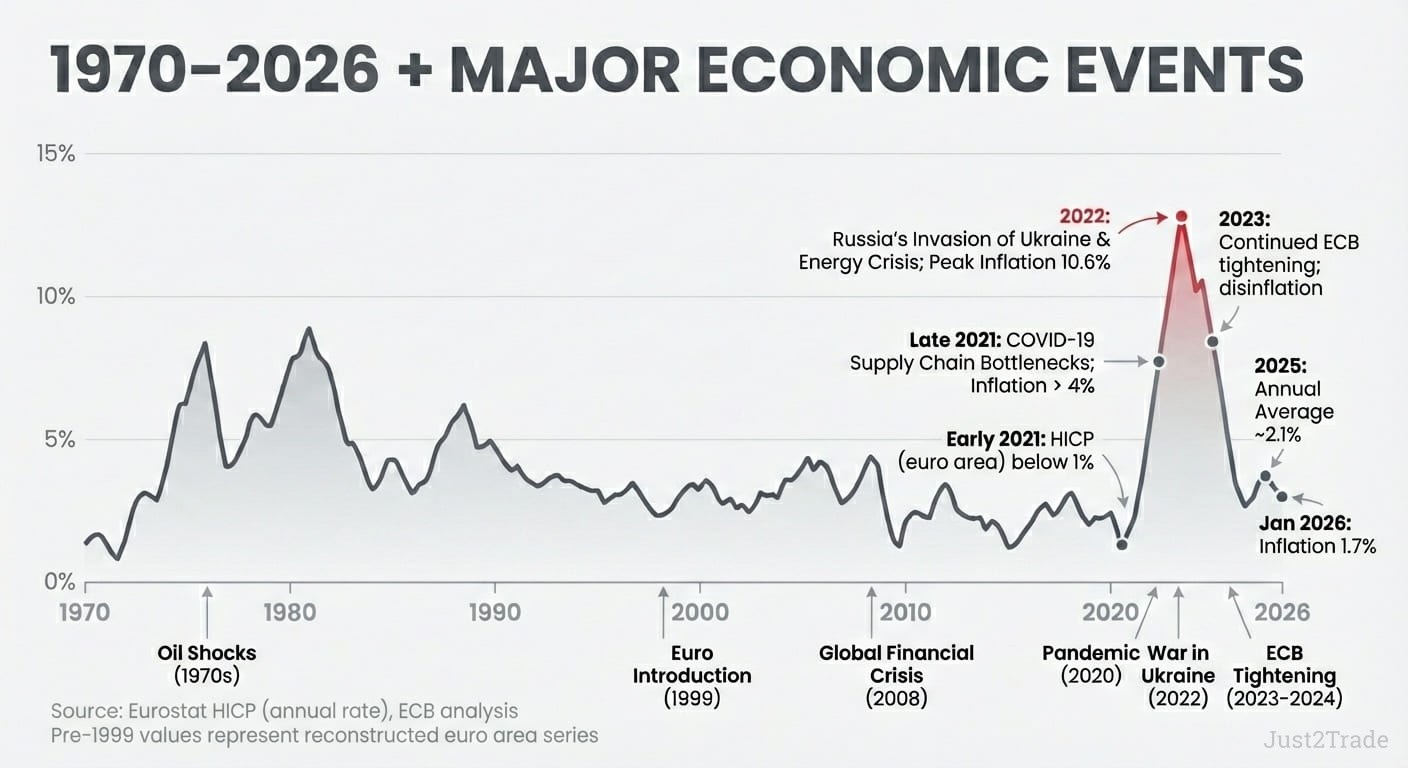
The recent inflation wave was the most severe price shock Europe had experienced in decades. Here's how it unfolded:
- Early 2021 — euro area HICP inflation sat below 1%, seemingly well-contained.
- Late 2021 — supply chain bottlenecks from COVID-19 pushed prices higher; inflation crossed 4%.
- 2022 — Russia's invasion of Ukraine triggered an energy crisis. Natural gas and electricity prices surged. Euro area inflation peaked at 10.6% in October 2022.
- 2023 — ECB rate hikes began to bite; inflation gradually receded through the year.
- 2025 — the annual average for the euro area settled at approximately 2.1%, back near target.
- January 2026 — headline inflation dipped to 1.7%, below the ECB's 2% target for the first time since late 2024.
Country Snapshots: Germany, Spain, and Poland
Inflation across EU member states remains far from uniform. Here's where our three priority markets stand:
Germany
Europe's largest economy recorded an average annual inflation rate of 2.2% in 2025 (HICP: 2.3%), with the monthly rate dipping to 1.8% in December before rebounding to 2.1% in January 2026.
Key dynamics:
- Services inflation remained elevated at 3.2%, partly driven by the Deutschlandticket price increase from €58 to €63.
- Energy prices declined 1.7% year-on-year, providing consumer relief.
- Food prices jumped — notably chocolate (+21.0%) and beef (+14.9%), while butter fell sharply (-33.0%).
- Core inflation (ex food and energy) stood at 2.5%.
Spain
Annual inflation came in at 2.3% in January 2026 (revised down from the initial 2.4% estimate), falling from 2.9% in December — the third consecutive monthly decline.
Key dynamics:
- Core inflation remained sticky at 2.6% for the third straight month.
- Electricity price growth slowed significantly (3.7% vs. 12.6% in December).
- Fuel costs dropped notably: gasoline -7.4%, diesel -5.9%.
- The European Commission forecasts HICP inflation easing to 2.0% in 2026.
Poland
Although not in the eurozone (Poland uses the złoty), Poland is a crucial EU economy. Annual inflation eased to 2.2% in January 2026, the lowest since early 2024.
Key dynamics:
- Food and non-alcoholic beverages rose 2.4% year-on-year; housing costs climbed 2.9%.
- Alcoholic beverages and tobacco surged 7.0% due to excise tax hikes.
- Fuel prices fell 7.1%, providing significant offset.
- The Narodowy Bank Polski (NBP) targets 2.5% ±1 percentage point. The European Commission projects Polish HICP inflation at 2.9% in 2026, with the ETS2 carbon pricing potentially lifting energy costs in 2027.
Inflation Comparison Table — January 2026
| Country |
Annual Rate |
Core Rate |
Key Upward Driver |
Key Downward Driver |
| Euro area |
1.7% |
2.2% |
Services (+3.2%) |
Energy (-4.1%) |
| Germany |
2.1% |
2.5% |
Services |
Energy (-1.7%) |
| Spain |
2.3% |
2.6% |
Food & beverages |
Fuel prices |
| Poland |
2.2% |
~2.5% |
Excise taxes, housing |
Fuel (-7.1%) |
| France |
0.4% |
— |
— |
Electricity tariff cuts |
Hyperinflation: The Extreme Warning
While today's EU inflation figures are modest, history offers stark reminders of what happens when monetary policy fails catastrophically.
Zimbabwe's hyperinflation of 2008 remains the most dramatic modern example. Prices were doubling every 24 hours, with the monthly inflation rate reaching an estimated 79.6 billion percent in November 2008. A $100 trillion banknote couldn't buy a bus ticket. The Reserve Bank of Zimbabwe had resorted to printing money to fund government spending, destroying public trust in the currency entirely.
Closer to European memory, the Weimar Republic's 1923 hyperinflation — experienced in what is now Germany — remains embedded in the continent's collective economic consciousness. It's one reason the ECB's price stability mandate is taken so seriously, and why the Bundesbank traditionally advocated for particularly hawkish monetary policy.
International Inflation Comparisons
Most major central banks worldwide share the 2% target — the US Federal Reserve, the Bank of Japan, and the Bank of England all pursue similar goals, though instruments and definitions differ slightly.
The OECD projects that for 2026:
- Apart from Turkey (18.5%), no European country will exceed 3.7% inflation.
- The lowest rate is expected in Switzerland (0.6%), followed by France (1.7%).
- Among major economies: Germany is projected at 2.13%, Spain at 1.91%, Italy at 1.88%.
- Hungary (3.6%) and Romania (3.4%) face the highest rates in the EU.
Managing Personal Finances During Inflation
If you're wondering what inflation means for your money, here's the practical takeaway: cash sitting idle in a savings account earning 1% while inflation runs at 2% is losing real value every day. That doesn't mean you should panic — it means you should be strategic.
Consider these approaches:
- Diversify savings into assets that historically keep pace with inflation — broadly diversified equity index funds, real estate, and inflation-linked bonds (like euro area inflation-linked government securities) are all worth exploring.
- Review your debt structure — during rising inflation, fixed-rate mortgages protect you from escalating payments. During falling inflation, variable rates may offer savings.
- Track your personal inflation — your spending patterns differ from the HICP average. Monitor which categories hit your budget hardest and adjust accordingly.
- Build financial literacy — understanding how ECB decisions, Eurostat data releases, and macroeconomic trends connect puts you in a stronger position than most.
Inflation data releases regularly drive currency and bond market volatility. If you're interested in seeing how these dynamics play out in real time, try practising on a demo trading account — it's a risk-free way to build market intuition.
Remember: J2T does not provide investment advice. Always consult a qualified financial professional before making investment decisions.
Current EU Inflation Outlook and Future Trends
Now that we've covered what is inflation and how does inflation work across the EU, where are prices headed next? The outlook for 2026 is shaped by competing forces pulling in opposite directions.
Disinflationary pressures:
- The strong euro (trading around $1.18 in early February) makes imports cheaper, suppressing price growth.
- Energy prices continue falling, with the ECB projecting negative energy inflation through late 2027.
- The lagged effects of the 2022–2023 rate hiking cycle are still filtering through the economy.
Inflationary pressures:
- Services inflation remains sticky at 3.2% — driven by tight labour markets and rising wages.
- Potential US tariff escalation and trade policy uncertainty could lift input costs.
- Rising defence spending across Europe adds to fiscal expansion.
- The planned EU Emissions Trading System 2 (ETS2) could add ~0.2 percentage points to headline inflation in 2028.
The ECB's December 2025 staff projections mapped out the expected trajectory:
| Year |
Core HICP (ex energy, food) |
| 2025 |
2.4% |
| 2026 |
2.2% |
| 2027 |
1.9% |
| 2028 |
2.0% |
Markets, as of early February 2026, were broadly pricing in stable rates through most of 2026, though some probability of a late-year hike was reflected in swap markets. Deutsche Bank's base case sees rates held at 2% through 2026, with the next move potentially a hike in mid-2027. However, Bank of America expects one final 25bp cut in March 2026.
For traders and investors, this uncertainty is the landscape. Every monthly HICP release from Eurostat, every ECB press conference, every national CPI report from Destatis, INE, or GUS represents a data point that could shift expectations — and with them, asset prices.
Conclusion: Understanding What Is Inflation in the European Economic Context
Inflation is not a mysterious force — it's a measurable, manageable, and deeply consequential economic reality.
The key relationships are straightforward:
- Eurostat measures inflation through the HICP, applying harmonised methodology across all EU member states.
- The European Central Bank controls it via interest rates and tools like quantitative easing, guided by a symmetric 2% target.
- Individual national statistical offices — Destatis in Germany, INE in Spain, GUS in Poland — provide country-level granularity.
What makes the current moment particularly interesting is the divergence within Europe itself. Germany battles sticky services inflation. Spain grapples with persistent core pressures. Poland navigates its own monetary policy cycle outside the eurozone.
Understanding these dynamics — and how they connect to ECB decisions and your own financial choices — is the foundation of sound economic literacy.
Stay informed. Watch the data. And never underestimate the quiet power of 2%.
FAQ
-
What causes inflation to rise or fall?
Inflation rises from demand-pull pressures (excess demand for goods), cost-push factors (higher energy, materials, or wages), and monetary expansion. It falls when demand weakens, input costs decline, or central banks tighten policy by raising interest rates and reducing the money supply.
-
How often does Eurostat update inflation figures?
Eurostat publishes a flash estimate of euro area inflation at the end of each reference month. Full detailed data for all EU member states follows approximately two weeks later, around mid-month.
-
What items are in the HICP consumer basket?
The HICP covers virtually all household final monetary consumption — food, clothing, housing costs (excluding owner-occupied), transport, health, communications, recreation, education, restaurants, and miscellaneous goods. Each country's statistical office determines specific items based on local spending patterns, with the basket updated annually.
-
How does inflation affect mortgage rates?
When the ECB raises interest rates to combat inflation, commercial banks increase mortgage rates accordingly, making new borrowing more expensive. Rate cuts during low-inflation periods reduce borrowing costs. Fixed-rate mortgage holders are insulated from these shifts during their lock-in period.
-
Can inflation be too low as well as too high?
Absolutely. The ECB's symmetric target explicitly acknowledges this. Inflation that is too low risks deflation — a self-reinforcing cycle of falling prices, delayed spending, and economic contraction. The 2% buffer is specifically designed to prevent the economy from sliding into that dangerous territory.
-
What's the difference between HICP and national CPI?
The HICP uses standardised EU methodology for cross-country comparison. National CPIs may differ in scope — for instance, Germany's national CPI includes owner-occupied housing costs and broadcasting fees, which the HICP excludes. Poland's CPI incorporates items specific to local consumption patterns that may not appear in the harmonised measure.
-
How do energy prices affect EU inflation?
Energy carries a 9.4% weight in the euro area HICP but is far more volatile than other components. In January 2026, energy prices fell 4.1% year-on-year, dragging headline inflation well below the ECB's target. When energy prices spiked in 2022, they were the dominant force pushing inflation above 10%.
-
What happens if the ECB misses its inflation target?
The ECB operates with a medium-term orientation, meaning short-term deviations are expected. However, persistent misses in either direction prompt policy adjustment. The Governing Council has consistently stated it follows a "data-dependent and meeting-by-meeting approach" without pre-committing to any specific rate path.