MACD Indicator Guide: Complete Trading Strategies and Analysis 2026
)
Table of Contents
MACD Definition and Core Components
Understanding MACD Line and Signal Line Components
How to Read MACD Signals and Crossovers
MACD Trading Strategies and Implementation
Combining MACD with RSI and Other Indicators
MACD Timeframe Optimization and Settings
Risk Management and False Signal Mitigation
Advanced MACD Analysis for Professional Traders
Conclusion: Mastering MACD for Consistent Trading Success
Frequently Asked Questions About MACD Trading
The Moving Average Convergence Divergence (MACD) is a momentum oscillator that calculates the difference between a security's 12-day and 26-day Exponential Moving Averages. Invented by Gerald Appel, the MACD generates buy and sell signals through crossovers with its 9-day EMA signal line, zero line crosses, and divergence patterns that indicate potential trend reversals and momentum changes.
MACD Definition and Core Components
The MACD indicator stands as one of technical analysis's most versatile tools, combining trend-following and momentum characteristics into a single, powerful oscillator. At its core, what is MACD represents a mathematical relationship between two exponential moving averages that reveals the shifting dynamics between short-term and long-term price momentum.
Gerald Appel developed the MACD in the late 1970s, recognizing that traditional moving averages alone failed to capture the nuanced interplay between price momentum and trend direction. His innovation created a momentum oscillator that moves freely above and below a zero line, providing unlimited range to track both subtle shifts and explosive momentum changes.
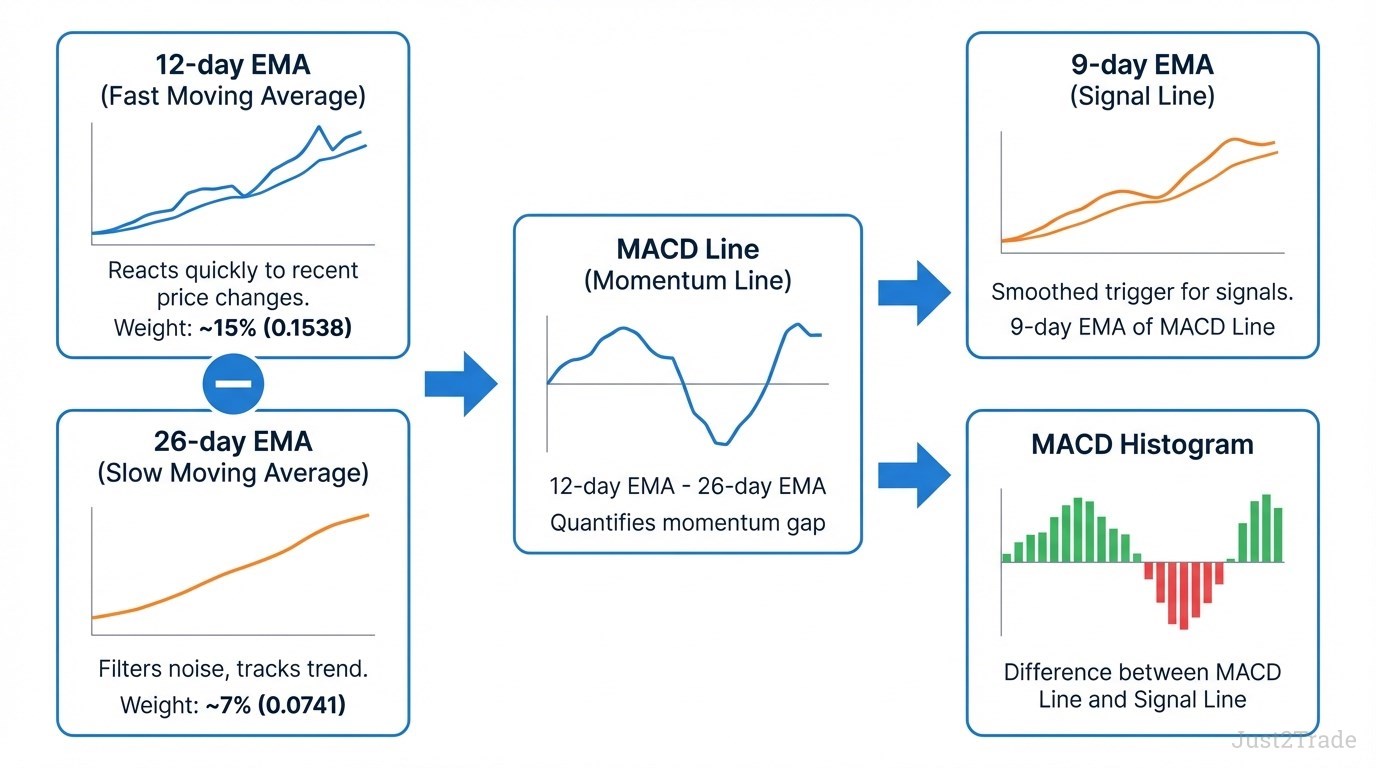
The MACD meaning extends beyond simple moving average mathematics. This indicator calculates the difference between a 12-day exponential moving average and a 26-day exponential moving average, creating the MACD line itself:
- The 12-day period captures short-term price momentum, responding quickly to recent price movements
- The 26-day period provides longer-term trend context, smoothing out short-term noise while maintaining sensitivity to genuine trend changes
- The difference quantifies whether short-term momentum is accelerating away from or converging toward the longer-term trend
When the MACD line sits above zero, it signals that the 12-day EMA exceeds the 26-day EMA—short-term momentum is bullish. When the MACD line falls below zero, short-term momentum has turned bearish. The distance from zero indicates momentum strength: larger positive values suggest stronger upward momentum, while larger negative values indicate stronger downward momentum.
Unlike oscillators bound between fixed levels like 0-100, the MACD adapts to each security's price characteristics. A volatile stock might show MACD values ranging from -50 to +50, while a stable bond might oscillate between -2 and +2. This adaptability makes the MACD universally applicable across asset classes—stocks, forex, commodities, and cryptocurrencies.
The convergence and divergence that give the indicator its name occur when the two EMAs move closer together or farther apart. Convergence suggests momentum is weakening; divergence indicates momentum is strengthening. These subtle shifts often precede significant price movements, providing traders with early warning signals.
Understanding these core components—the 12-day and 26-day EMA calculation, the zero line reference point, and Gerald Appel's innovative design—forms the foundation for effective MACD trading.
The Mathematical Foundation: Exponential Moving Averages
The exponential moving average forms the mathematical backbone of MACD calculation. Unlike simple moving averages that weight all prices equally, EMA calculation applies exponential decay weighting that emphasizes recent prices while still considering historical data. This price weighting methodology makes EMAs more responsive to current market conditions than their simple counterparts.
The EMA formula multiplies the difference between today's price and yesterday's EMA by a smoothing multiplier, then adds this result to yesterday's EMA. Key multipliers:
- 12-day EMA: 2/(12+1) = 0.1538 (15% weight to recent prices)
- 26-day EMA: 2/(26+1) = 0.0741 (7% weight to recent prices)
This period sensitivity difference between the 12-day and 26-day exponential moving averages creates the MACD's analytical power. The faster 12-day EMA reacts quickly to price movements, capturing short-term momentum shifts. The slower 26-day EMA filters out noise while tracking the underlying trend. When you subtract the slower EMA from the faster EMA, the resulting MACD line quantifies the gap between short-term momentum and longer-term trend direction—revealing whether momentum is building with the trend or diverging from it.
)
Understanding MACD Line and Signal Line Components
The MACD indicator structure consists of two primary components that work together to generate trading signals. The MACD line itself represents the raw momentum calculation—the difference between the 12-day and 26-day exponential moving averages. This line oscillates above and below zero, directly reflecting the relationship between short-term and long-term price momentum.
The signal line adds a critical smoothing layer to the MACD components. This 9-day EMA of the MACD line acts as a trigger mechanism for buy and sell signals. By applying exponential smoothing to the already-smoothed MACD line, the signal line filters out minor fluctuations while maintaining responsiveness to genuine momentum shifts. The 9-day period balances sensitivity with reliability—short enough to catch meaningful changes, long enough to avoid excessive false signals.
Component interaction mechanics:
- MACD Line → Fast-moving, direct momentum measurement
- Signal Line → Slower-moving, smoothed trigger for entries/exits
- Crossovers → Generate primary buy and sell signals
The response speed difference between these components creates the indicator's trading power. When the MACD line crosses above the signal line, it indicates that current momentum is accelerating faster than the recent average momentum—a bullish signal. When the MACD line crosses below the signal line, current momentum is decelerating relative to recent momentum—a bearish signal.
This two-line system essentially compares momentum to smoothed momentum, creating a momentum-of-momentum measurement. The MACD line tells you what momentum is doing now. The signal line tells you what momentum was doing recently. The relationship between them reveals whether momentum is strengthening or weakening—information that often precedes price direction changes.
Zero Line Significance and Momentum Direction
The MACD zero line serves as the equilibrium point between the 12-day and 26-day exponential moving averages. When the MACD line crosses this reference point, it signals a fundamental shift in the relationship between short-term and long-term momentum. This zero line acts as the dividing line between bullish and bearish market bias.
Price trading above the zero line indicates the 12-day EMA exceeds the 26-day EMA—short-term momentum is positive relative to the longer-term trend. This positioning suggests bullish bias, with buyers currently in control. Conversely, when the MACD line sits below the zero line, the 26-day EMA exceeds the 12-day EMA, indicating bearish bias with sellers dominating.
Zero-cross trading strategies use these equilibrium crossings as primary signals. A MACD line crossing above zero confirms upward momentum has overtaken the longer-term average, potentially signaling the start of a sustained uptrend. A crossing below zero confirms downward momentum dominance, possibly marking the beginning of a sustained downtrend. These zero line crosses often provide more reliable trend confirmation than signal line crossovers, though they occur less frequently and may lag initial momentum shifts.
How to Read MACD Signals and Crossovers
Learning how to read MACD starts with understand
ing the three primary signal types the indicator generates. Each signal type provides different information about momentum and trend direction, with varying degrees of reliability and timing characteristics.
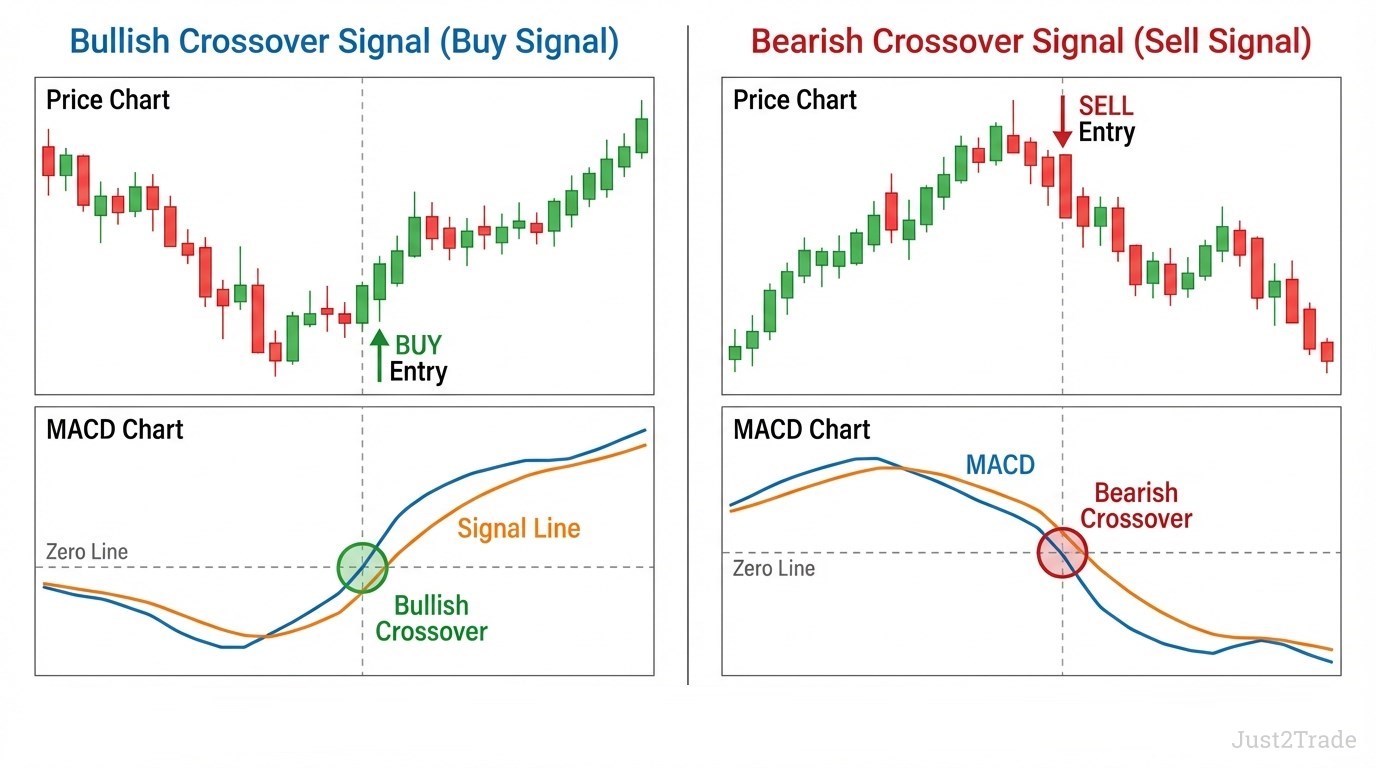
Bullish crossover signals occur when the MACD line crosses above the signal line. This crossover indicates that current momentum is accelerating faster than recent average momentum—a bullish signal suggesting potential upward price movement. The strength of this signal increases when the crossover occurs below the zero line and subsequently moves toward or above zero, confirming that momentum is not just improving but potentially reversing from bearish to bullish territory.
Bearish crossover signals form when the MACD line crosses below the signal line. This pattern shows that current momentum is decelerating relative to recent momentum—a bearish signal indicating potential downward price movement. Bearish crossovers carry greater weight when they occur above the zero line and subsequently decline toward or below zero, suggesting momentum is transitioning from bullish to bearish conditions.
The timing of MACD crossover signals provides critical context for signal interpretation:
- Crossovers far from zero line → Early momentum shift detection, higher false signal risk
- Crossovers near zero line → Trend transition confirmation, more reliable but later timing
- Crossovers after zero line cross → Strong trend continuation signals, highest reliability
Signal reliability improves significantly when multiple confirmation factors align. A bullish signal gains strength when accompanied by increasing distance between the MACD and signal lines, suggesting momentum is not just turning positive but accelerating. Volume confirmation—higher volume on the crossover day—adds further credibility. Price action confirmation, such as a simultaneous break above resistance, transforms a moderate signal into a high-probability setup.
)
The most reliable MACD signals often occur after a period of consolidation where the MACD and signal lines converge tightly before crossing. This compression indicates momentum uncertainty resolving into directional conviction. Conversely, crossovers that occur while the lines are already widely separated often prove less reliable, as they may represent momentum exhaustion rather than new trend development.
MACD Histogram: Momentum Visualization
The MACD histogram provides visual momentum representation by plotting the distance between the MACD line and signal line as vertical bars. This histogram calculation simply subtracts the signal line value from the MACD line value, with positive bars appearing when the MACD line sits above the signal line and negative bars when it falls below.
Histogram analysis offers early warning characteristics that lines alone cannot provide. When histogram bars begin shrinking—moving toward the zero line—convergence is occurring between the MACD and signal lines, signaling that a crossover may be imminent. Expanding histogram bars indicate growing momentum divergence, suggesting the current trend is strengthening rather than reversing.
The histogram reaches zero precisely when the MACD line crosses the signal line, making crossover timing visually obvious. Traders often watch for histogram peaks and troughs, as these inflection points frequently precede actual crossovers by one or more periods, providing advance notice for trade preparation. This momentum visualization transforms abstract numerical differences into intuitive visual patterns that simplify signal recognition.
MACD Trading Strategies and Implementation
Successful MACD trading strategy implementation requires systematic frameworks that define precise entry and exit rules. Two primary approaches dominate professional MACD strategy applications: the crossover strategy and the zero cross strategy, each offering distinct advantages for different market conditions.
The crossover strategy generates signals when the MACD line crosses the signal line. Entry protocols for this approach include:
- Long entry: MACD line crosses above signal line, particularly when both lines sit below zero (oversold conditions)
- Short entry: MACD line crosses below signal line, especially when both lines sit above zero (overbought conditions)
- Exit timing: Position closure when the opposite crossover occurs or when price reaches predetermined profit targets
This MACD trading strategy works best in trending markets where momentum shifts produce sustained directional moves. However, during sideways consolidation, crossover signals generate frequent whipsaws that erode trading capital through repeated small losses.
The zero cross strategy focuses on MACD line crossings of the zero line itself rather than signal line interactions. This approach provides:
- Bullish confirmation: Enter long when MACD crosses above zero, confirming upward momentum dominance
- Bearish confirmation: Enter short when MACD crosses below zero, validating downward momentum control
- Reduced signal frequency: Fewer but more reliable signals compared to signal line crossovers
- Trend alignment: Natural filter ensuring trades align with dominant momentum direction
Zero cross strategy implementation produces later entries than crossover strategies but significantly reduces false signal exposure. This trade-off between timeliness and reliability suits different trading personalities and risk tolerances.
Risk management integration transforms these signal frameworks into complete trading systems. Position sizing should reflect signal strength—stronger signals (multiple confirmations, histogram expansion, volume support) warrant larger positions within risk parameters. Stop loss placement belongs just beyond recent swing points that would invalidate the momentum thesis: below the recent swing low for long positions, above the recent swing high for short positions.
A practical position sizing framework limits risk to 1-2% of account equity per trade. If your stop loss sits 50 pips from entry and your account contains $10,000, risking 1% means a $100 maximum loss, translating to 2 mini lots ($100 ÷ 50 pips = $2 per pip). This mathematical discipline prevents emotional position sizing that destroys accounts during inevitable losing streaks.
Advanced Divergence Trading Techniques
MACD divergence represents one of the most powerful reversal patterns in technical analysis. Divergence trading occurs when price action and the MACD indicator move in opposite directions, signaling potential momentum exhaustion and impending trend reversals.
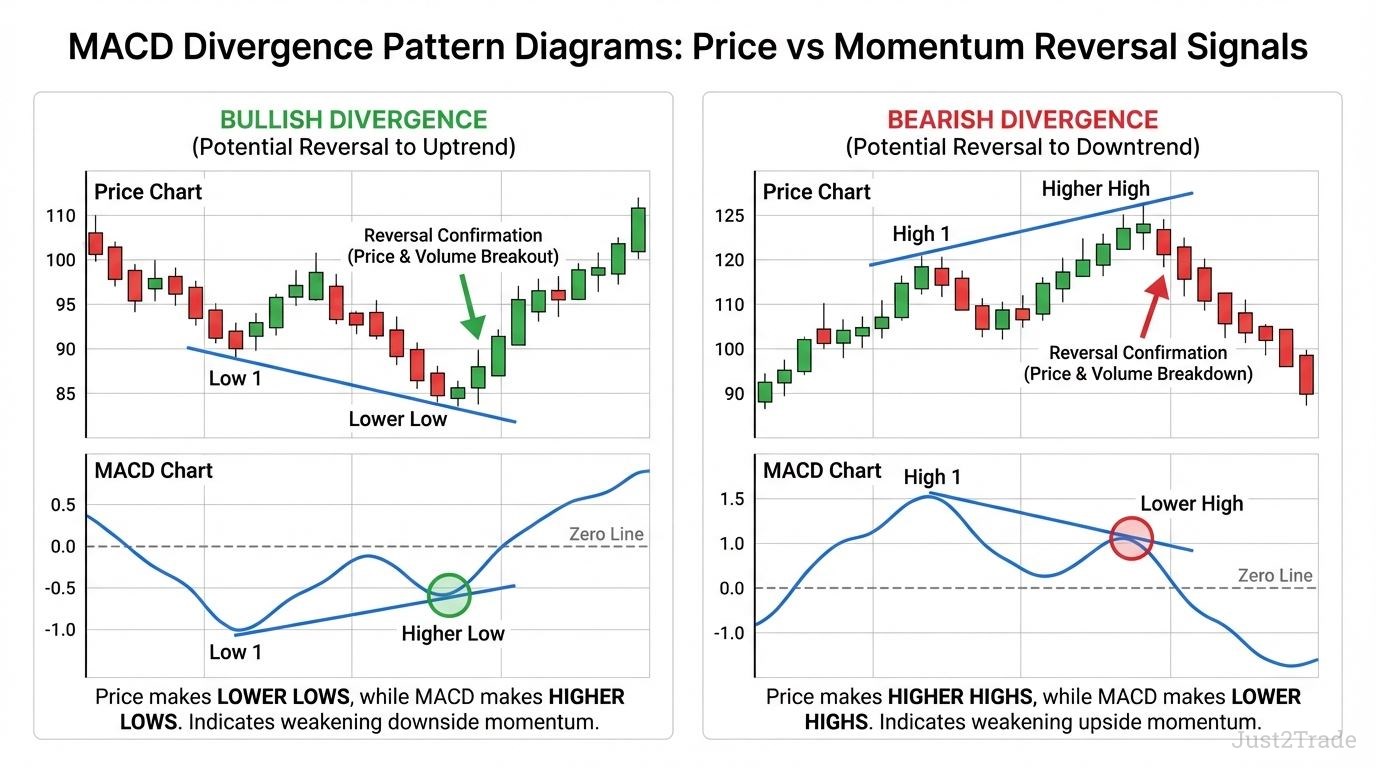
Bullish divergence forms when price makes lower lows while the MACD makes higher lows. This pattern suggests that despite price declining to new lows, downward momentum is actually weakening. Sellers are losing control even as price continues falling—a warning that a reversal to the upside may be imminent. The strongest bullish divergences occur when price makes multiple lower lows while MACD consistently refuses to confirm these lows, creating a clear momentum disconnection.
Bearish divergence appears when price makes higher highs while the MACD makes lower highs. This divergence pattern indicates that upward momentum is deteriorating even as price reaches new peaks. Buyers are exhausting themselves, and the uptrend may be vulnerable to reversal. Multiple bearish divergences—where price makes several higher highs with progressively weaker MACD readings—signal particularly strong reversal probability.
Signal strength assessment depends on several factors:
- Multiple divergences → Higher reliability than single occurrences
- Time span → Divergences over weeks carry more weight than daily divergences
- Confirmation → Volume declining with price moves strengthens divergence signals
- Context → Divergences at major support/resistance levels increase reversal probability
Divergence trading requires patience, as these reversal patterns can persist longer than anticipated before price follows MACD's warning. Combining divergence signals with other technical factors—such as candlestick reversal patterns, support/resistance bounces, or RSI confirmation—substantially improves trade timing and success rates.
)
Combining MACD with RSI and Other Indicators
The MACD RSI combination creates a powerful multi-indicator analysis framework that addresses each indicator's individual weaknesses. While MACD excels at identifying momentum direction and trend strength, RSI provides bounded oscillator readings that clearly identify overbought and oversold conditions. This synergistic relationship produces higher-quality confirmation signals than either indicator generates alone.
MACD-RSI confirmation protocols work through complementary momentum analysis:
- Bullish confirmation: MACD bullish crossover gains strength when RSI crosses above 50, indicating momentum shift confirmed by relative strength improvement
- Bearish confirmation: MACD bearish crossover becomes more reliable when RSI falls below 50, validating momentum deterioration
- Divergence alignment: When both MACD and RSI show divergence patterns simultaneously, reversal probability increases substantially
- Extreme readings: RSI below 30 with bullish MACD crossover suggests oversold bounce; RSI above 70 with bearish MACD crossover warns of overbought reversal
The Relative Strength Index adds value by identifying when MACD signals occur at momentum extremes versus mid-range conditions. A MACD bullish crossover carries more weight when RSI exits oversold territory than when RSI already sits at neutral 50 levels. Similarly, MACD bearish crossovers gain credibility when RSI peaks above 70 before declining.
Money Flow Index integration adds volume context that pure price-based indicators lack. MFI measures buying and selling pressure through volume-weighted price calculations. When MACD generates bullish signals while MFI confirms increasing buying pressure, the combination validates that momentum shifts have genuine participation backing them. Conversely, MACD signals without MFI confirmation may represent low-conviction moves lacking institutional support.
Support and resistance levels provide essential context for interpreting MACD signals. A bullish MACD crossover occurring at a major support level carries significantly more weight than a crossover in mid-range territory. The support level provides a logical stop loss reference point and suggests buyers have defended a critical price zone. Similarly, bearish MACD crossovers at resistance levels benefit from price rejection context that strengthens reversal probability.
This multi-indicator approach doesn't mean waiting for perfect alignment across all technical analysis tools before trading. Rather, it means understanding which combinations provide the highest probability setups and allocating larger positions when multiple factors confirm the same directional bias.
Creating Robust Multi-Indicator Systems
Building a robust trading system requires strategic indicator combinations that complement rather than duplicate each other's functions. MACD provides momentum and trend direction, so pairing it with oscillators measuring the same characteristics adds little value. Instead, effective system building combines MACD with indicators addressing different market dimensions.
A comprehensive technical analysis framework might include:
- MACD → Momentum direction and trend strength
- RSI → Overbought/oversold conditions and divergence confirmation
- Volume indicators → Participation validation and buying/selling pressure
- Support/resistance → Price context and logical entry/exit reference points
- Moving averages → Long-term trend confirmation and dynamic support/resistance
Signal confirmation protocols within this framework require at least two independent indicators agreeing before position entry. A MACD bullish crossover alone generates a watchlist candidate. That same crossover accompanied by RSI exiting oversold territory and price bouncing off support creates a high-probability trade setup. This layered approach dramatically reduces false signal exposure while maintaining sufficient trade frequency for consistent opportunity flow.
The key to successful multi-indicator systems lies in understanding each indicator's strengths and applying them where they excel rather than forcing every indicator to validate every decision.
MACD Timeframe Optimization and Settings
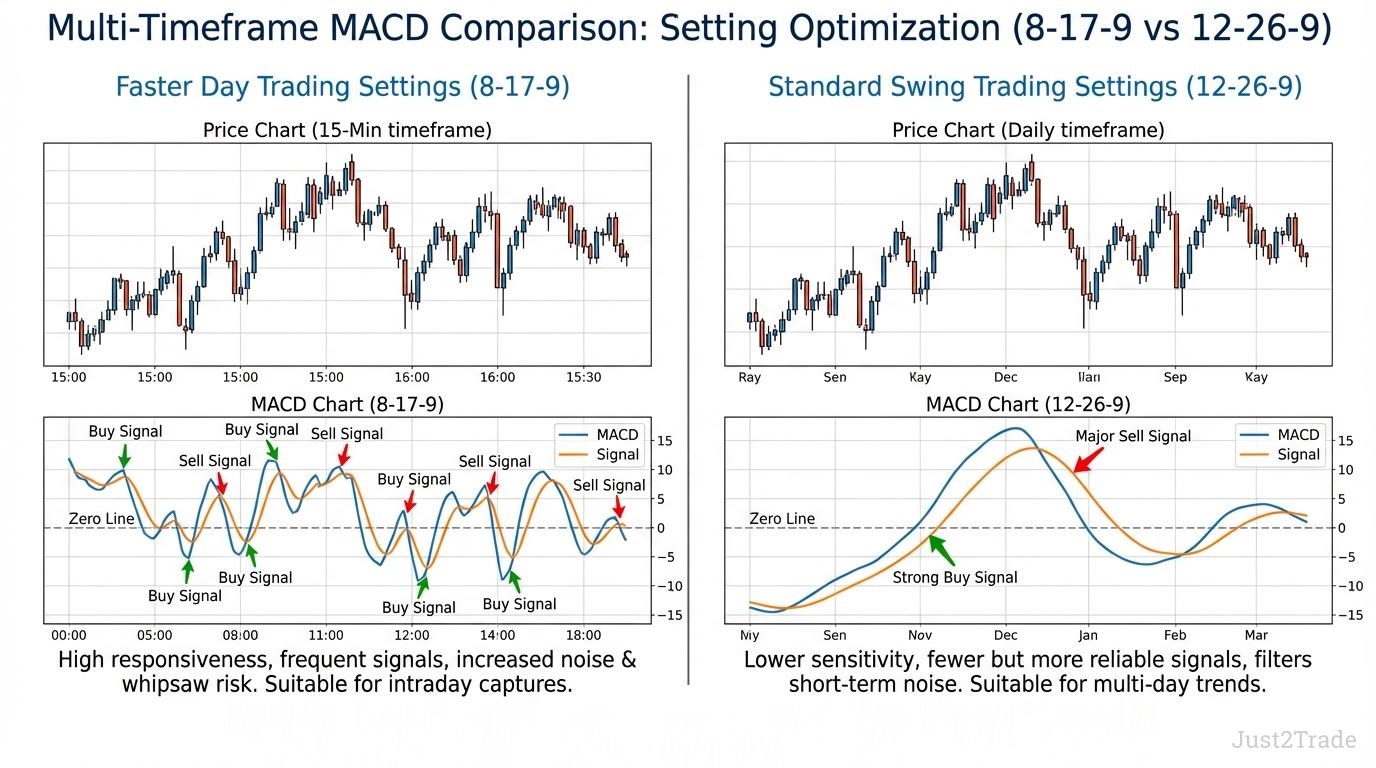
The standard MACD settings of 12-26-9 work well for daily charts and swing trading applications, but timeframe optimization becomes essential when adapting the indicator to different trading styles. Period customization allows traders to align MACD responsiveness with their specific time horizons and market volatility characteristics.
Day trading MACD configurations typically use faster settings that generate more frequent signals suitable for intraday price movements:
- 5-35-5 settings → Highly responsive for scalping and rapid momentum shifts
- 8-17-9 settings → Balanced day trading approach with reduced noise
- 13-21-9 settings → Conservative intraday option for trending day trades
These accelerated parameters increase signal frequency but also raise false signal risk. Day traders using faster MACD settings must employ strict confirmation requirements and tight risk management to compensate for increased whipsaw potential during ranging market conditions.
Swing trading settings benefit from the default 12-26-9 configuration or slightly slower parameters that filter short-term noise while capturing multi-day momentum trends. Some swing traders prefer 12-26-5 for slightly faster signal line response, or extend periods to 19-39-9 for longer-term position trading that holds for weeks rather than days.
Setting optimization should reflect both timeframe and market volatility. During high-volatility periods, extending MACD periods reduces false signals triggered by erratic price swings. Conversely, low-volatility environments may benefit from shortened periods that maintain signal sensitivity when price movements compress. A practical approach tests multiple setting variations on historical data specific to the traded security, identifying which parameters generated the best risk-reward ratios during similar market conditions.
)
Market condition adaptability represents advanced MACD application where traders modify settings based on whether markets are trending or ranging. Trending markets reward faster settings that catch momentum early. Ranging markets require slower settings or temporarily abandoning MACD signals altogether in favor of oscillators better suited to sideways consolidation.
Risk Management and False Signal Mitigation
MACD false signals represent the primary challenge traders face when implementing momentum-based strategies. Understanding these limitations and developing systematic mitigation approaches separates consistently profitable traders from those who struggle despite technical knowledge.
The most common source of false signals occurs during sideways markets where price oscillates within a range without establishing clear directional trends. In these conditions, MACD generates frequent crossovers as short-term momentum shifts back and forth, but these signals fail to produce sustained moves. Each crossover appears legitimate technically, yet most result in small losses as price reverses before reaching profit targets. Recognizing ranging conditions through price action analysis—repeated tests of support and resistance without breakouts—allows traders to reduce MACD reliance during these periods.
MACD's lagging indicator characteristics create another challenge. As a moving average-based tool, MACD inherently processes historical price data, meaning signals arrive after momentum shifts begin. This lag sometimes causes entries near momentum exhaustion rather than at optimal initiation points. The delay proves particularly problematic during V-shaped reversals where price changes direction rapidly without building gradual momentum transitions that MACD detects effectively.
Mitigation strategies for reliable signal execution:
- Confirmation requirements → Demand at least two independent technical factors supporting MACD signals before entry
- Position sizing discipline → Risk only 1-2% of account equity per trade, preventing single false signals from causing significant damage
- Stop loss placement → Set stops beyond technical invalidation points rather than arbitrary pip distances
- Signal filtering → Avoid trades when MACD and signal lines are tightly compressed, indicating low conviction
- Market context → Trade only when broader trend aligns with MACD signal direction
Trading discipline enforcement through systematic rules transforms MACD from a discretionary signal generator into a mechanical trading system component. Written trading plans that specify exact entry conditions, position sizing formulas, and exit criteria remove emotional decision-making that amplifies false signal impact.
Common MACD Trading Mistakes to Avoid
Understanding typical MACD mistakes helps traders avoid repeating errors that consistently undermine profitability. Here are the most common pitfalls:
1. Signal Misinterpretation
Treating every crossover as equally valid regardless of context represents the most frequent error. New traders often enter positions on any MACD line crossing the signal line, ignoring whether the crossover occurs during ranging conditions, at momentum extremes, or with supporting technical confirmation.
2. Overtrading Tendencies
The desire for constant market activity leads to forcing MACD signals rather than waiting for high-probability setups. This includes taking marginal signals that lack conviction—crossovers with compressed lines, signals against the broader trend, or entries without confirmation from complementary indicators. Overtrading generates excessive transaction costs and exposes capital to low-quality opportunities.
3. Inadequate Risk Control
Position sizing based on optimism rather than mathematics creates catastrophic loss potential. Traders might risk 5-10% of their account on MACD signals they feel confident about, but proper risk control demands consistent 1-2% risk per trade regardless of signal strength perception. This ensures that even consecutive losses don't permanently damage trading capital.
4. Ignoring Higher Timeframe Context
Taking MACD signals on 15-minute charts while daily charts show strong opposing trends creates low-probability trades fighting dominant momentum. Successful MACD trading requires timeframe alignment where signals on trading timeframes match the direction of longer-term trend analysis.
Advanced MACD Analysis for Professional Traders
Professional MACD analysis extends beyond basic crossover recognition into nuanced momentum assessment that reveals market structure insights invisible to casual observers. These advanced techniques transform the MACD from a simple signal generator into a sophisticated tool for understanding market dynamics.
Momentum strength assessment examines not just whether momentum is positive or negative, but how forcefully it's moving. The distance between the MACD line and signal line quantifies momentum strength—wider separations indicate powerful directional conviction, while narrow gaps suggest tentative, easily reversed momentum. Professional traders track whether this separation is expanding or contracting, providing early warning of momentum acceleration or deceleration before crossovers occur.
The slope of the MACD line itself reveals momentum quality. Steep MACD line angles indicate rapid momentum changes with strong directional pressure. Gradual slopes suggest measured momentum development that may prove more sustainable than explosive moves prone to quick reversals. Professionals combine slope analysis with histogram expansion to identify high-quality momentum builds versus low-conviction drifts.
Trend quality evaluation uses MACD positioning relative to the zero line over time. Strong trends maintain MACD consistently on one side of zero with occasional shallow pullbacks that don't cross the centerline. Weak trends show frequent zero line crossings, indicating momentum constantly shifting between bullish and bearish states without establishing dominance. This pattern recognition helps traders distinguish between choppy conditions requiring range-trading approaches and genuine trends suitable for momentum strategies.
Market condition recognition through MACD behavior patterns allows professionals to adapt strategies to current environments. During strong trends, MACD maintains distance from the signal line with both lines moving in parallel—a pattern signaling continuation probability. During trend exhaustion, the MACD line begins oscillating around the signal line with neither establishing clear separation—a warning to tighten stops or exit positions before reversal confirmation.
Advanced traders also monitor MACD divergences across multiple timeframes simultaneously. Daily chart divergence carries more weight than hourly divergence, but when both timeframes show divergence patterns concurrently, reversal probability increases substantially, warranting position adjustments or counter-trend trade consideration.
Conclusion: Mastering MACD for Consistent Trading Success
MACD mastery develops through progressive skill building that transforms theoretical knowledge into practical trading success. The indicator provides powerful momentum insight, but this insight requires integration within comprehensive risk management frameworks and multi-indicator confirmation systems.
Begin your MACD journey by mastering the foundational elements: understanding how the 12-day and 26-day EMAs create the MACD line, recognizing how the 9-day signal line generates crossover triggers, and interpreting zero line positioning for momentum direction assessment. Practice identifying these basic signals on historical charts until pattern recognition becomes intuitive.
Progress to intermediate applications by incorporating divergence analysis into your signal evaluation. Learn to distinguish between high-probability divergence patterns and false warnings. Combine MACD signals with RSI confirmation, support and resistance context, and volume analysis to filter low-quality setups.
Advanced MACD implementation requires disciplined risk management that limits exposure to 1-2% per trade regardless of signal confidence. Develop written trading plans specifying exact entry conditions, position sizing formulas, and exit criteria. Test multiple timeframe settings to identify optimal parameters for your trading style and market focus.
Consistent trading success emerges not from finding perfect MACD signals—they don't exist—but from systematic application of probability-based strategies with rigorous risk control. Continue your education by practicing on demo accounts, reviewing completed trades to identify improvement areas, and refining your approach based on actual performance data rather than theoretical expectations.
FAQ
-
-
How is MACD calculated step-by-step?
MACD calculation follows a three-step process. First, calculate the 12-day exponential moving average of closing prices using the formula: EMA = (Close - Previous EMA) × (2/13) + Previous EMA. Second, calculate the 26-day EMA using the same formula with a 2/27 multiplier. Third, subtract the 26-day EMA from the 12-day EMA to create the MACD line, then apply a 9-day EMA to this MACD line to generate the signal line.
-
What's the best MACD setting for forex trading?
The standard 12-26-9 settings work effectively for forex trading on daily and 4-hour charts. However, currency traders dealing with 24-hour market volatility often adjust to 5-35-5 for faster intraday signals or 8-17-9 for balanced day trading approaches. Major pairs like EUR/USD typically respond well to standard settings, while exotic pairs with higher volatility may benefit from extended periods like 19-39-9 to filter excessive noise.
-
Can MACD work in all market conditions?
MACD performs best in trending markets where momentum builds directionally, generating reliable crossover and divergence signals. During sideways consolidation or ranging conditions, MACD produces frequent false signals as momentum oscillates without establishing clear trends. Traders should recognize ranging patterns through price action analysis and reduce MACD reliance during these periods, instead favoring oscillators like RSI that excel in bounded conditions.
-
How do you backtest MACD strategies effectively?
Effective backtesting requires historical price data covering multiple market cycles—at least 2-3 years for daily timeframes. Test your MACD strategy systematically by recording every signal that meets your entry criteria, tracking win rate, average gain/loss, maximum drawdown, and risk-reward ratios. Use realistic assumptions for slippage and commissions, and validate results across different securities and time periods to ensure the strategy isn't curve-fitted to specific historical conditions.
-
What's the difference between MACD and stochastic?
MACD is an unbounded momentum oscillator that can range infinitely based on price movements, while stochastic oscillates between fixed 0-100 boundaries. MACD measures the relationship between two EMAs, providing both trend direction and momentum strength. Stochastic compares current price to its recent range, specifically identifying overbought (>80) and oversold (<20) conditions. MACD excels in trending markets; stochastic performs better in ranging conditions.
-
How long should you hold MACD signal trades?
Trade duration depends on signal strength and the timeframe generating the signal. Daily chart MACD signals typically warrant holding positions for several days to weeks until an opposite crossover occurs or price reaches key resistance/support levels. Intraday MACD signals on 15-minute or hourly charts may last only hours. Strong signals showing histogram expansion, divergence confirmation, and zero line alignment justify longer hold periods than weak crossovers with compressed lines.
-
Can MACD predict market crashes or major reversals?
MACD can identify momentum deterioration that precedes major reversals through bearish divergence patterns where price makes new highs while MACD makes lower highs. However, MACD cannot predict the timing or magnitude of crashes, as divergences can persist for extended periods before reversals materialize. The indicator provides warning signals rather than precise predictions, working best when combined with volume analysis, market sentiment indicators, and fundamental analysis for major reversal confirmation.
-
How do you scan for MACD setups across multiple markets?
Modern trading platforms and screening tools allow automated scanning for specific MACD criteria across hundreds of securities simultaneously. Set screening parameters for bullish crossovers (MACD line crossing above signal line), bearish crossovers, or divergence patterns. Platforms like TradingView, Thinkorswim, and MetaTrader offer built-in MACD scanners. Effective scanning combines MACD signals with additional filters like minimum volume requirements, price above/below moving averages, or RSI confirmation to generate high-probability watchlists.