Inside Bar Pattern: The Complete Price Action Trading Guide for 2026

Table of Contents
What Is an Inside Bar Pattern? Understanding Structure and Formation
The Psychology Behind Inside Bar Patterns
Why Inside Bars Work: The Science of Volatility Contraction
Identifying High-Probability Inside Bar Setups
Inside Bar Trading Strategies: Entry Techniques
Stop Loss Placement for Inside Bar Trades
Profit Targets and Trade Management
Inside Bar Pattern in Different Market Conditions
Combining Inside Bars with Other Technical Indicators
Common Inside Bar Trading Mistakes
Advanced Inside Bar Trading Concepts
Inside Bar Trading Strategy Framework
Conclusion: Mastering Inside Bar Pattern Trading
Frequently Asked Questions
Key Takeaways
- Inside bar structure requires the child bar's high and low to be fully contained within the mother bar's range
- High-probability setups form at key support and resistance levels in trending markets
- Entry methods include aggressive breakout, conservative close, and retest approaches
- Stop placement goes beyond the mother bar or child bar depending on risk tolerance
- Proper risk management limits each trade to 1-2% of account capital
The inside bar pattern is a type of Bar Pattern and a component of Technical Analysis, defined by one rule: the current bar's high and low must fit entirely within the previous bar's range.
Many traders encounter it early in their technical analysis journey, recognise the clean structure, and then lose capital by trading every instance without filtering. Context determines whether the pattern offers a genuine edge.
This guide covers identification, context filtering, entry techniques, and risk management with realistic expectations rather than outcome guarantees.
What Is an Inside Bar Pattern? Understanding Structure and Formation
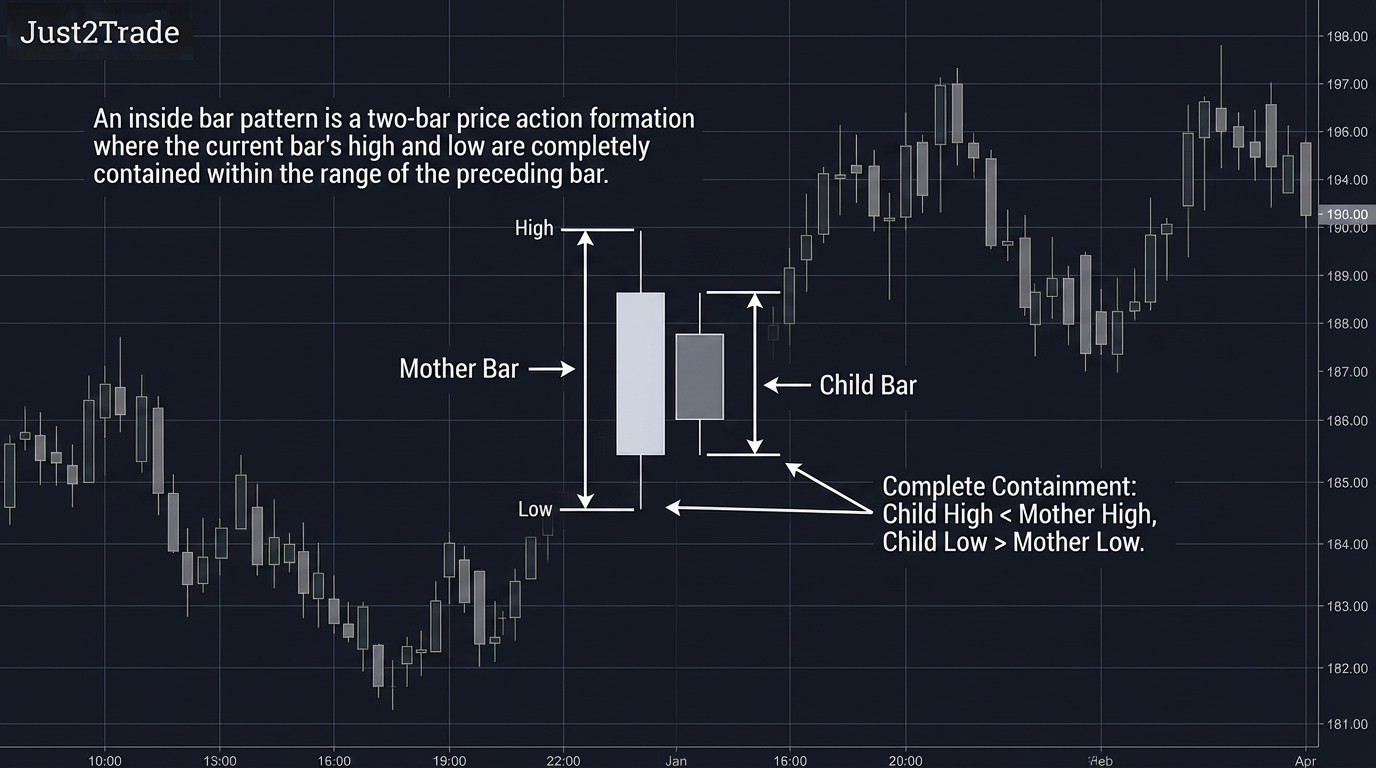
An inside bar pattern is a two-bar price action formation where the current bar's high and low are completely contained within the range of the preceding bar.
)
The inside bar pattern belongs to the Bar Pattern family and represents one of the clearest visual signals of volatility contraction available on a price chart. The inside bar pattern is a component of Technical Analysis used to identify consolidation periods before potential directional moves.
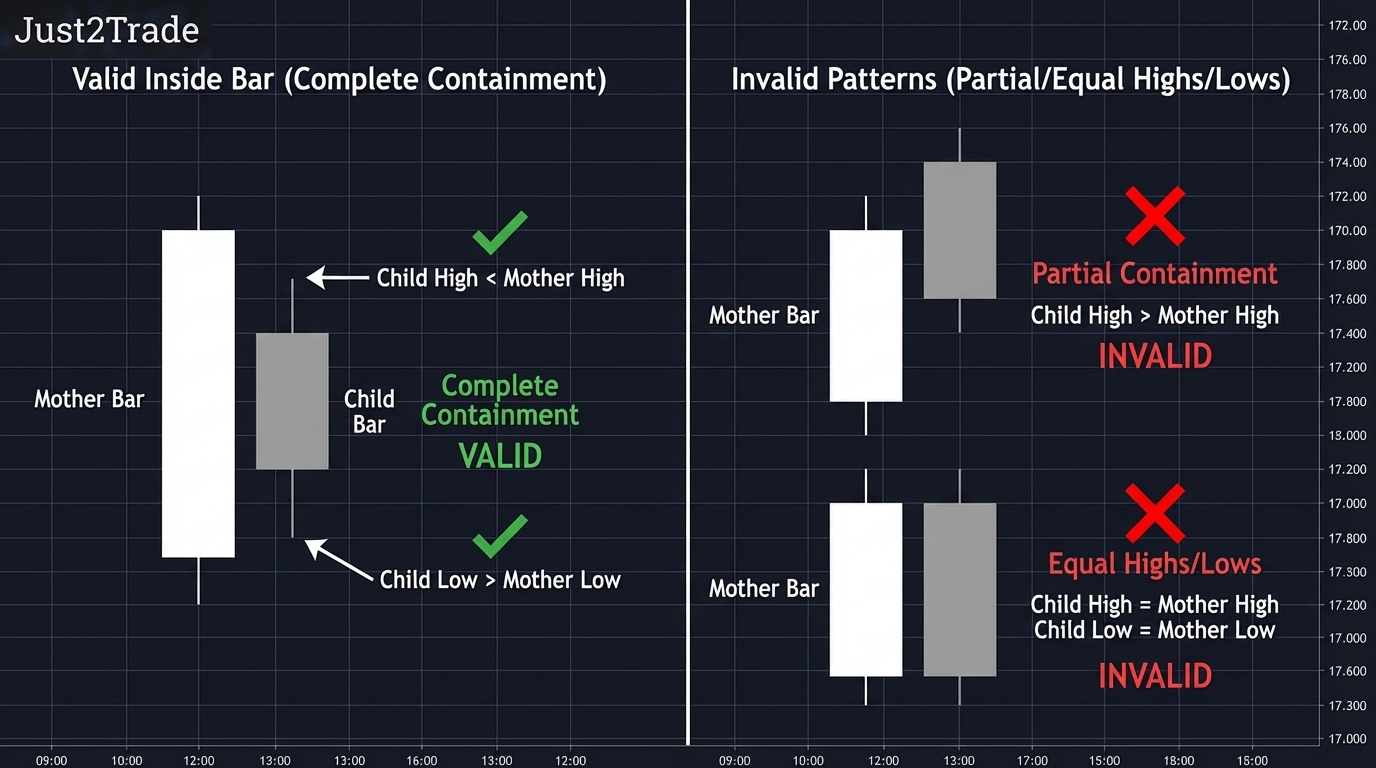
Price action traders recognise the pattern across all timeframes and liquid financial markets because the structure is unambiguous: the current bar must fit entirely inside the previous bar, wick to wick. A single pip beyond either boundary disqualifies the pattern.
The pattern signals a pause in directional momentum. Buyers and sellers reach temporary equilibrium, neither willing to push price outside the range the preceding bar established. That equilibrium compresses energy. When price eventually breaks out of the mother bar's range, it tends to move with force proportional to the degree of compression.
The Mother Bar and Child Bar Relationship
The mother bar is the larger preceding bar that establishes the outer boundary of the inside bar pattern. The child bar is the smaller contained bar that forms entirely within the mother bar's high-to-low range.
)
The mother bar's size determines the trade's initial risk parameters: entry trigger, stop placement, and measured move target all derive from its boundaries. The child bar's position within the mother bar also matters.
A child bar clustering near the top of a bullish mother bar suggests ongoing buying pressure, while a centrally located child bar signals pure indecision. Valid inside bars require complete containment. The tighter the child bar sits relative to the mother bar, the greater the compressed energy available for the subsequent breakout.
Inside Bar vs. Other Bar Patterns
The inside bar pattern differs from the outside bar, the narrow range bar, and the doji by the specific requirement of complete range containment within the preceding bar.
| Pattern |
Defining Feature |
Signal Type |
| Inside Bar |
Child bar fully contained in mother bar |
Consolidation / pending breakout |
| Outside Bar |
Engulfs the preceding bar entirely |
Reversal or continuation acceleration |
| Narrow Range Bar |
Small range relative to recent bars |
Low volatility, potential breakout |
| Doji (candlestick) |
Open and close nearly identical |
Indecision, possible reversal |
On candlestick charts, the inside bar pattern corresponds to the harami candlestick pattern. The harami and inside bar represent the same price action concept; the label depends on whether the trader uses bar charts or candlestick charts.
The Psychology Behind Inside Bar Patterns
The inside bar pattern reflects a temporary equilibrium between buyers and sellers following a strong directional move within a defined Market Trend.
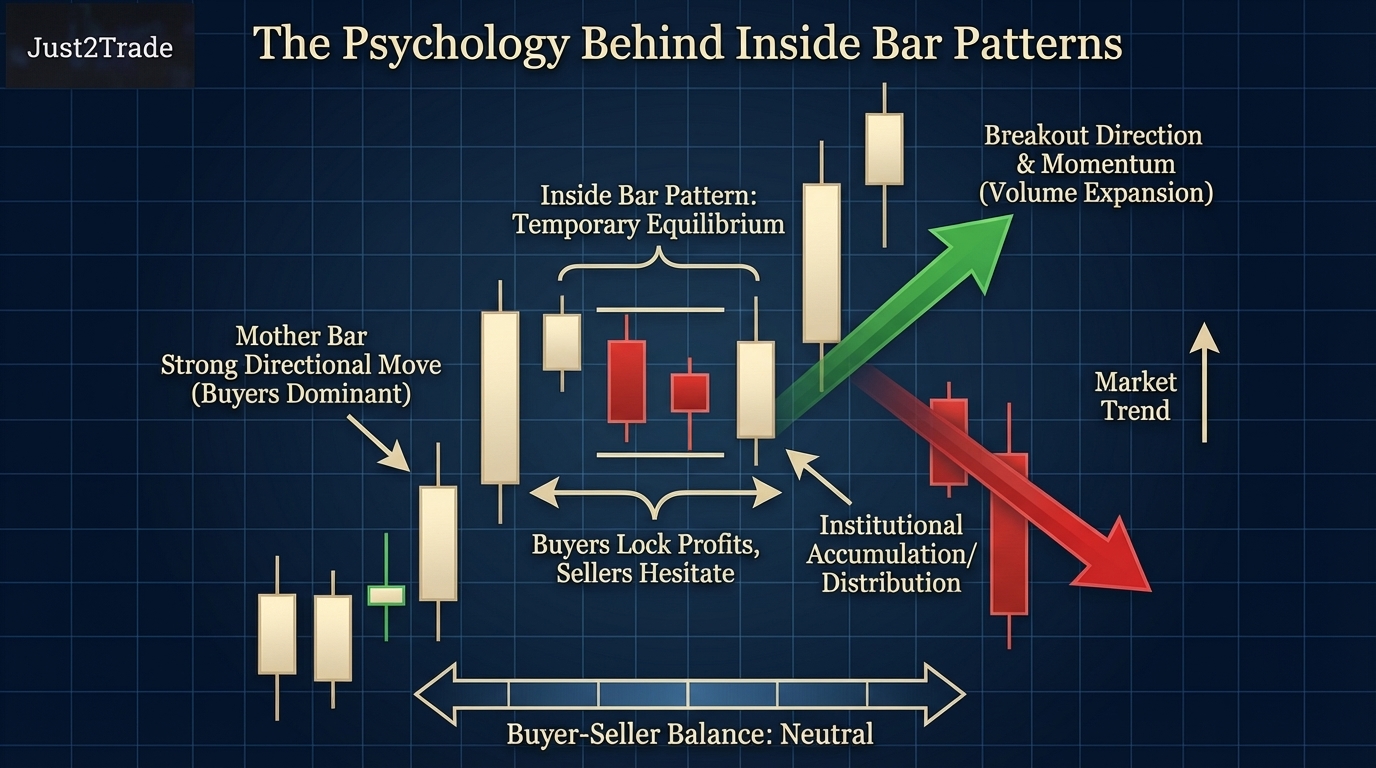)
After a decisive move represented by the mother bar, market participants pause to reassess. Buyers who entered on the prior move lock in partial profits. Sellers considering a counter-move hesitate because the Market Trend remains intact. Neither camp commits enough capital to push price beyond the established range. Price action contracts into the child bar as both sides wait for a catalyst.
This equilibrium is unstable. Institutional traders use the contraction phase to build positions quietly without moving the market. The Market Trend determines whether accumulation in an uptrend or distribution in a downtrend is the dominant institutional activity during formation.
When accumulation completes, the breakout occurs with volume expansion as trapped participants exit and new traders enter in the breakout direction. The inside bar pattern makes this institutional process visible on any chart and timeframe.
Why Inside Bars Work: The Science of Volatility Contraction
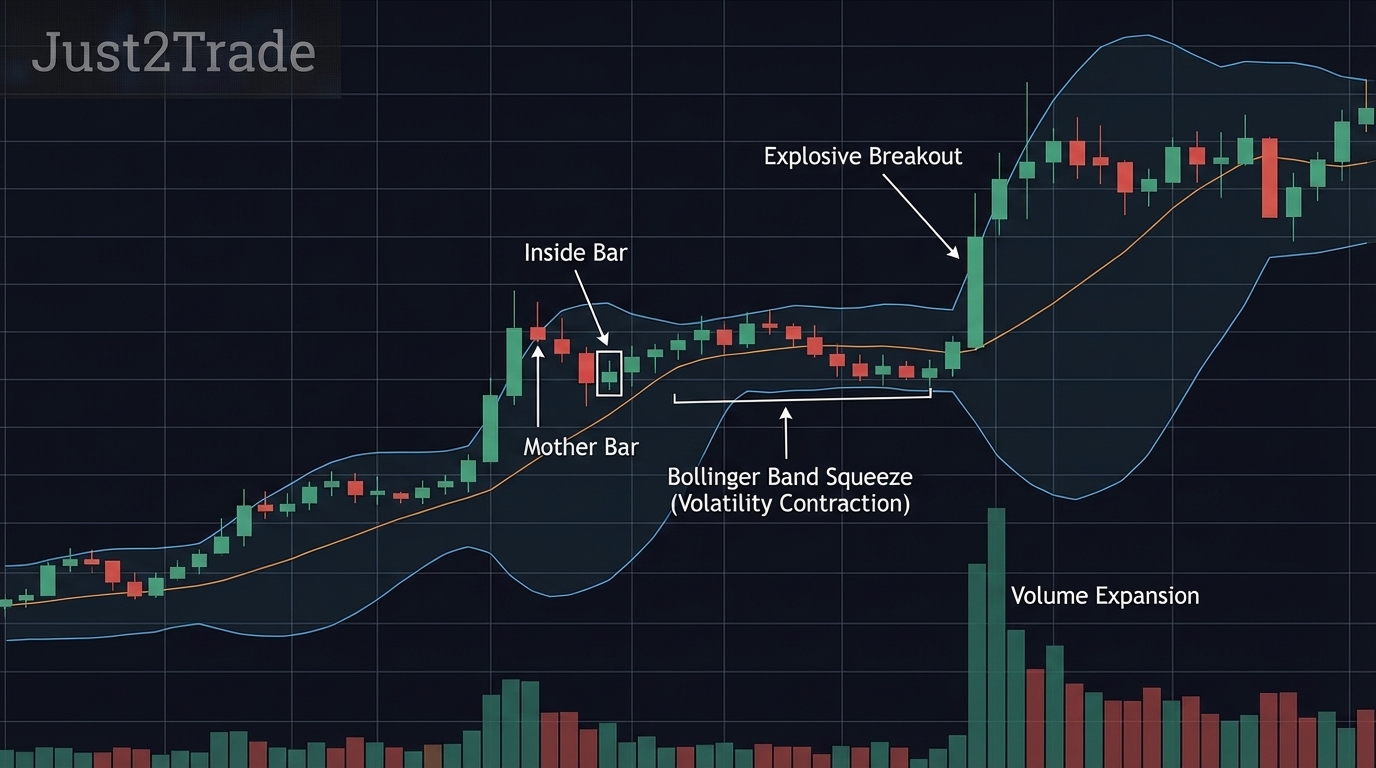
Inside bar patterns work because low volatility periods in financial markets reliably precede high volatility expansions. This relationship is known as volatility clustering.
)
Price Action is a methodology that focuses on raw price movement without indicators, operating on the principle that price reflects all available market information. Applied to inside bars, Price Action analysis shows that compressed range periods concentrate buyer and seller activity into a narrow band, creating mechanical pressure that resolves directionally once either side commits.
Bollinger Bands illustrate the same phenomenon at the indicator level. When Bollinger Bands contract into the "squeeze" formation, they signal the same volatility compression that the inside bar displays on the raw price chart. Combining complementary analytical methods reduces the risk of acting on isolated signals.
The expansion that follows a prolonged squeeze tends to be proportionally larger, which explains why multiple stacked inside bars produce the most significant subsequent moves in trending conditions.
Identifying High-Probability Inside Bar Setups
Not every inside bar offers a tradeable edge. Context determines whether an inside bar represents a high-probability setup or a pattern to ignore. Patience is the primary discipline that separates structured inside bar trading from random entry.
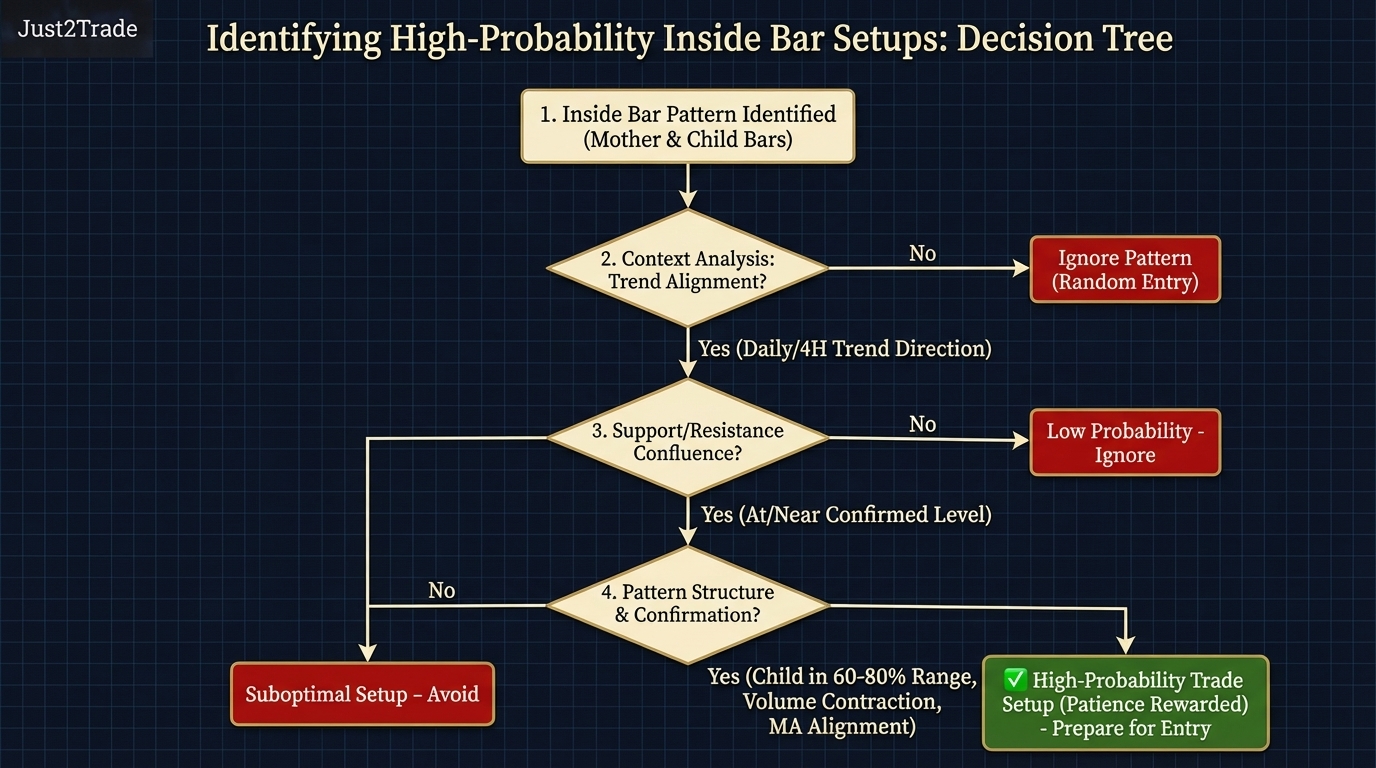)
High-probability inside bar setups share four characteristics: trend alignment, key support or resistance confluence, clean pattern structure, and confirmation from at least one additional technical factor.
Inside bar setups worth considering meet the following criteria:
- The pattern forms in the direction of the prevailing trend on the daily or 4-hour chart
- The mother bar forms at or near a confirmed support or resistance level
- The child bar sits within the inner 60-80% of the mother bar's range
- Moving average alignment confirms the directional bias
- Volume during child bar formation shows measurable contraction relative to the 20-period average
Inside Bars at Support and Resistance Levels
Inside bar patterns formed at major support and resistance levels produce the highest-probability setups in technical analysis.
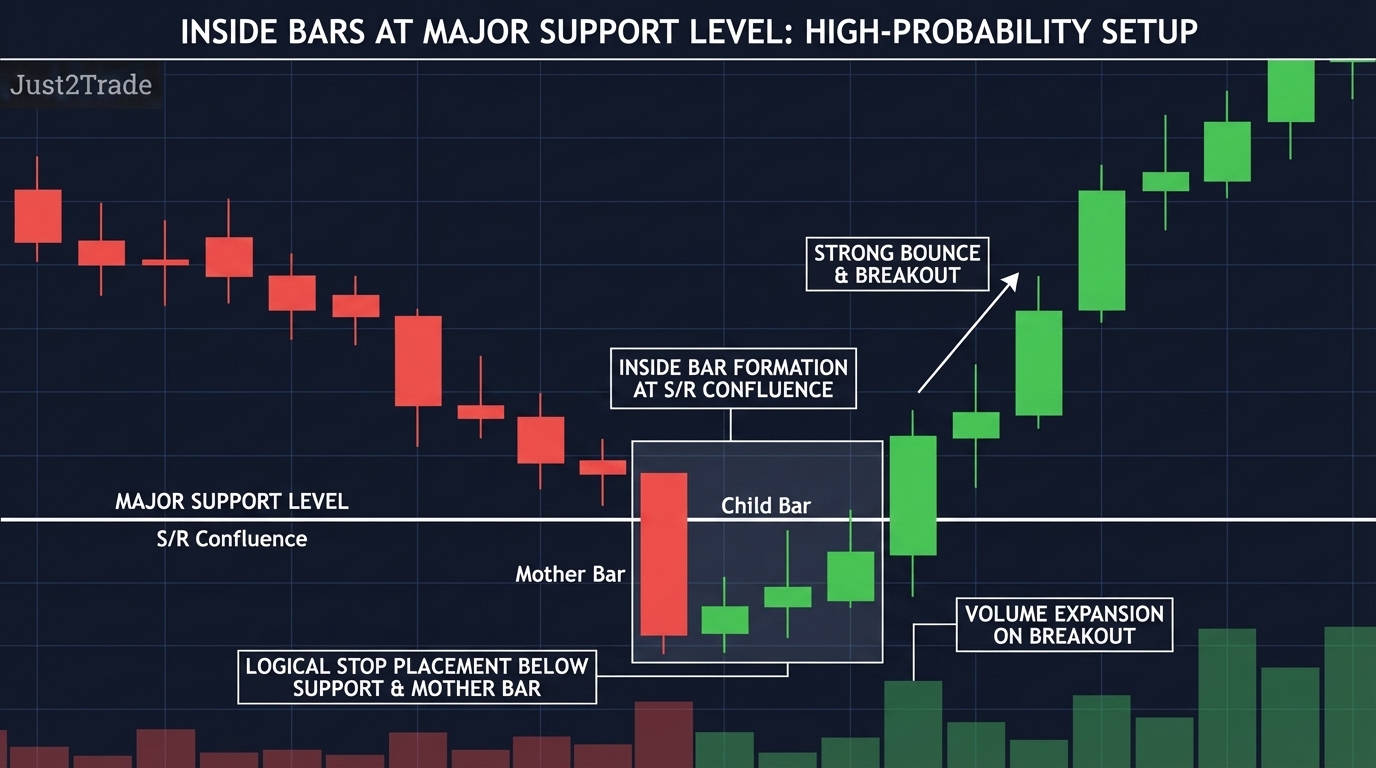)
Technical Analysis identifies support and resistance levels as the primary confluence points for inside bar setups. Technical Analysis applies a systematic methodology to locate these levels through prior swing highs and lows, volume nodes, and tested price boundaries.
When Technical Analysis confirms an inside bar is forming at a level where supply and demand have previously concentrated, multiple trader categories act on the same breakout simultaneously, expanding volume and extending the move. Stop placement below a confirmed support level and mother bar low provides the tightest logical risk definition available for the setup.
Trend Direction and Inside Bar Alignment
Inside bar patterns aligned with the prevailing Market Trend produce higher probability outcomes than counter-trend inside bar setups.
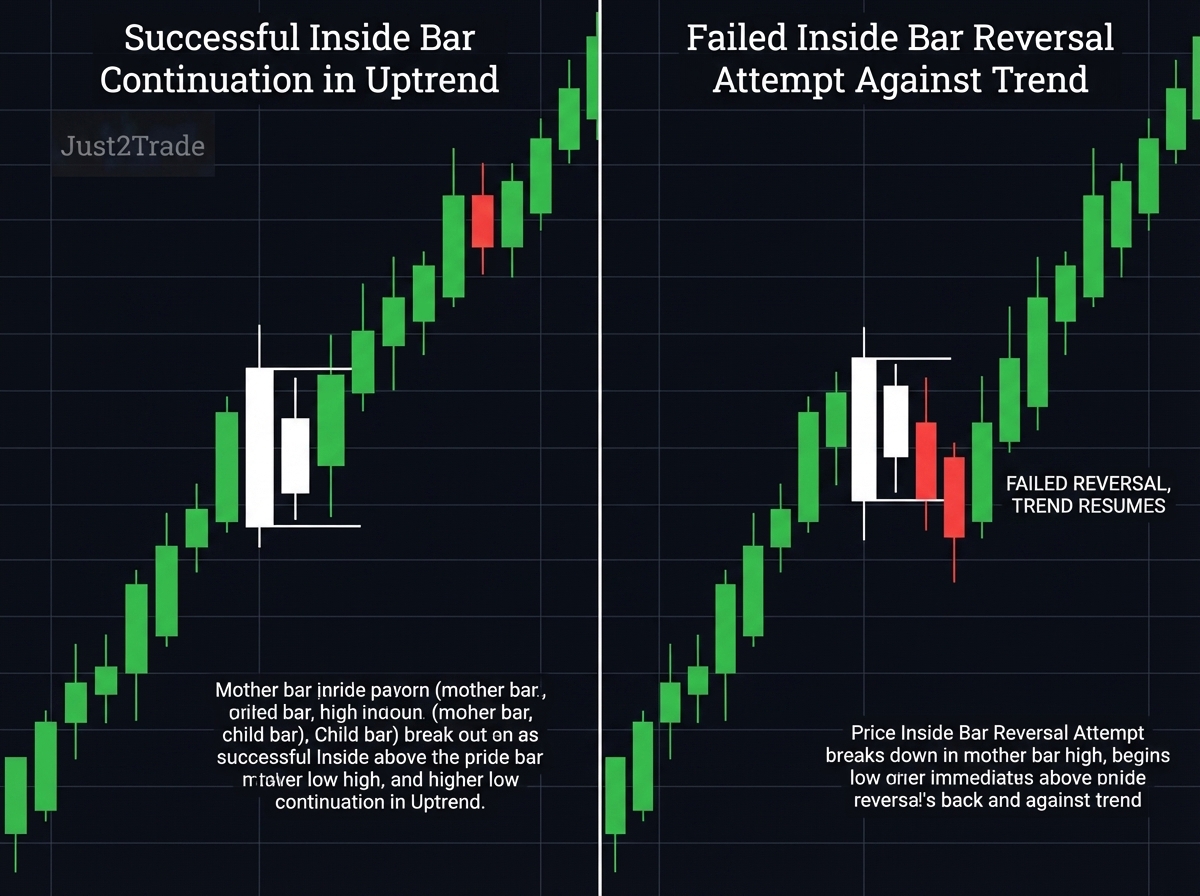)
Trend identification requires examining the higher timeframe chart before evaluating any inside bar. An uptrend displays a sequence of higher highs and higher lows. A downtrend displays lower highs and lower lows. Inside bars that break in the trend direction benefit from the momentum of larger participants already positioned in that direction.
Inside bars in trending markets serve as continuation patterns: price advances in the trend direction, consolidates into an inside bar, then resumes the trend when the breakout occurs.
Multiple Inside Bar Patterns (Inside Bar Squeeze)
Consecutive inside bars, where each successive bar fits within the range of the one before it, create an inside bar squeeze setup with disproportionate breakout potential.
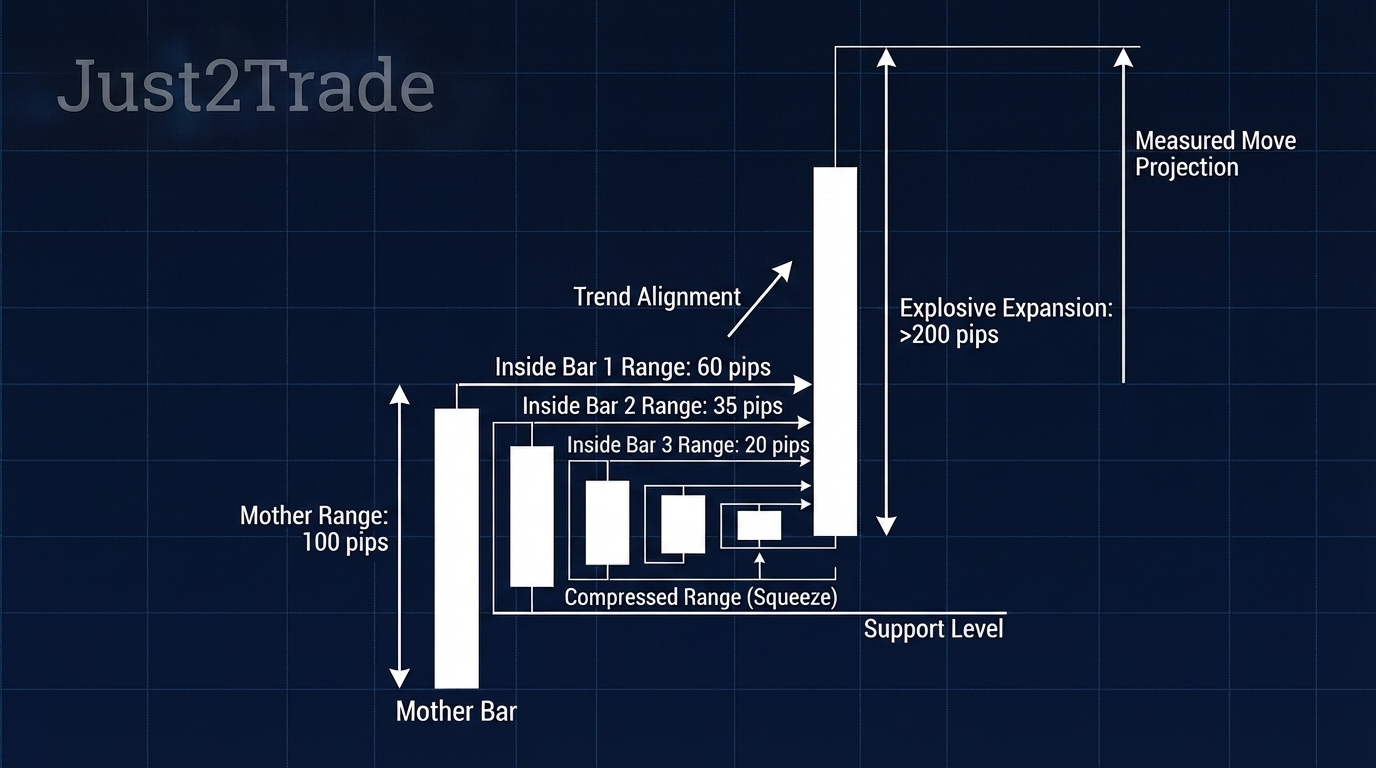)
The inside bar squeeze forms when two, three, or more inside bars stack consecutively. Each additional bar tightens the trading range and increases the compressed energy available for the subsequent breakout. Squeeze patterns are rare on daily charts.
When they occur at key support or resistance levels in trending markets, the subsequent breakout often produces a measured move exceeding the standard mother bar projection. Trading rules for squeeze patterns require the same filters as standard inside bar setups: trend alignment, support or resistance confluence, and entry only on the breakout of the original mother bar.
Inside Bar Trading Strategies: Entry Techniques
The inside bar pattern provides three entry signals within a Trading Strategy framework: aggressive breakout entry, conservative close entry, and retest entry.
Trading Strategy is the systematic approach that combines Inside Bar Pattern entry rules, exit rules, risk management, and position sizing into a repeatable process with the objective of controlled, disciplined participation.
Selecting the right entry method depends on market conditions, directional conviction, and individual risk tolerance — all of which the Trading Strategy framework must define before the trade is placed.
| Entry Method |
Entry Trigger |
Stop Placement |
Best Condition |
| Aggressive Breakout |
1-2 pips beyond mother bar high/low |
Beyond opposite side of mother bar |
Strong trend, clear directional bias |
| Conservative Close |
Bar closes beyond mother bar high/low |
Beyond opposite side of mother bar |
Choppy markets, mixed signals |
| Retest |
Pullback to broken mother bar level |
5-10 pips beyond retest candle |
Any condition with confirmed breakout |
Aggressive Breakout Entry Method
The aggressive breakout entry places a buy stop order 1-2 pips above the mother bar high, or a sell stop 1-2 pips below the mother bar low, before the breakout occurs.
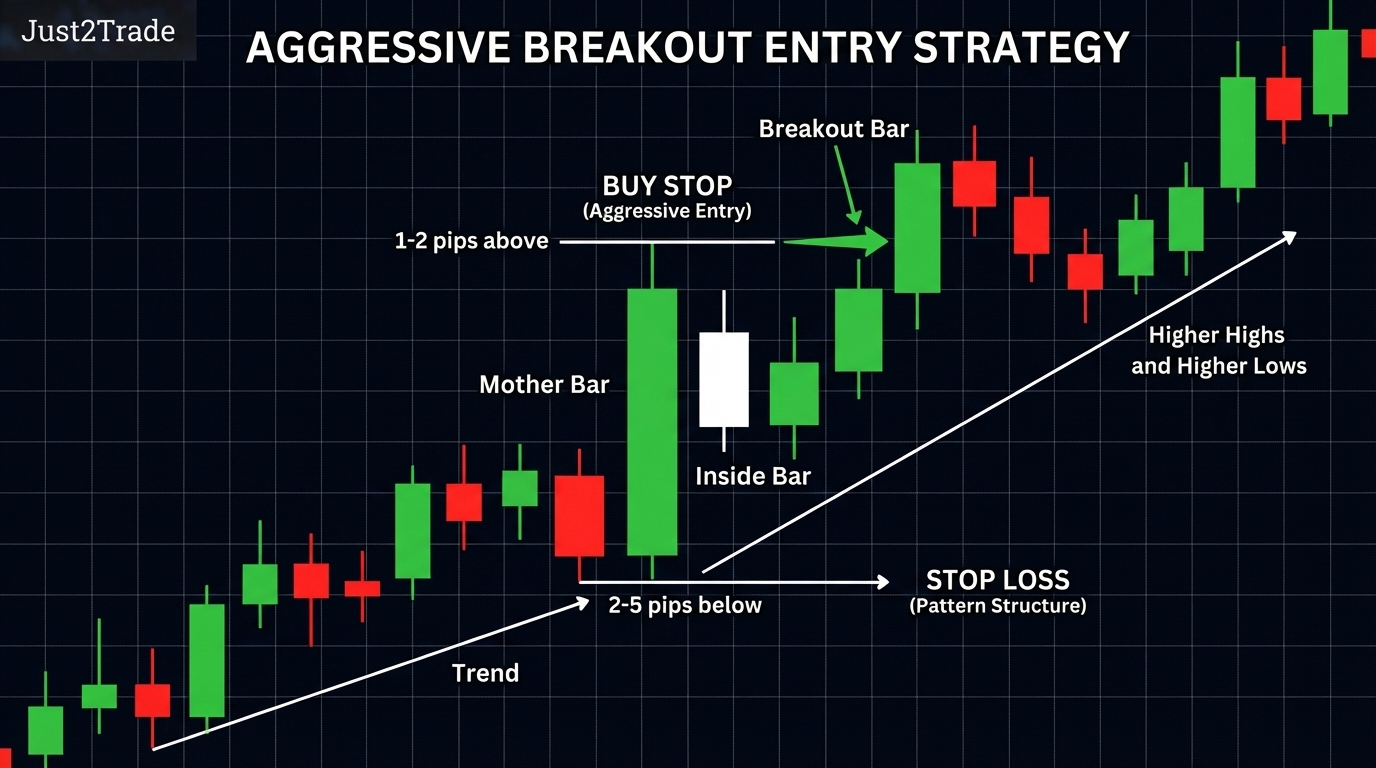)
The aggressive method captures the entire move from the initial breakout bar. The advantage is that fast, high-momentum breakouts never escape without triggering the trade. The disadvantage is exposure to false breakouts, where price briefly exceeds the mother bar boundary before reversing.
Aggressive entries perform best in strongly trending markets where directional bias is clear. Stop placement goes 2-5 pips beyond the opposite side of the mother bar, providing a clear invalidation level based on the pattern's structure.
Conservative Breakout Close Entry Method
The conservative close entry waits for a bar to close beyond the mother bar high or low before entering the trade on the next bar's open.
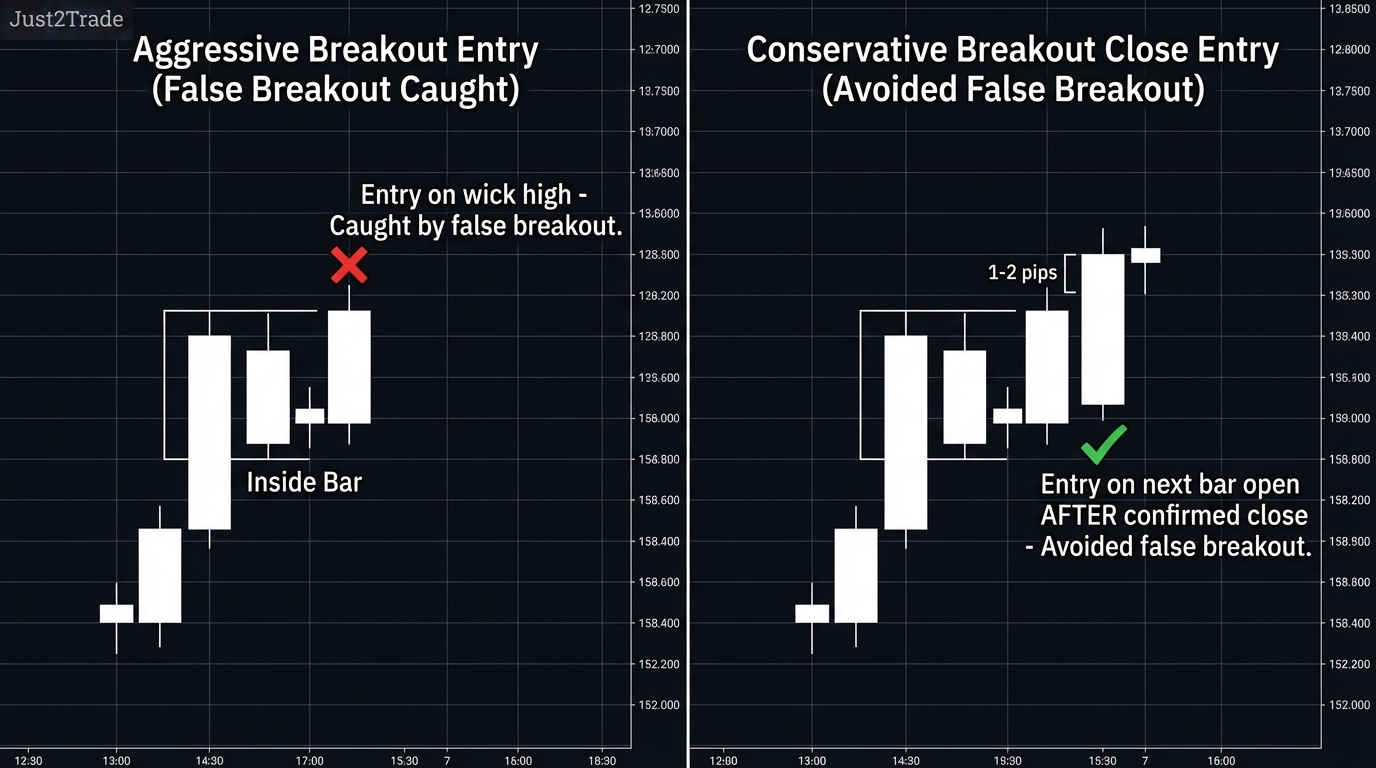)
Price Action validates breakout legitimacy through bar close confirmation. Price Action analysis defines a legitimate breakout as one where price sustains beyond the boundary through the bar's close, reflecting genuine conviction rather than a momentary spike.
The specific confirmation rules: the closing price must exceed the mother bar high by at least 1-2 pips for a valid long confirmation, and entry occurs at the open of the following bar. Conservative entries suit choppy market conditions and setups with multiple conflicting signals.
Retest Entry Method (Highest Win Rate)
The retest entry waits for the initial breakout, then enters as price returns to test the broken mother bar level as new support or resistance.
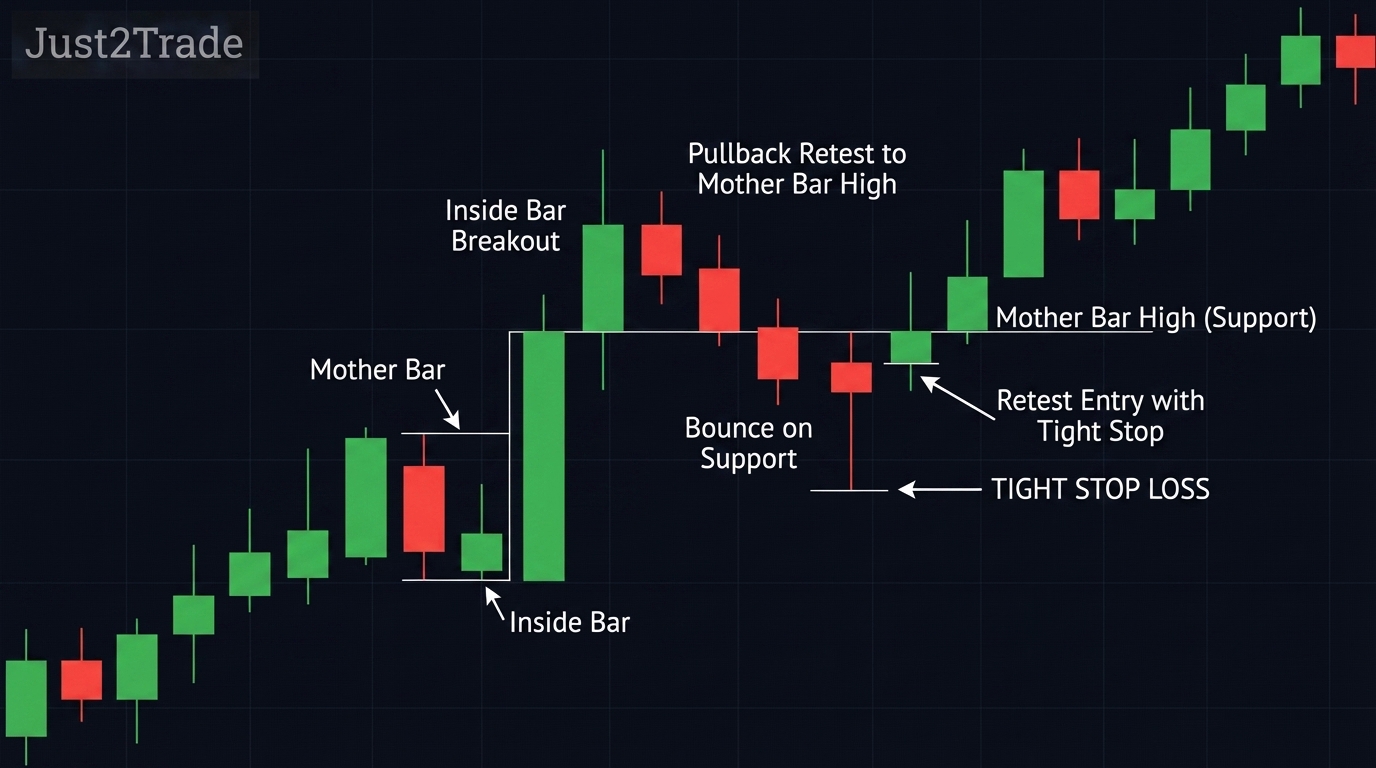)
The retest entry exploits the Support and Resistance role reversal principle: when price breaks above the mother bar high, that level transitions from resistance to support. Entering on the retest of that new support provides a tighter stop and a better entry price than the aggressive method.
Valid retest entries require three confirming conditions: volume must dry up during the pullback, price must hold above the broken mother bar level on a closing basis, and the retest candle should show rejection through a long lower wick or a closing price near the session high.
Patience is the defining requirement of this method. Traders who pre-define the specific price level where the retest entry triggers and place limit orders remove the timing pressure that causes many traders to abandon this approach prematurely. A retest that closes back inside the mother bar signals a failed breakout and invalidates the setup entirely.
Stop Loss Placement for Inside Bar Trades
Stop loss placement for inside bar pattern trades must reflect pattern invalidation logic. The stop goes at the level where the inside bar setup is no longer valid.
)
Three stop placement methods suit inside bar trading. All three share one principle: the stop reflects where the inside bar pattern fails, not where the trader would prefer not to lose money. Stop placement discipline is the primary factor separating accounts that survive drawdown periods from accounts that do not.
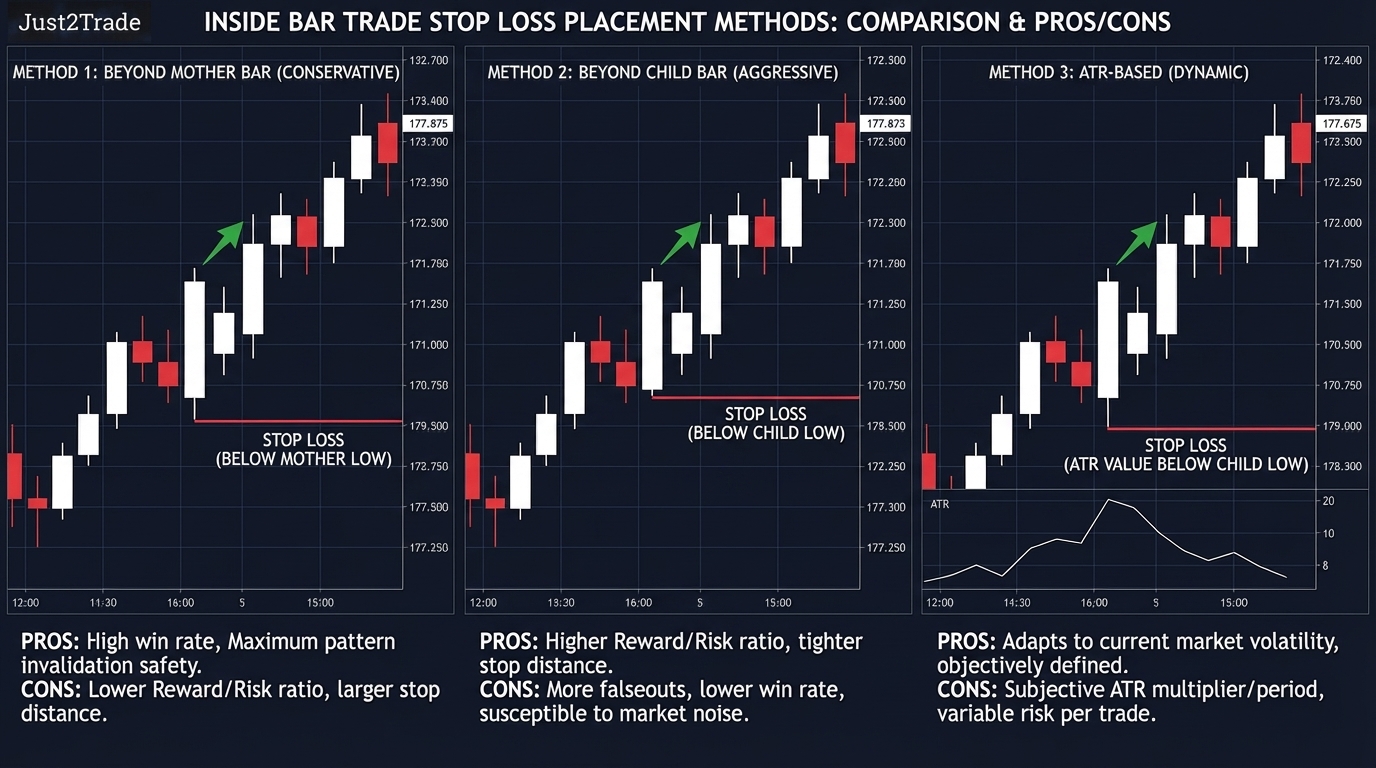
Standard Stop Beyond Mother Bar
The standard stop places the exit order 2-5 pips beyond the opposite side of the mother bar from the entry direction.
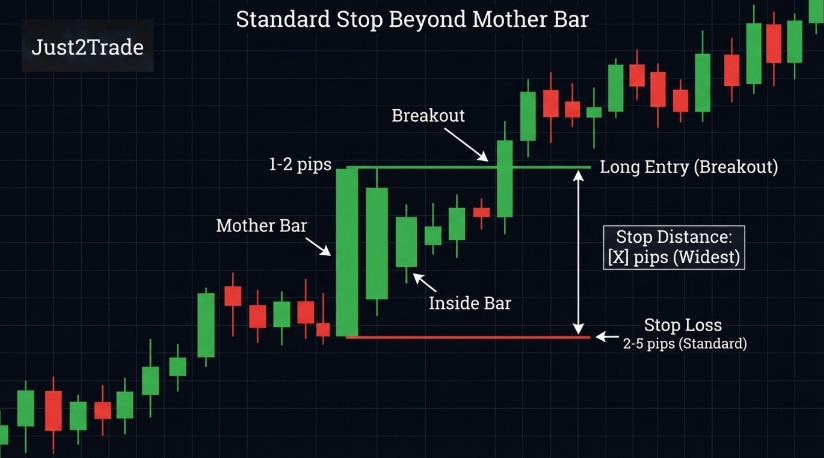)
A long trade entered on an upside breakout of the mother bar high carries the stop 2-5 pips below the mother bar low. If price breaks below the mother bar low after triggering a long entry above the mother bar high, the inside bar pattern is invalidated and the trade's premise no longer holds.
The standard method produces the widest stop distance of the three options, requiring smaller position sizes to maintain 1-2% account risk.
Tight Stop Beyond Child Bar
The tight stop places the exit order beyond the child bar rather than the mother bar, reducing risk distance compared to the standard method.
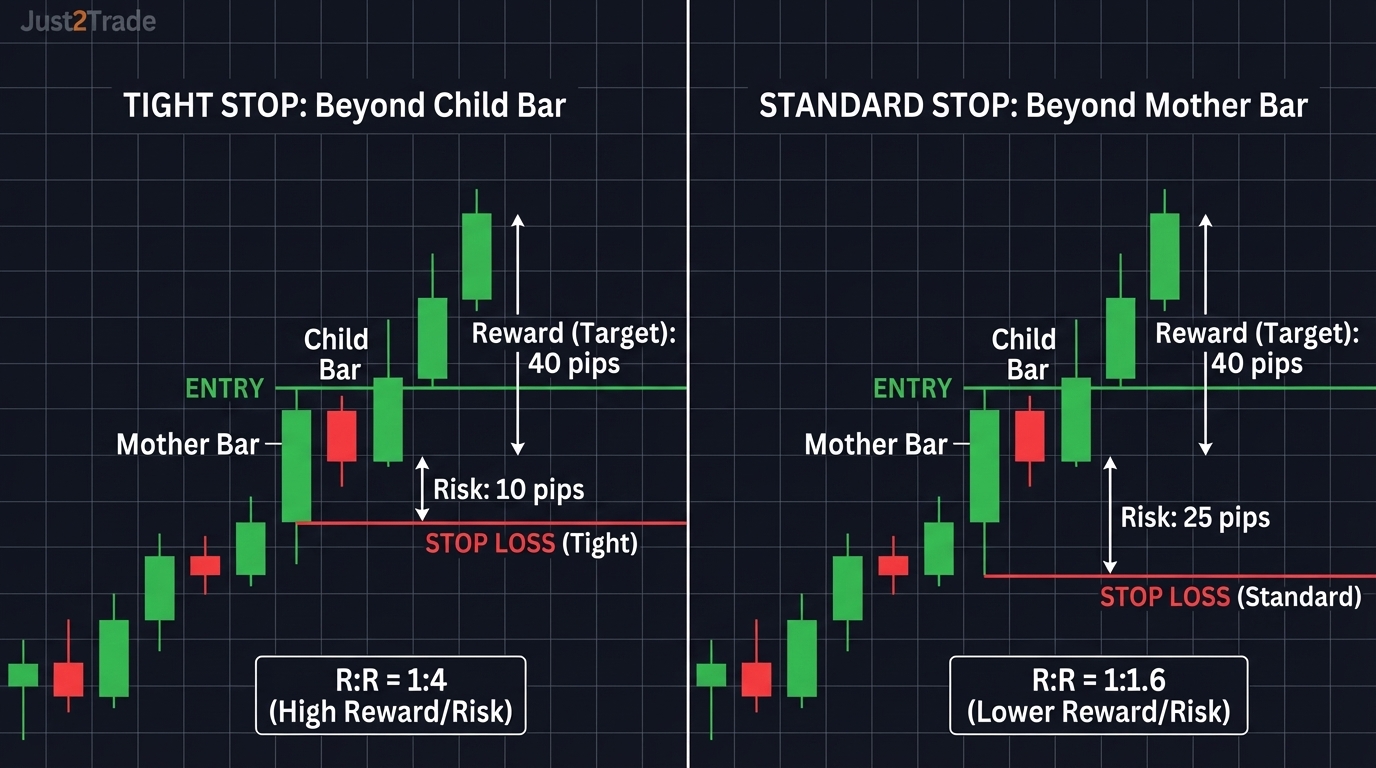)
Tight stops suit traders with high-conviction setups: strong trend alignment, key support or resistance confluence, volume confirmation, and a child bar positioned tightly within the mother bar.
The improved risk-to-reward ratio compensates for the higher stop-out frequency. Ranging markets and inside bars without strong directional context make the tight stop method unreliable because random price movement repeatedly stops out the position before the breakout develops.
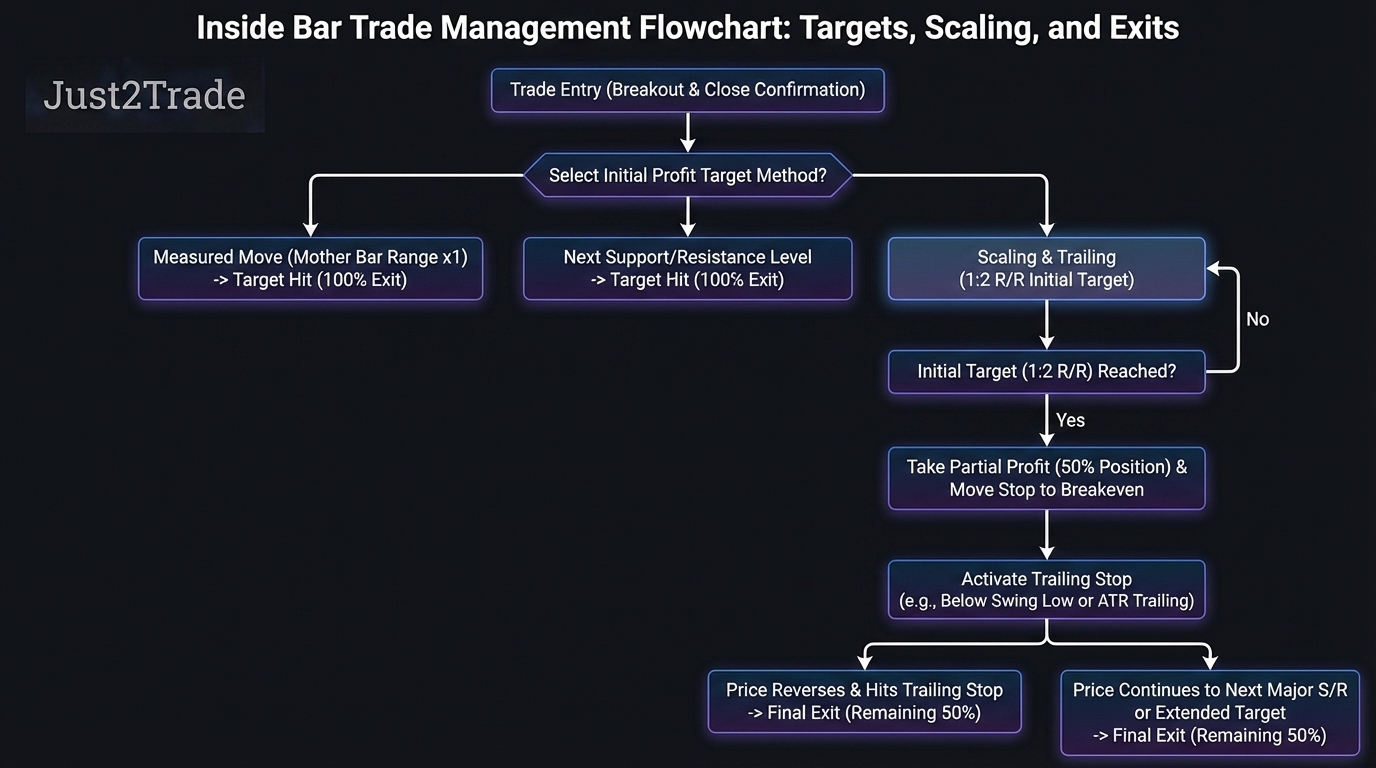
Profit Targets and Trade Management
Profit target selection for inside bar pattern trades uses three methods: the measured move, the next support or resistance level, and partial scaling combined with a trailing stop. The scaling and trailing combination captures initial profits at 1:2 risk-to-reward while leaving a portion of the position to run with the trend.
)
Measured Move Targets
The measured move target projects the mother bar's height from the breakout point to establish a minimum profit objective.
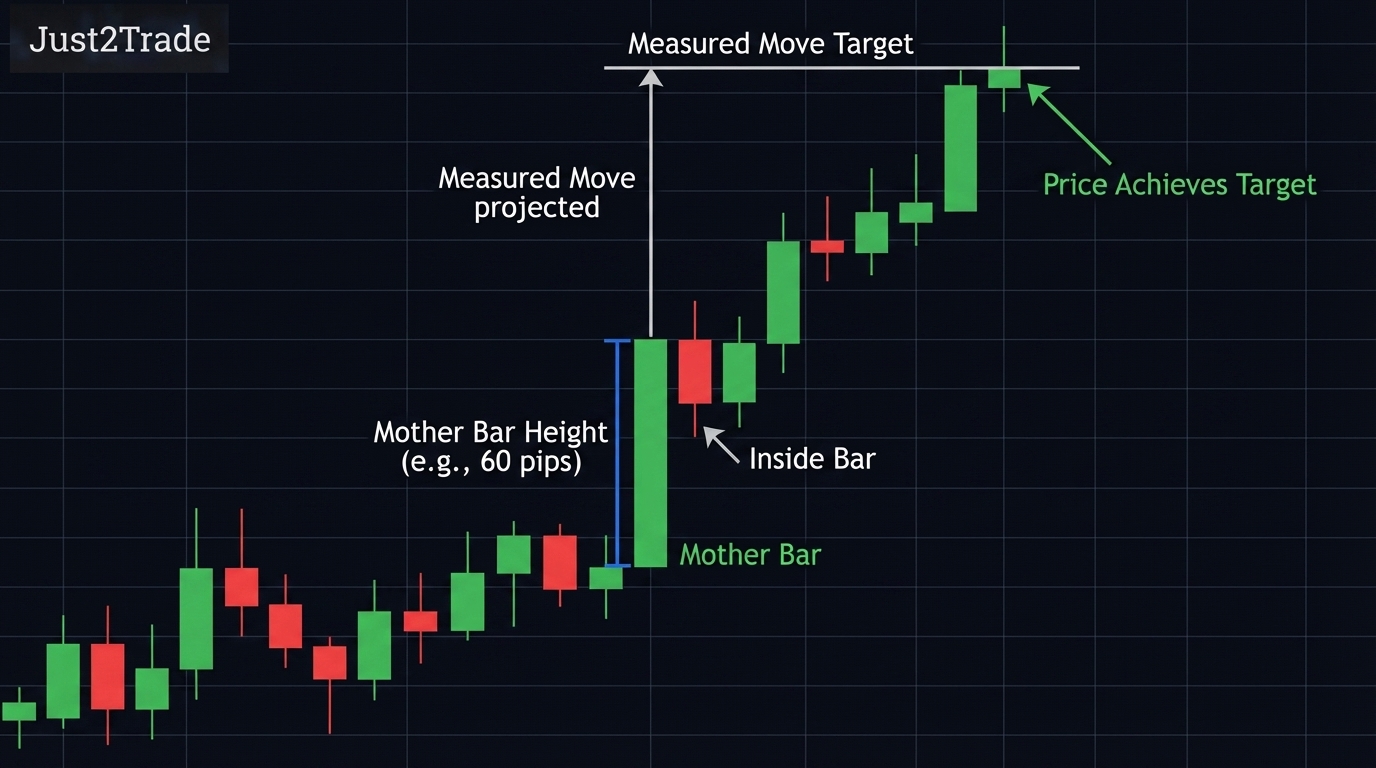)
Measurement procedure: subtract the mother bar low from the mother bar high to obtain the mother bar range, then add that range to the entry price for a long trade (or subtract for a short trade) to obtain the measured move target.
A mother bar spanning 60 pips produces a 60-pip measured move target from entry. Measured move targets represent a mechanical minimum objective and must be evaluated against the chart's structural levels before the trade is placed. Markets with nearby structural obstacles may not reach the measured move at all.
Support/Resistance Target Method
The support and resistance target method sets profit objectives at the next confirmed price level rather than at the calculated measured move distance.
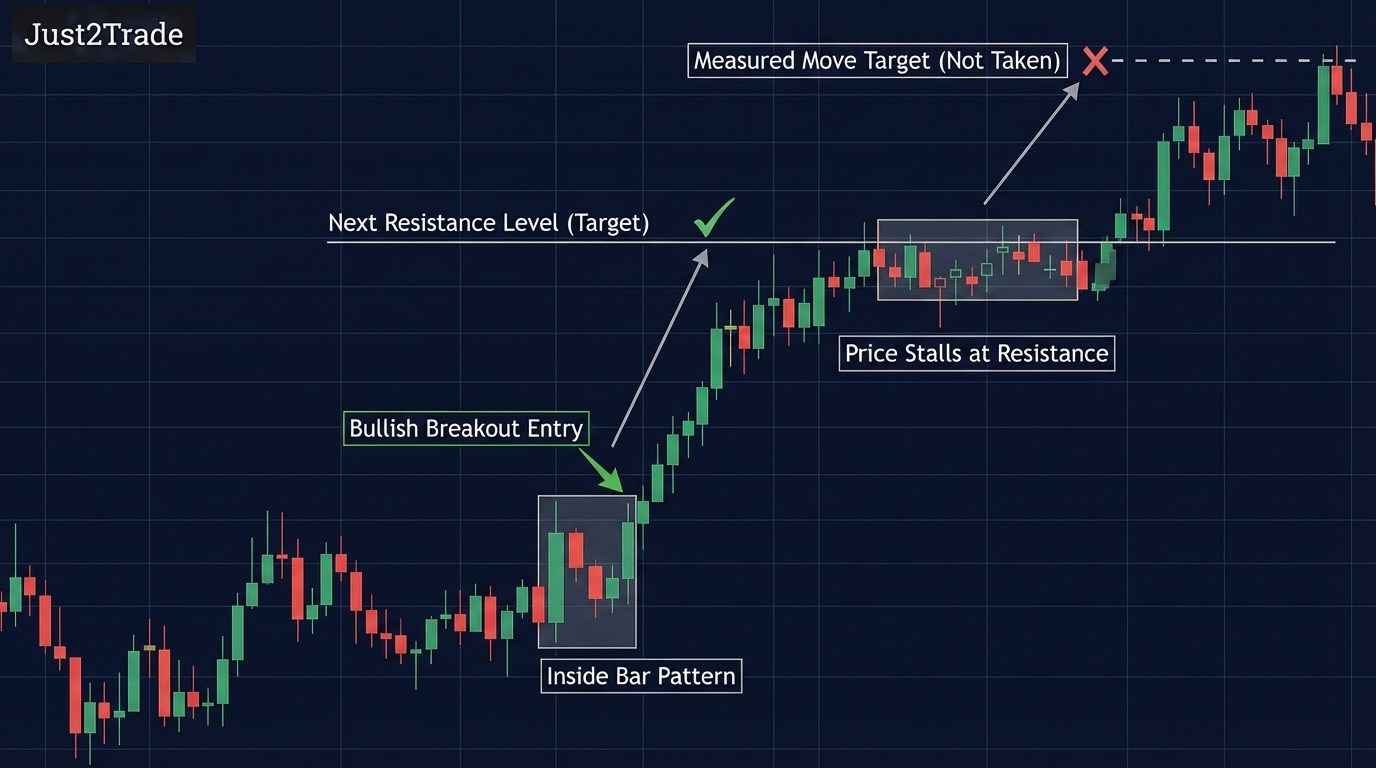)
Technical Analysis identifies these target levels through prior swing highs for long trades and prior swing lows for short trades. A long inside bar breakout that faces confirmed resistance 45 pips above entry should use 45 pips as the primary target regardless of a wider measured move calculation. Attempting to hold through a major resistance level extends risk beyond what the structure supports.
Scaling Out and Trailing Stops
The scaling approach closes half the position at 1:2 risk-to-reward, moves the stop to breakeven, and trails the remainder with a dynamic stop below recent swing lows.
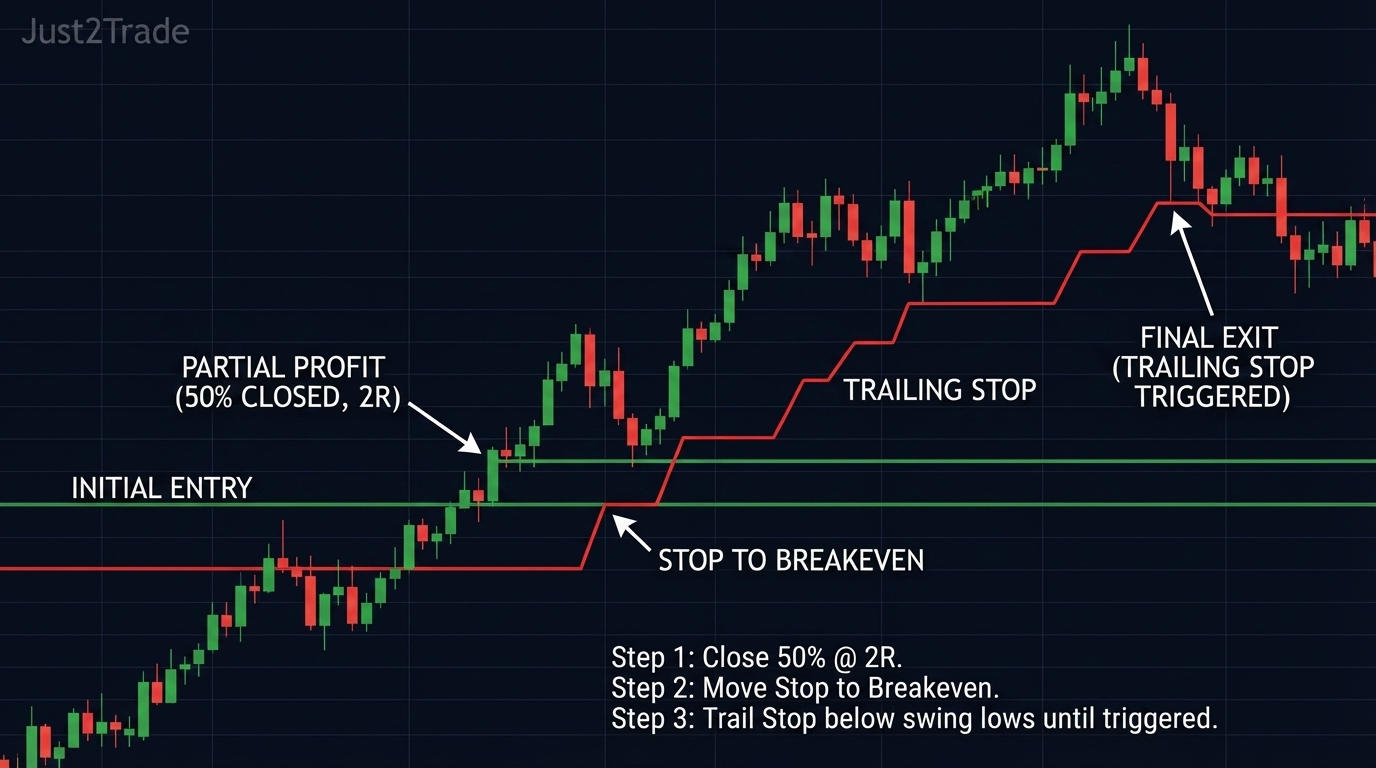)
Step 1: Close 50% of the position when price reaches 2R profit.
Step 2: Move the stop on the remaining position to the entry price, eliminating further financial risk on the trade.
Step 3: Trail the stop below each successive swing low in an uptrend, or above each successive swing high in a downtrend, until the trailing stop triggers.
The psychological benefit of secured profit at the first target allows the trailing position to run without emotional interference.
Inside Bar Pattern in Different Market Conditions
Inside bar pattern effectiveness changes significantly across trending, ranging, and transitional market conditions.
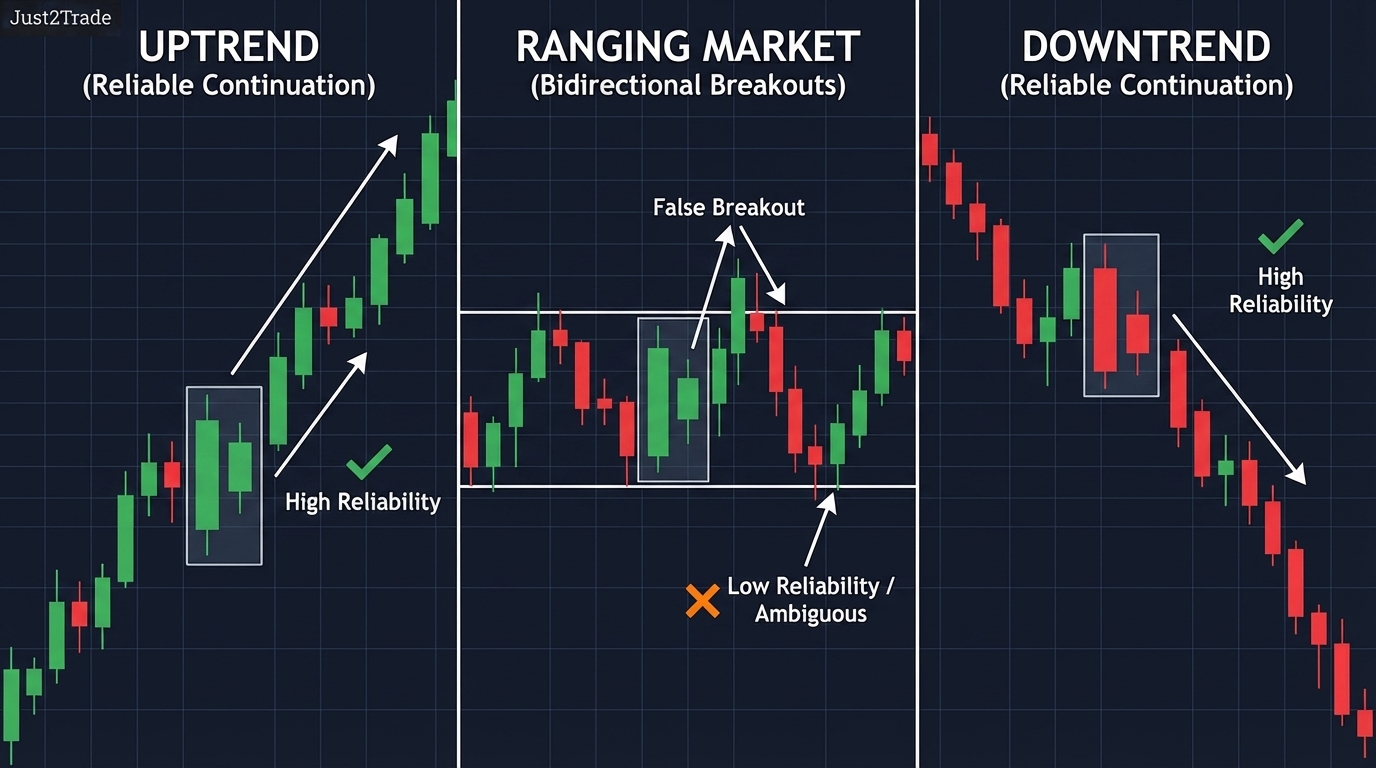)
Strong trends produce the most reliable inside bar continuation setups. Ranging markets reduce reliability and require additional confirmation before entry. Transitional markets produce the most ambiguous inside bar signals.
Trading Inside Bars in Trending Markets
Inside bar patterns in strong trending markets function as continuation setups, signalling temporary pauses before the trend resumes.
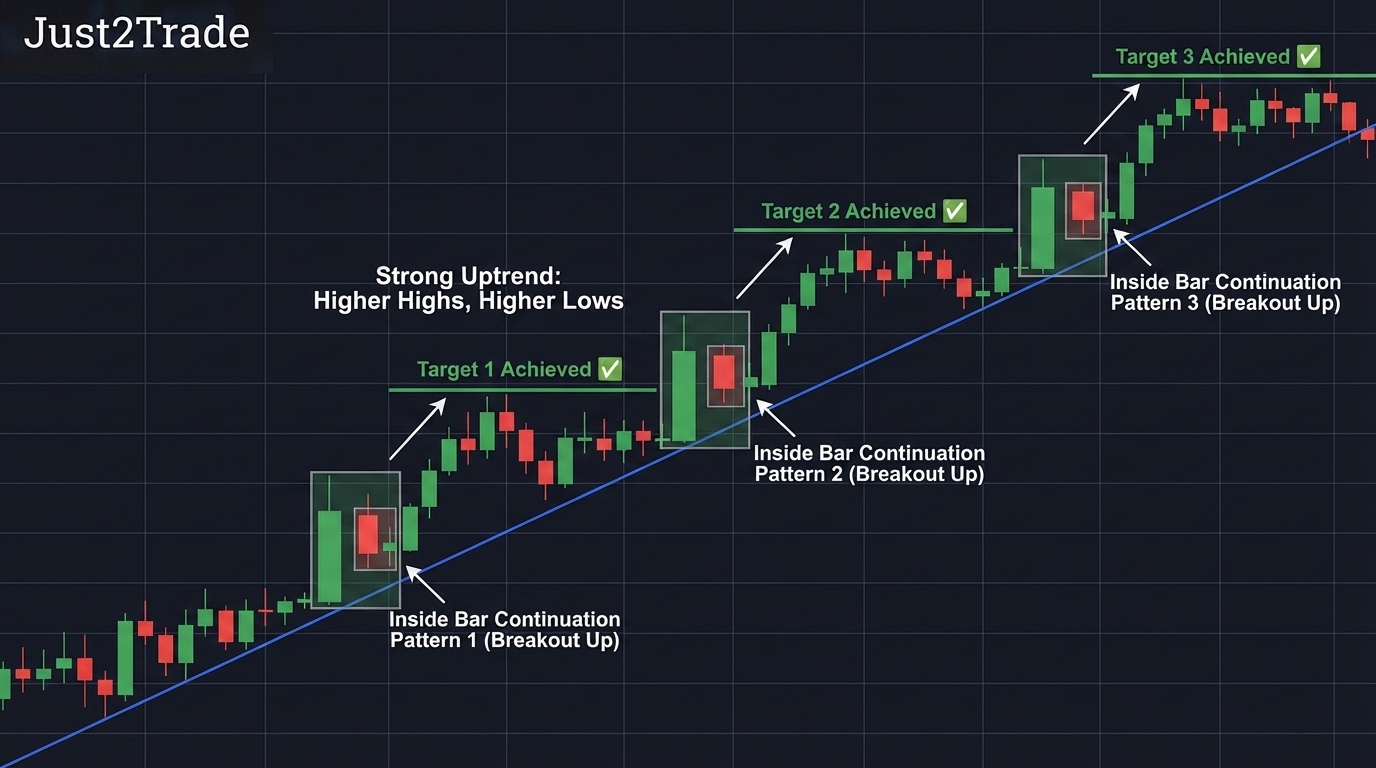)
Trend confirmation on the daily chart requires three consecutive higher highs and higher lows for an uptrend, or three consecutive lower highs and lower lows for a downtrend. Inside bars forming during these trends represent short-term consolidations within the larger directional move.
The breakout in the trend direction benefits from the momentum of institutional positions already established in that direction.
Inside Bars in Ranging Markets
Inside bar patterns in ranging markets produce bidirectional breakouts with lower reliability, requiring extra confirmation before entry.
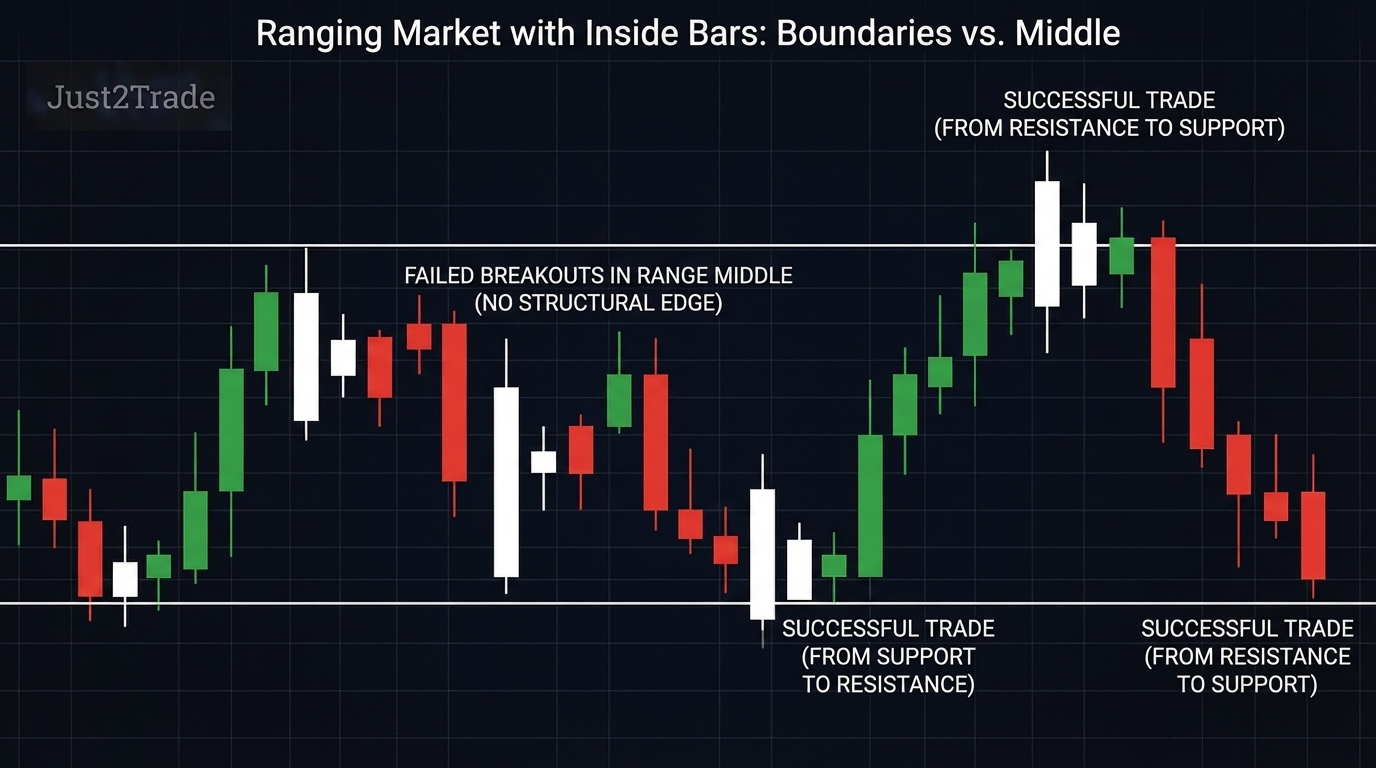)
Ranging markets lack the directional force that makes trend continuation inside bars reliable. Inside bars in the middle of a defined range provide no structural edge because price may break in either direction.
The only inside bar setups worth considering in ranging conditions form at the range boundaries: at confirmed support near the range low or confirmed resistance near the range high. Target is set to the opposite range boundary.
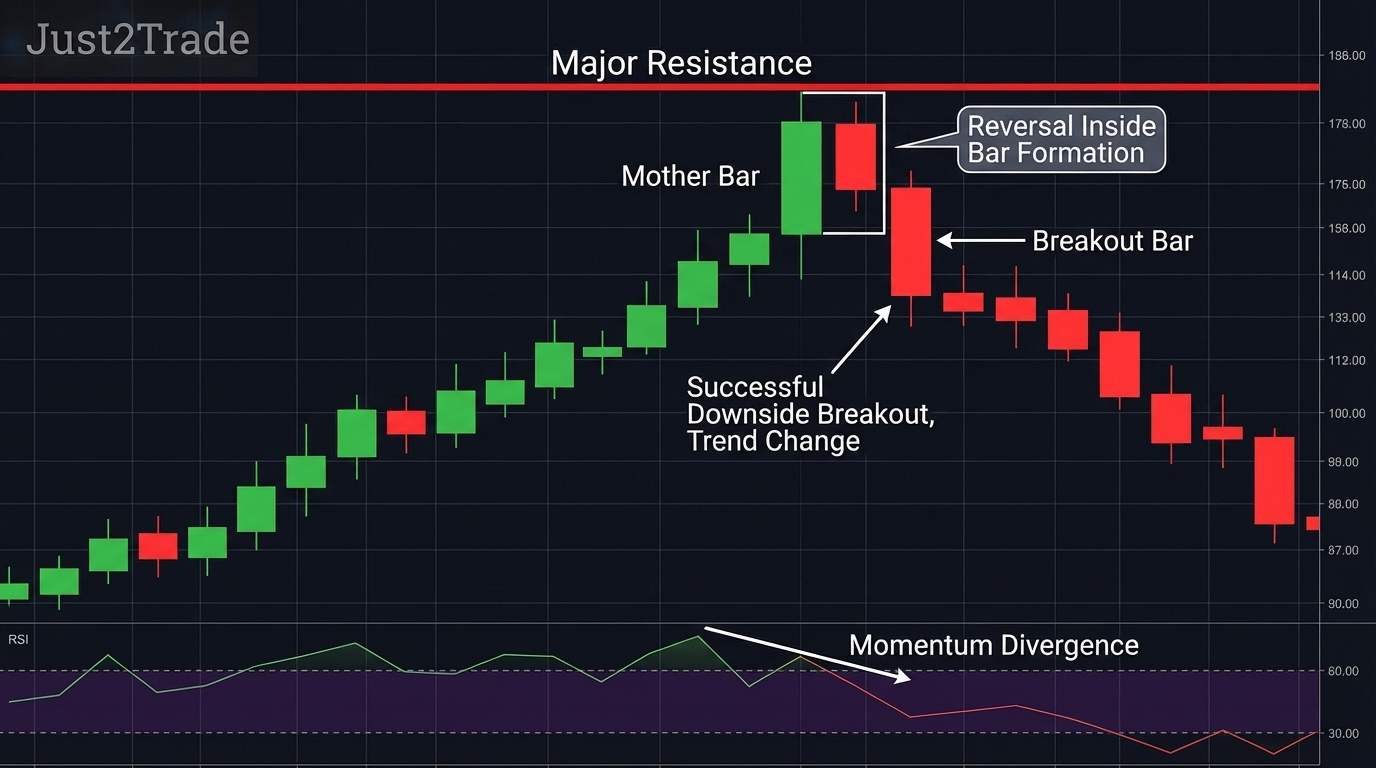
Inside Bars at Major Trend Reversals
Inside bar patterns at extended trend extremes and major Support and Resistance levels can signal trend reversals, but require stricter confirmation than continuation setups.
)
Reversal inside bar setups should include at minimum three confirming factors: an extended prior trend showing clear overextension from moving averages, a major Support and Resistance level tested multiple times, and a momentum divergence signal on RSI or MACD.
Reversal setups carry lower base probability than continuation setups. Traders pursuing reversal inside bars should apply conservative or retest entry methods and accept tighter targets at the nearest structural level.
Combining Inside Bars with Other Technical Indicators
Inside bar patterns combined with select Technical Analysis tools produce more precise entries than price action alone. The most effective combinations use moving averages for trend context, volume for breakout confirmation, and RSI divergence for reversal identification.
)
The following technical tools improve inside bar pattern reliability when applied correctly:
- The 50-period Simple Moving Average (SMA) filters trend direction: only trade inside bar breakouts in the direction of price relative to the 50 SMA
- The 200-period SMA identifies the major trend: inside bar breakouts with price above the 200 SMA in uptrend conditions carry a stronger structural edge
- Volume confirmation requires breakout volume to exceed the 20-period average volume by at least 50%
- RSI readings below 40 on a bullish inside bar setup, or above 60 on a bearish setup, confirm momentum alignment
Moving Averages and Inside Bar Alignment
Moving average alignment with the inside bar breakout direction reduces false breakout frequency and improves trend identification precision.
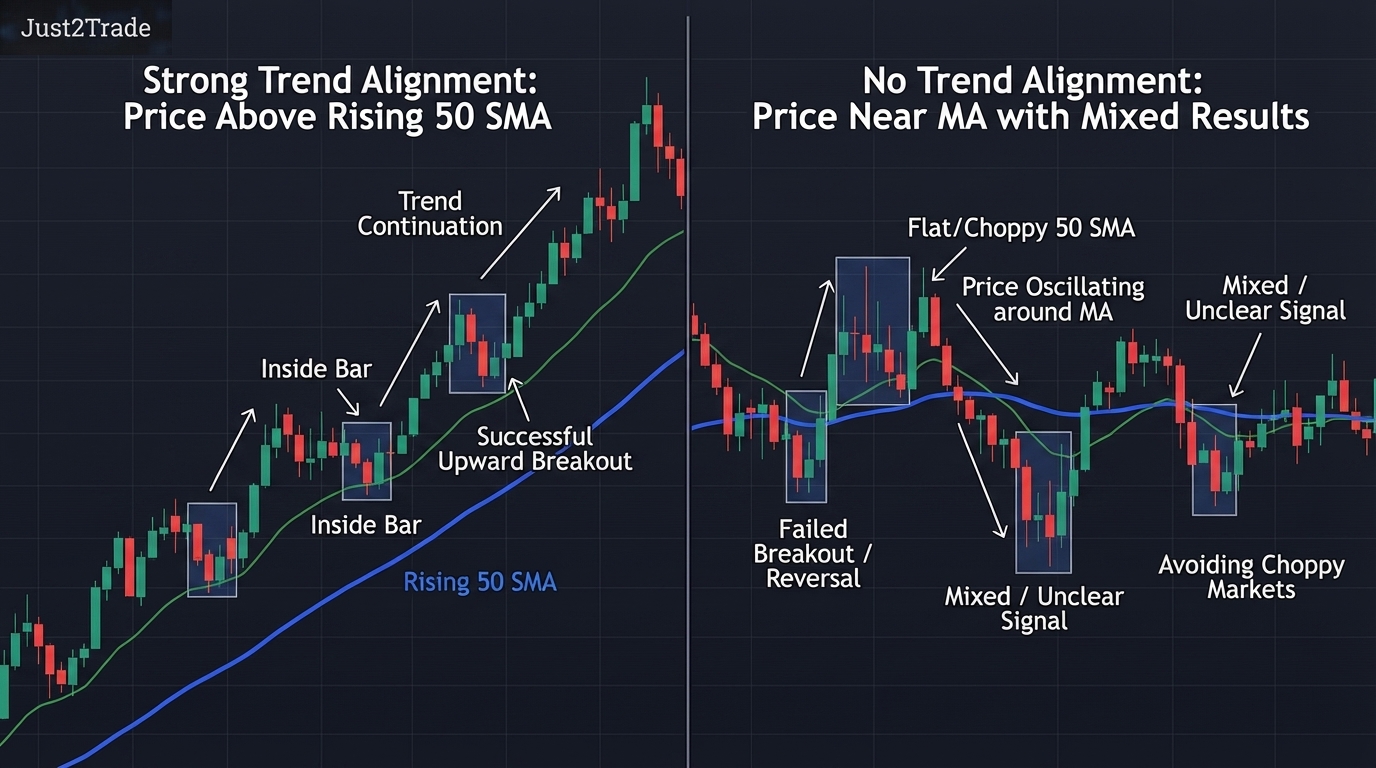
The 20 Exponential Moving Average (EMA) serves as the short-term trend filter. The 50 SMA identifies the intermediate trend. The 200 SMA confirms the major trend direction. An inside bar breakout aligned with all three moving averages produces the strongest signal combination.
Inside bars where price oscillates around the 50 SMA indicate a market lacking clear directional bias and should be avoided.
Volume Confirmation for Inside Bar Breakouts
Volume Analysis confirms whether an inside bar breakout represents genuine directional conviction or a false move likely to reverse.
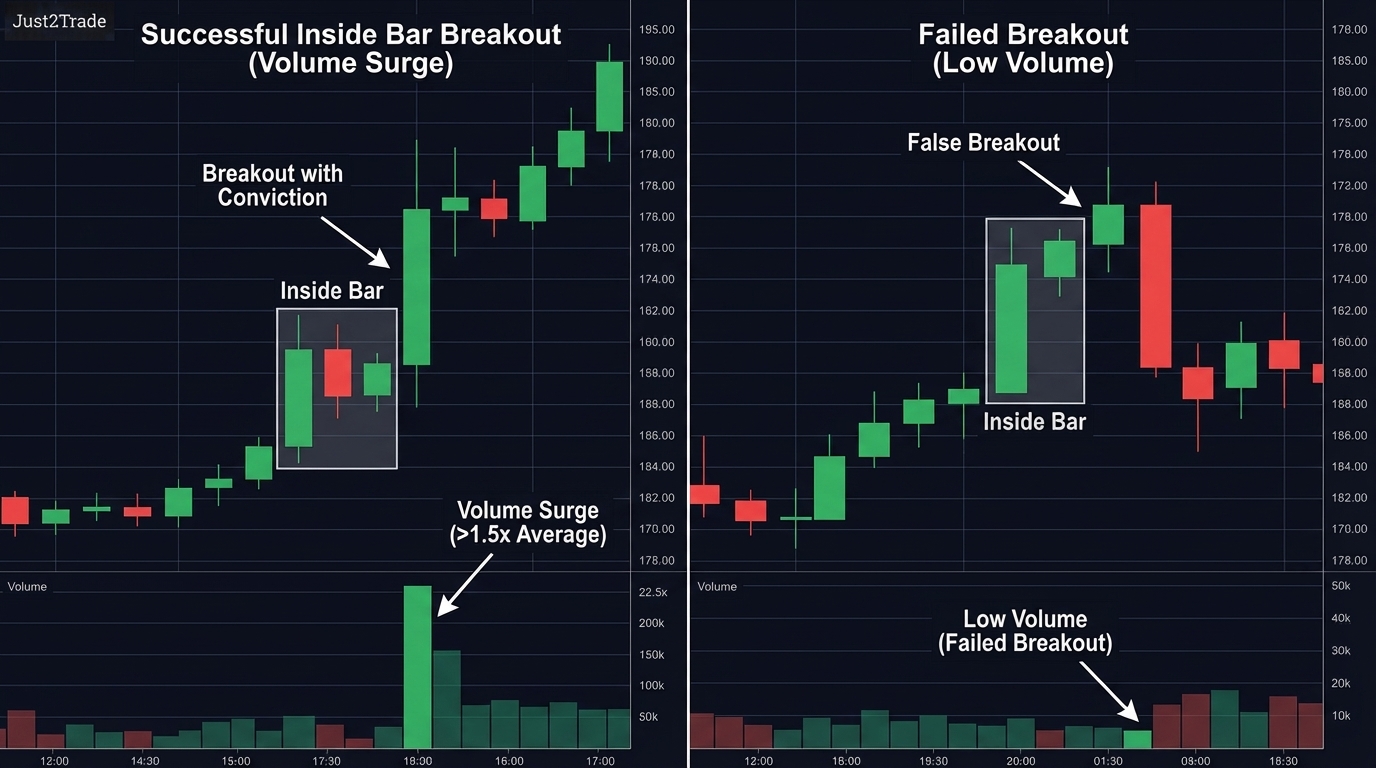
Inside bar formation typically shows below-average volume as market participants pause. A valid breakout bar should show volume at least 1.5 times the 20-period average. Breakouts on below-average volume show a materially higher incidence of false breakout behaviour, particularly in ranging market conditions. In spot forex markets, tick volume serves as a reliable substitute for actual volume and displays the same confirmation pattern.
RSI Divergence and Inside Bar Reversal Setups
Inside bar patterns combined with RSI divergence at market extremes create reversal setups with defined entry, stop, and target parameters.
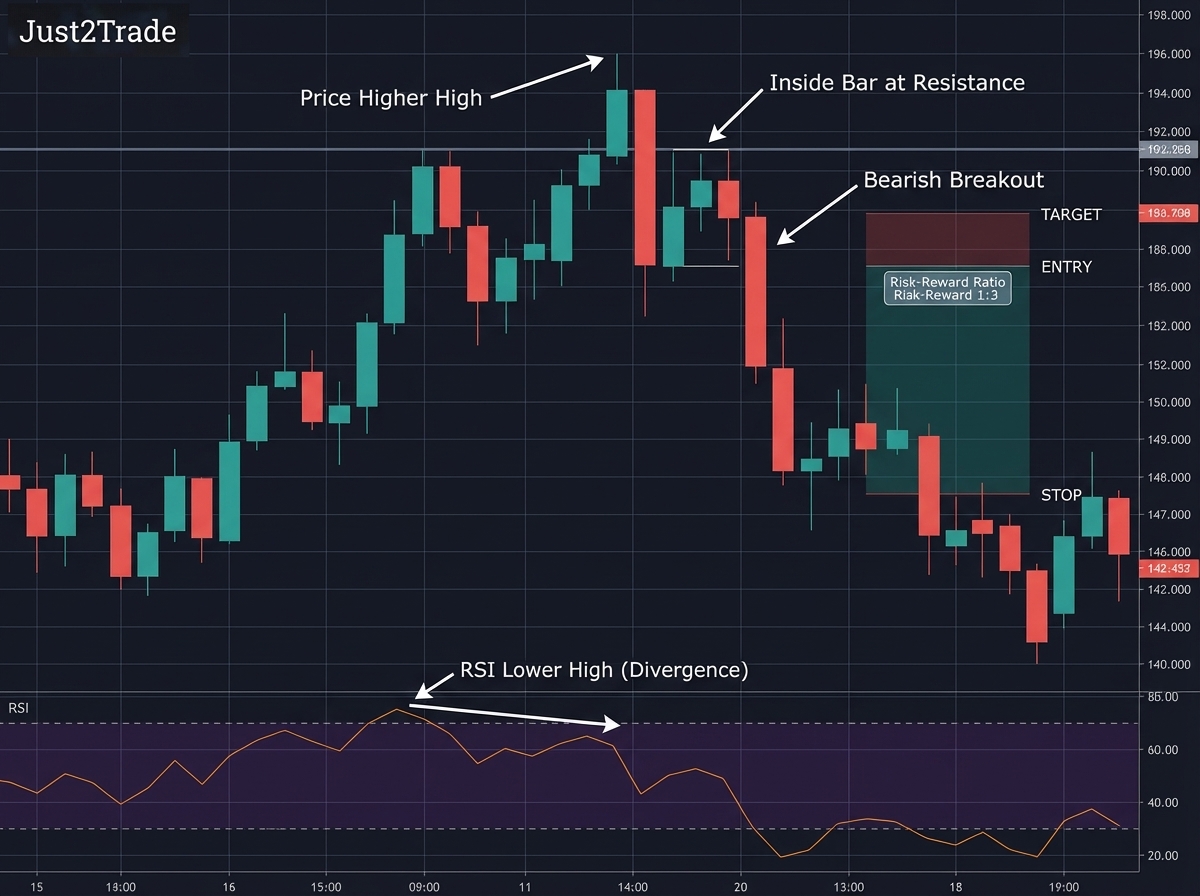
Bearish RSI divergence occurs when price makes a higher high but RSI forms a lower high, signalling weakening momentum. When an inside bar forms at a major resistance level during a bearish RSI divergence sequence, the setup combines three independent reversal signals: momentum exhaustion (divergence), overhead supply (resistance), and range compression (inside bar).
Bullish RSI divergence at support with an inside bar provides the same triple confirmation for upside reversals. These setups are rare on daily charts, but the risk-to-reward ratio often reaches 1:3 or higher when all three conditions align.
Common Inside Bar Trading Mistakes
Inside bar trading mistakes divide into three categories: context neglect, overtrading, and inadequate risk management.
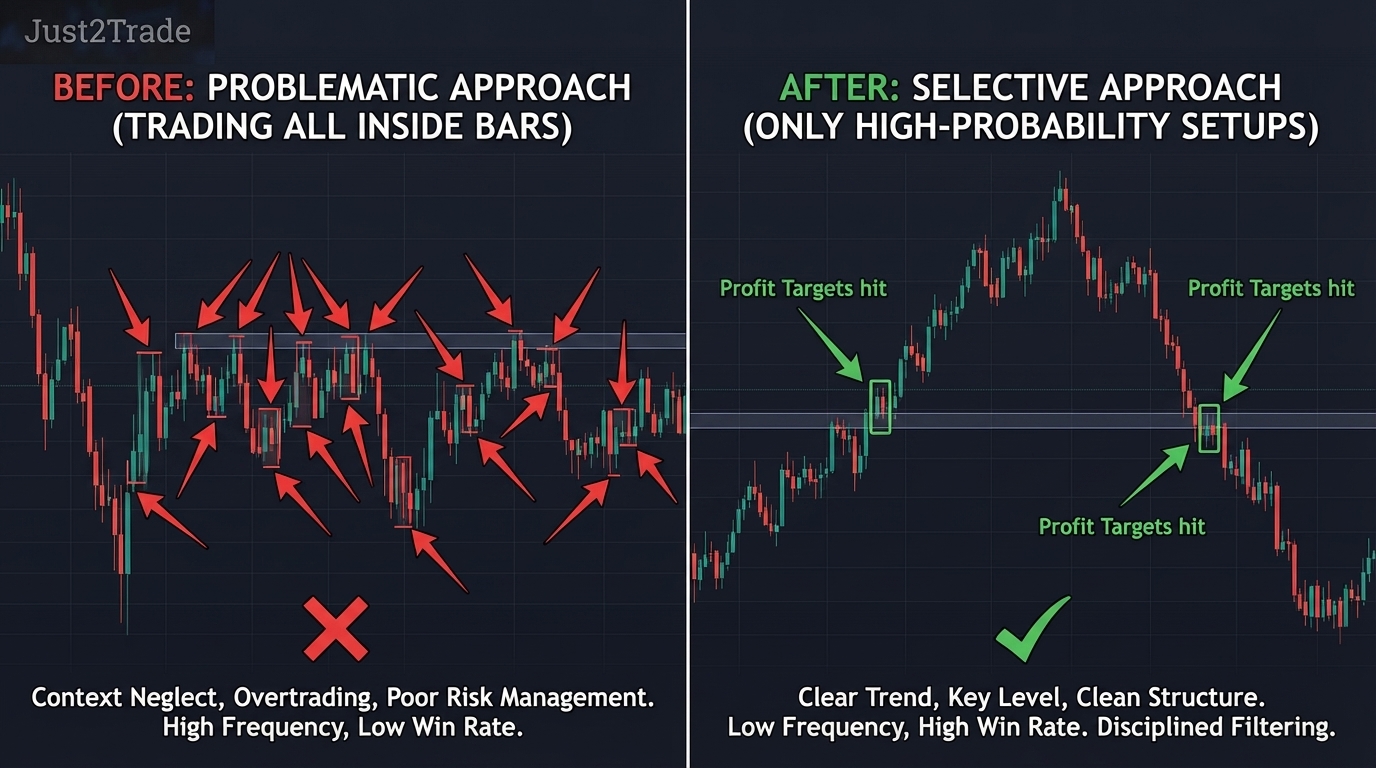
Reviewing the trade log made the problem obvious: every profitable setup shared three characteristics — a clear trend, a key level, and a clean pattern structure — and every losing setup was missing at least one of those three.
That log review produced a disciplined filtering process that reduced trade frequency and concentrated capital on setups with more structural support. Eliminating the three mistakes below is more important than refining any entry technique.
Mistake #1: Ignoring Market Context
Trading inside bar patterns without first identifying the prevailing Market Trend and key structural levels is the most frequently cited cause of inside bar losses.
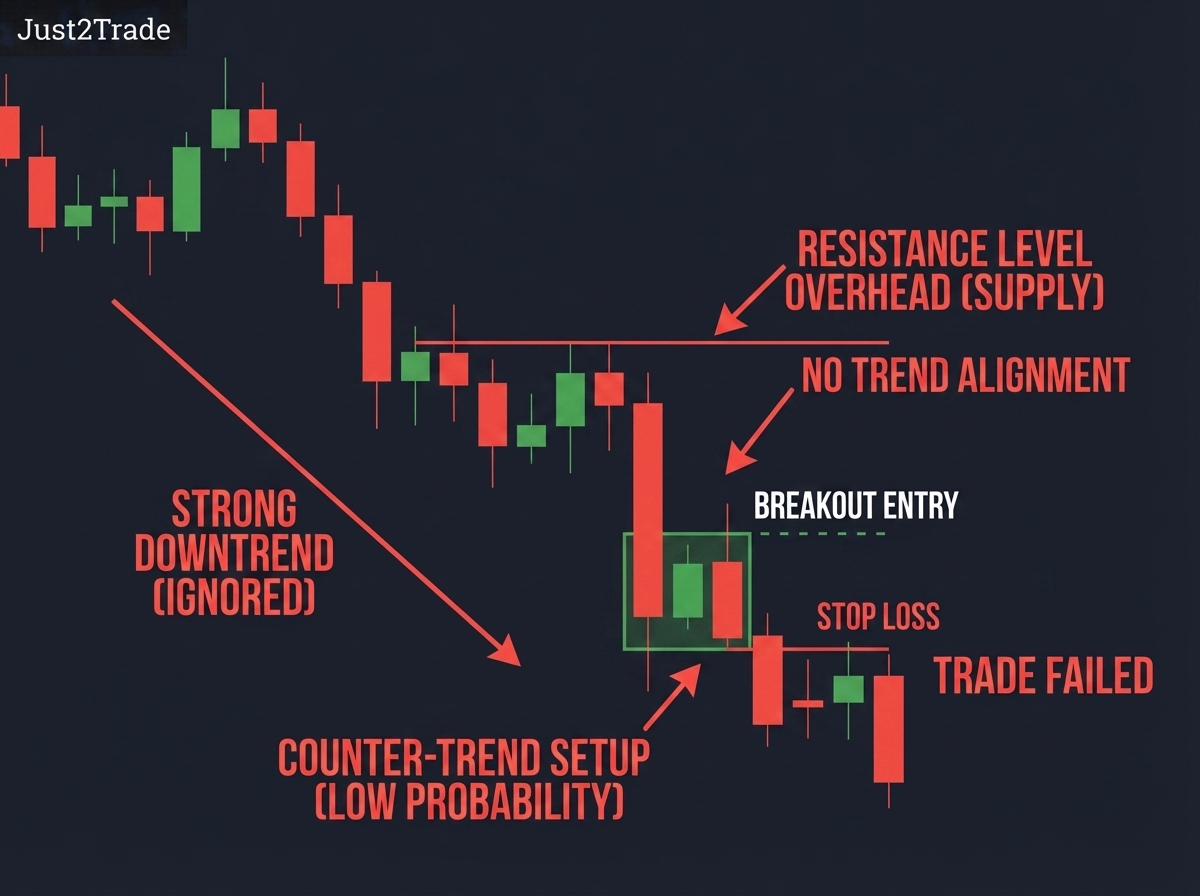
Market Trend direction determines whether an inside bar breakout has momentum behind it or against it. A technically perfect inside bar forming against a strong trend carries a substantially lower probability of follow-through than an identical pattern forming in the trend direction.
Inside bars at random price levels in trend structure midpoints lack the support and resistance confluence that defines high-probability setups. Context analysis requires checking the daily chart trend before examining any inside bar on the 4-hour or 1-hour chart, regardless of how clean the pattern structure appears.
Mistake #2: Trading Every Inside Bar
Taking every inside bar that appears on a chart without filtering for quality produces below-average outcomes and steadily erodes capital through commissions and small losses.
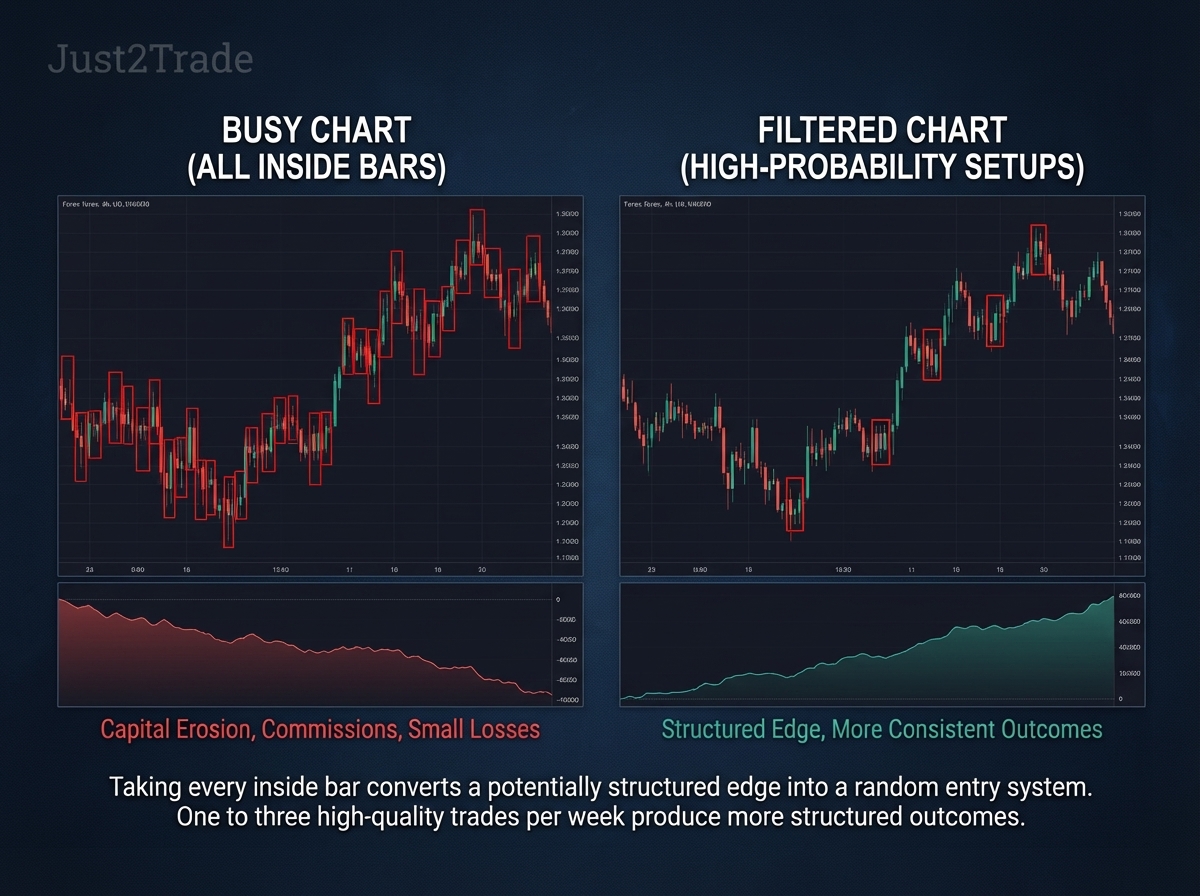
Inside bar patterns appear on major forex pairs multiple times per week on the 4-hour chart. Only a small proportion meet the full context criteria for high-probability setups. Trading all of them converts a potentially structured edge into a random entry system.
One to three high-quality inside bar trades per week per instrument, in favourable trending conditions, tends to produce more structured outcomes than ten unfiltered entries — though no trade frequency provides protection against losses in fast-moving or unexpected market environments.
Mistake #3: Inadequate Risk Management
Risk management failures — including oversized positions, poorly placed stops, and ignoring minimum risk-to-reward thresholds — undermine profitable inside bar identification entirely.
| Consecutive losses |
Account balance (10% risk/trade) |
Recovery needed |
Account balance (1% risk/trade) |
Recovery needed |
| Start |
$10,000 |
— |
$10,000 |
— |
| 3 losses |
$7,290 |
+37% |
$9,703 |
+3.1% |
| 5 losses |
$5,905 |
+69% |
$9,510 |
+5.2% |
| 8 losses |
$4,305 |
+132% |
$9,227 |
+8.4% |
| 10 losses |
$3,487 |
+187% |
$9,044 |
+10.6% |
Risk management for inside bar trades requires three non-negotiable rules.
First, position size calculation must limit each trade to 1-2% of total account capital, calculated from the entry to stop distance.
Second, no trade should be entered unless the minimum risk-to-reward ratio is 1:2, meaning the measured target is at least twice the distance from entry to stop.
Third, the stop must be placed beyond a structurally logical level — mother bar boundary or child bar boundary — not at a round number or arbitrary distance.
Advanced Inside Bar Trading Concepts
Advanced inside bar trading techniques extend the core methodology through multiple timeframe analysis, pattern combination, squeeze identification, and mean reversion applications.
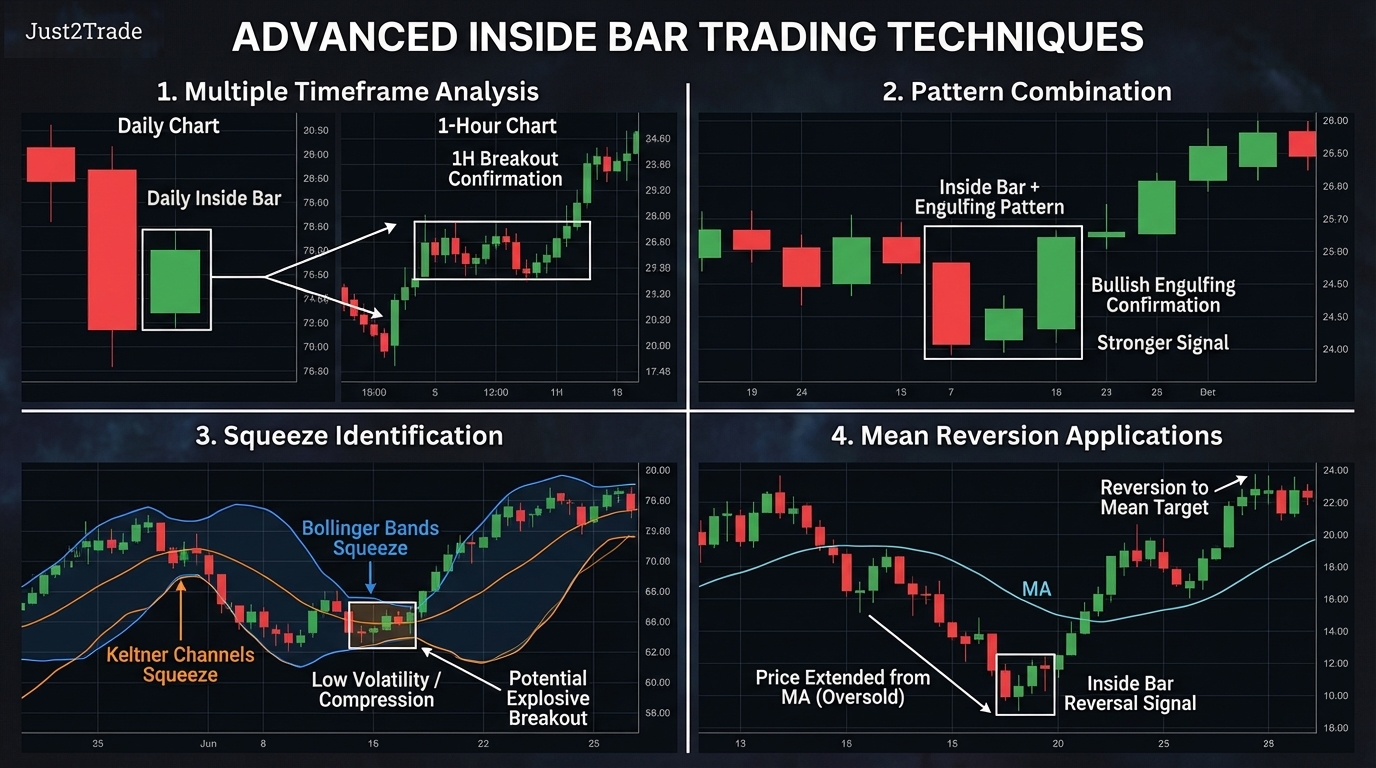
Multiple Timeframe Inside Bar Analysis
Multiple timeframe analysis combines a daily chart inside bar with 4-hour or 1-hour chart entry timing to improve entry precision without changing setup quality assessment.
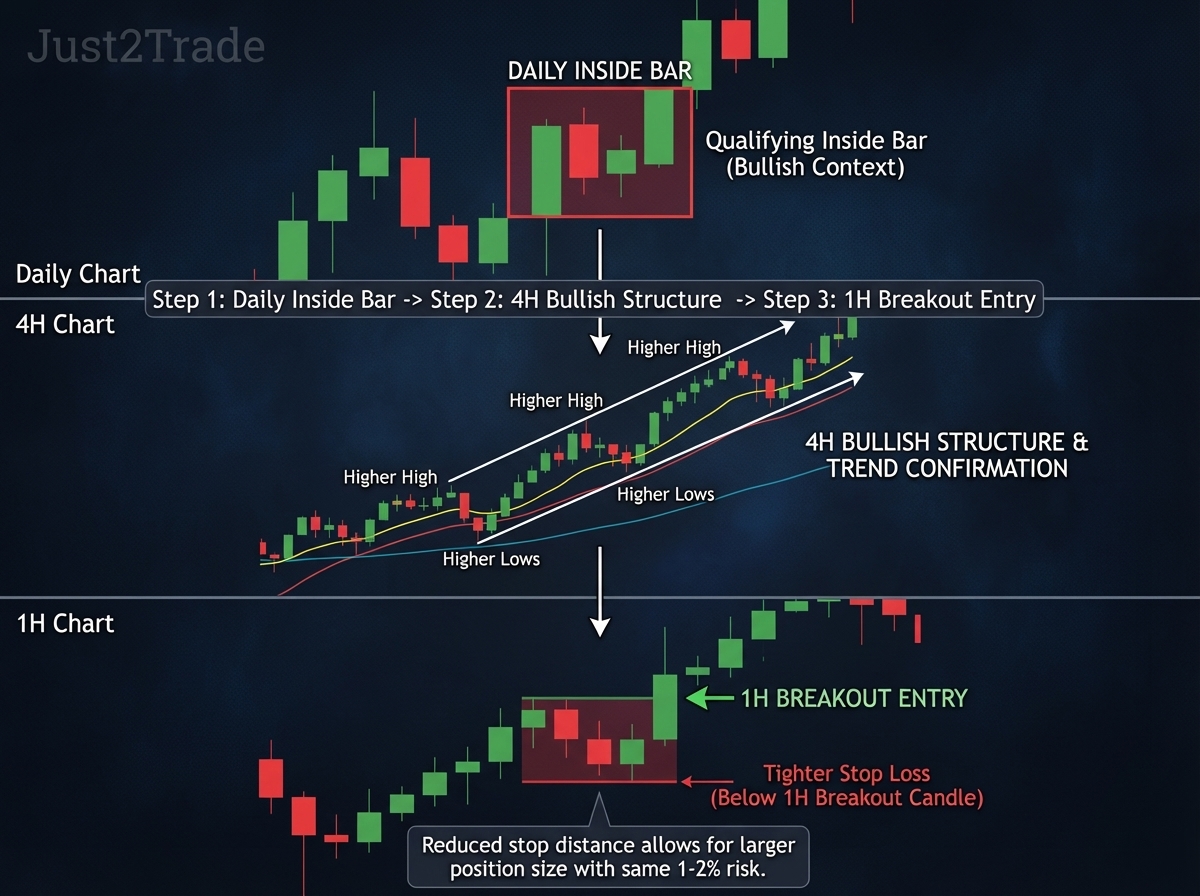
Step 1: Identify a qualifying inside bar on the daily chart using the standard context filters.
Step 2: Drop to the 4-hour chart and confirm the same directional bias through trend structure and moving average alignment.
Step 3: Use the 1-hour chart to time the entry at the precise breakout, placing the stop below the 1-hour breakout candle rather than the full daily mother bar low.
The tighter entry reduces stop distance compared to daily-chart-only entries, and the same 1-2% account risk supports a proportionally larger position size.
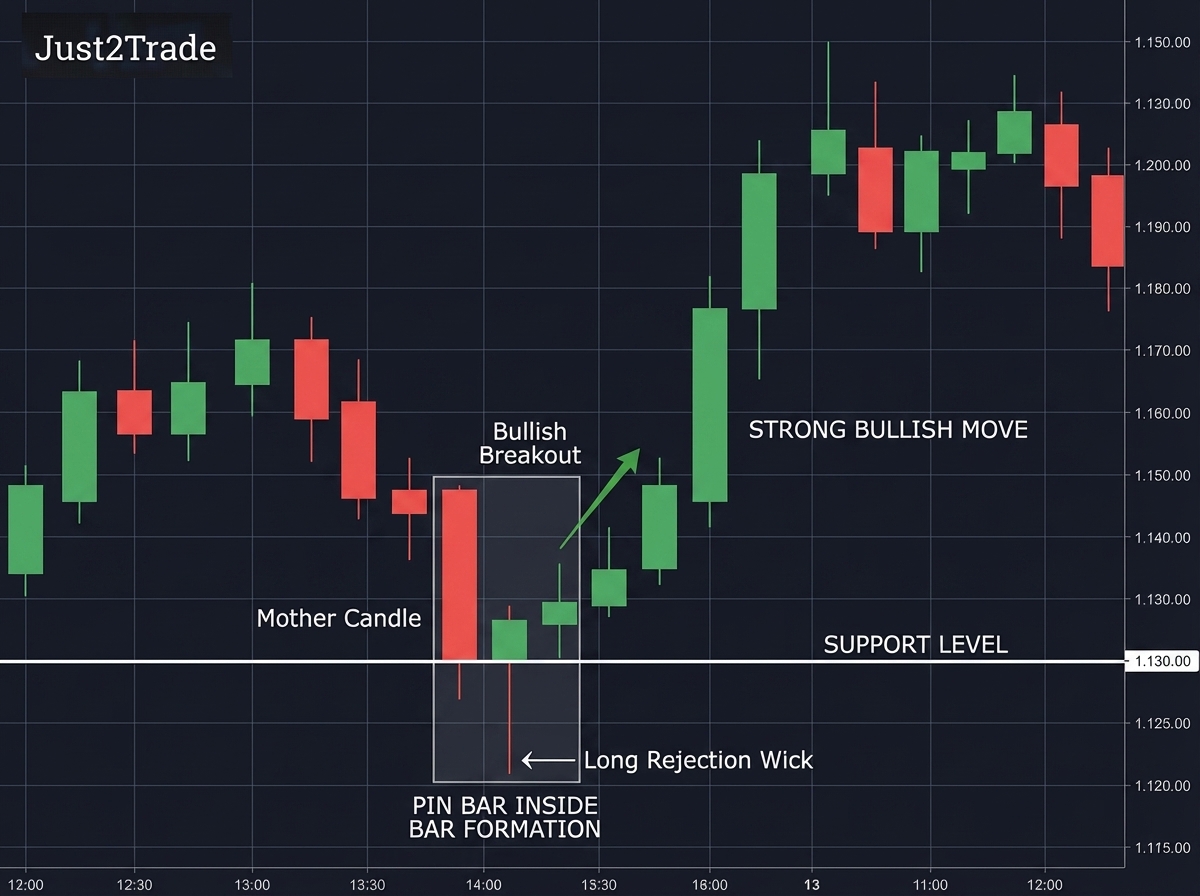
Pin Bar Inside Bar Combination
The pin bar inside bar combination forms when the child bar of an inside bar pattern is simultaneously a pin bar showing a long rejection wick.

Candlestick pattern recognition identifies a pin bar by its small body near one end of the bar's range and a long wick extending in the rejection direction. When the child bar of an inside bar is also a pin bar with a long lower wick at a support level, the setup combines compression (inside bar) and rejection (pin bar) into one formation.
These combination setups form infrequently on the daily chart but carry the highest reliability rating of any inside bar variation when they appear at major support and resistance levels.
Inside Bar Mean Reversion Plays
Inside bar mean reversion setups apply the pattern in overextended conditions, targeting a return to a mean price level rather than a continuation of a breakout.
Mean reversion inside bar setups differ from breakout setups in one key respect: the directional target is a return to a structural average rather than an extension of the prior move.
Price Action identifies mean reversion candidates when price has moved more than 2 Average True Range (ATR) units from the 200 SMA and forms an inside bar at a tested resistance (for short setups) or support (for long setups) near that extreme. The 200 SMA or the nearest structural level between entry and the mean serves as the profit target.
Inside Bar Trading Strategy Framework
A complete inside bar trading strategy integrates market analysis, pattern identification, entry execution, risk management, and trade management into a repeatable system.
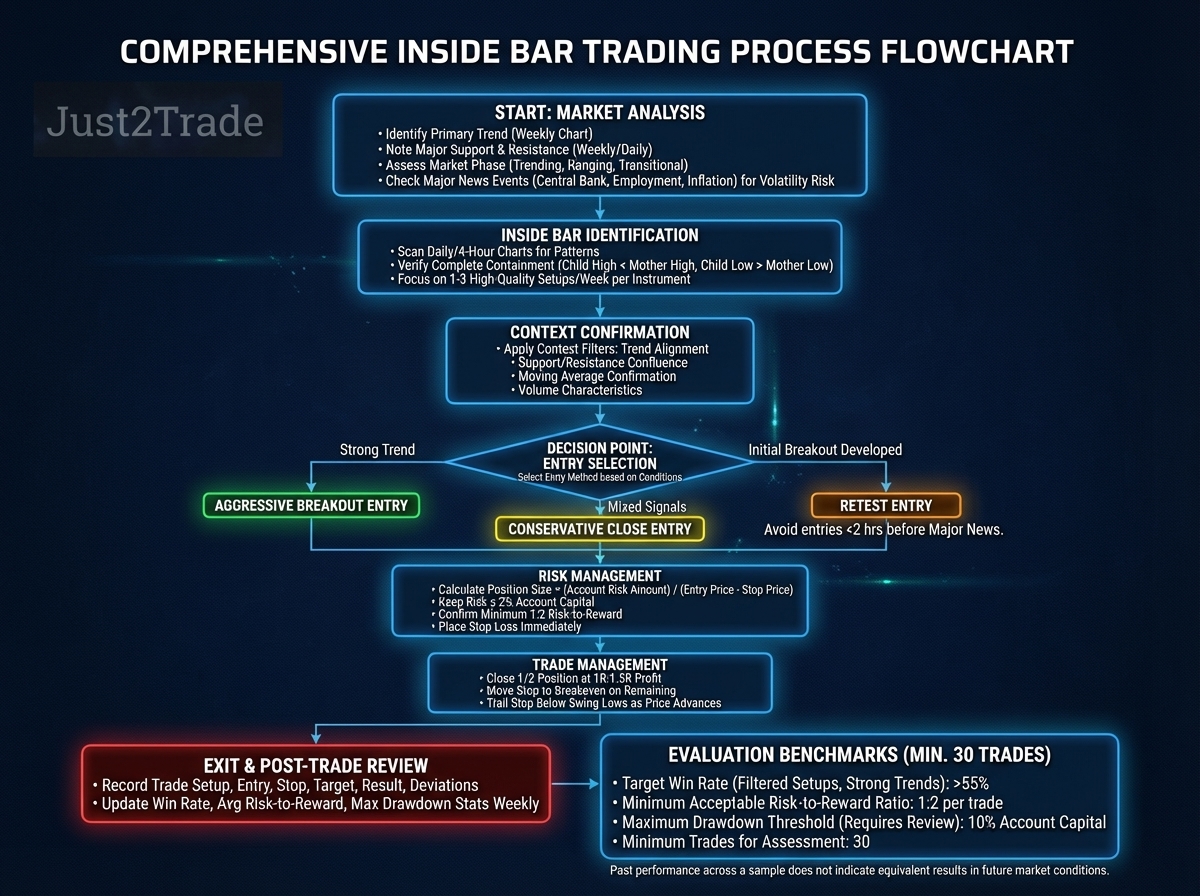
Step 1: Market analysis. Identify the primary trend on the weekly chart. Note major support and resistance levels on the weekly and daily charts. Assess market phase (trending, ranging, or transitional). Check for scheduled major news events — central bank decisions, employment data, inflation releases — that could invalidate technical setups through gap moves or abnormal volatility.
Step 2: Inside bar identification and qualification. Scan daily and 4-hour charts for inside bar patterns. Verify complete containment (child bar high below mother bar high, child bar low above mother bar low). Apply context filters: trend alignment, support or resistance confluence, moving average confirmation, volume characteristics. Focus on one to three high-quality setups per instrument per week.
Step 3: Entry execution. Select the entry method based on current market conditions. Use aggressive breakout entry for strong trends, conservative close entry for mixed signals, and retest entry when an initial breakout has already developed. Avoid entries within two hours of scheduled major news releases that carry high volatility risk for the instrument.
Step 4: Risk management. Calculate position size: Position Size = (Account Risk Amount) / (Entry Price minus Stop Price). Keep risk at or below 2% of account capital. Confirm minimum 1:2 risk-to-reward before submission. Place the stop loss order immediately on entry.
Step 5: Trade management. Close half the position at 1R to 1.5R profit. Move the stop to breakeven on the remaining position. Trail the stop below swing lows for long trades as price advances.
Step 6: Post-trade review. Record the trade setup, entry, stop, target, result, and deviations from the plan. Update win rate, average risk-to-reward, and maximum drawdown statistics weekly.
The following metrics provide evaluation benchmarks over a minimum of 30 trades. Past performance across a sample does not indicate equivalent results in future market conditions:
- Target win rate for filtered inside bar setups in strong trends: above 55%
- Minimum acceptable risk-to-reward ratio: 1:2 per trade
- Maximum drawdown threshold requiring strategy review: 10% of account capital
- Minimum trades before assessing strategy effectiveness: 30
Conclusion: Mastering Inside Bar Pattern Trading
The inside bar pattern is a structurally clear price action signal that can support disciplined trading when applied with proper context analysis and consistent risk management. No pattern produces guaranteed outcomes, and losses on individual trades are an inherent part of any market-based approach.
- Trade with the trend. Only take breakouts in the direction of the prevailing daily or 4H trend. Counter-trend setups carry materially lower probability of follow-through.
- Prioritise S/R confluence. The highest-probability setups form at confirmed support or resistance levels where multiple trader categories act on the same breakout simultaneously.
- Use proper stops. Place the stop beyond the mother bar or child bar boundary — the level where the setup is structurally invalidated — not at a round number or arbitrary distance.
- Practise patience and selectivity. One to three high-quality setups per week per instrument outperforms ten unfiltered entries. Every pattern is technically valid; few are contextually worth trading.
- Manage risk without exception. Limit each trade to 1–2% of account capital. Confirm a minimum 1:2 risk-to-reward before entry. No single setup justifies breaking either rule.
Trading with the inside bar pattern requires selectivity rather than frequency. Every element in this guide serves the same goal: filtering structurally supported setups from the many technically valid but contextually weak patterns that appear on every chart every week.
Price action mastery develops through repetition and honest post-trade review. For traders ready to apply these principles, the Just2Trade trading platform provides the charting tools and order management functions the strategy requires.
FAQ
-
What is an inside bar pattern in trading?
An inside bar pattern is a two-bar price action formation where the second bar's high and low are completely contained within the first bar's range. The first bar is the mother bar and the second is the child bar. The pattern signals volatility contraction before a potential directional breakout.
-
How do you identify a valid inside bar pattern?
A valid inside bar pattern requires the child bar's high to sit below the mother bar's high and the child bar's low to sit above the mother bar's low. Equal highs or lows technically qualify but produce weaker setups. The pattern must be confirmed on a clean chart before applying context filters for trend alignment and support or resistance confluence.
-
What is the difference between inside bars and outside bars?
An inside bar fits entirely within the range of the preceding bar, signalling consolidation and compression. An outside bar engulfs the preceding bar entirely, signalling a decisive directional move or reversal. Inside bars reflect indecision; outside bars reflect momentum. Both are bar pattern formations, but they carry opposite structural implications for breakout traders.
-
When is the best time to enter an inside bar trade?
The best entry signal for an inside bar trade occurs on the breakout of the mother bar's boundary. Aggressive traders place stop orders 1-2 pips beyond the mother bar high or low before the breakout. Conservative traders wait for a bar to close beyond the mother bar boundary. Retest traders enter on the pullback to the broken mother bar level after the initial breakout confirms.
-
Where should I place my stop loss on inside bar trades?
Stop loss placement on inside bar trades goes 2-5 pips beyond the opposite side of the mother bar from the entry direction. A long trade entered above the mother bar high carries the stop below the mother bar low. Experienced traders using tight stops place the exit beyond the child bar instead, improving risk-to-reward but accepting a higher stop-out frequency.
Trading on financial markets carries risks. The value of the investments can both increase and decrease and the investors may lose all their investment capital. In case of a leveraged product, the loss may be more than the initial capital invested. Detailed information on risks associated with trading on financial markets can be found in General Terms and Conditions for the Provision of Investment Services.